Quantitative Topographical Characterization
of Thermally Sprayed Coatings
by Optical Microscopy
P. Schwaller, R. Zu¨st, and J. Michler(Submitted May 13, 2008; in revised form August 25, 2008)
Topography measurements and roughness calculations for different rough surfaces (Rugotest surface comparator and thermally sprayed coatings) are presented. The surfaces are measured with a novel quantitative topography measurement technique based on optical stereomicroscopy and a comparison is made with established scanning stylus and optical profilometers. The results show that for most cases the different methods yield similar results. Stereomicroscopy is therefore a valuable method for topo-graphical investigations in both quality control and research. On the other hand, the method based on optical microscopy demands a careful optimization of the experimental settings like the magnification and the illumination to achieve satisfactory results.
Keywords coatings for gas turbine components, properties of coatings, roughness effects
1. Introduction
Thermal spraying is an established technology for the fabrication of coatings in a thickness range of a few lm up to several hundred lm (Ref1). Typical application fields of thermally sprayed coatings are those that require wear and corrosion protection, low friction surfaces, or the biological compatibility of coatings. For example, turbine blades used in hydroelectric power plants can be covered by thermally sprayed Tungsten Carbide-Cobalt-Chromium (WC-Co-Cr) coatings (Ref2,3). An important issue for the successful application of such coatings is the control of the roughness of the substrate as well as of the coating. For good adhesion between the sprayed coating and the substrate, an optimal substrate surface topography is often needed (Ref4,5). For medical implants the surface morphology and roughness on different length scales must be optimized for good adhesion of cells (Ref6). It is therefore indispensable to have tools for a quantitative characterization of the topography.
There exist several techniques for quantitative topog-raphy measurements (Ref 7, 8). The most common are stylus or optical profilometers. Measurement procedures and the data analysis are standardized (Ref 9). Surface
inspection by optical stereomicroscopy is also common but this technique does not provide directly full 3D coordi-nates of the surface. In a stereomicroscope, two images from slightly different perspectives are captured. By using an algorithm that associates related pixels from both images, the topography can be obtained. Together with the associated optical data (perspective angle, magnifica-tion, pixel size) a topographical surface model can be calculated. This approach is used by the Leica Stereo-Explorer software and applied in this work.
There are fundamental differences between the scan-ning methods and the method based on optical stereo-microscopy (labeled SM hereafter). The sequential data acquisition of scanning profilometers for large scanned areas or high measurement point densities may take more than 1 h. SM data are recorded at once and the sub-sequent calculation only needs a few minutes and is therefore less prone to experimental artifacts such as thermal drift. For scanning profilometers the maximal resolution is fixed. The vertical resolution is given by the sensor used for measuring the topography. The lateral resolution for the majority of these instruments is limited by their respective positioning tables and is about 1 lm. Their vertical measurement range is generally limited to a few 100 lm. In the field of thermal spraying the vertical surface structures may easily exceed 500 lm. As a conse-quence, stylus and optical profilometers may often be at their limits for an accurate determination of the surface topography. SM changes its lateral resolution with the chosen magnification of the optical microscope. The vertical resolution is also governed by the chosen magni-fication: higher resolution is obtained at higher magnifi-cations. The vertical measurement range determined by the depth of focus is in this case reduced.
Therefore the specifications of SM are well suited for topographical investigations of surfaces in the field of thermal spraying. Due to the systematic differences in the P. Schwaller and J. Michler, Laboratory for Mechanics of
Mat-erials and Nanostructures, Empa, MatMat-erials Science and Tech-nology, Feuerwerkerstrasse 39, CH 3602 Thun, Switzerland; and R. Zu¨st, Leica Microsystems, Max Schmidheiny-Strasse 201, CH-9435 Heerbrugg, Switzerland. Contact e-mail: patrick.schwaller@ empa.ch. JTTEE5 18:96–102 DOI: 10.1007/s11666-008-9280-3 1059-9630/$19.00 Ó ASM International
Peer
Reviewed
established methods a thorough comparison between the different methods is necessary to validate SM for quanti-tative topography measurements. In this paper topogra-phy and roughness measurements performed with SM on two different thermally sprayed WC-Co-Cr coatings sur-faces and on a Rugotest surface comparator shall dem-onstrate to what extent the SM method is a valid alternative to standard scanning profilometers.
2. Experimental Methods
2.1 Scanning ProfilometersStylus profilometers scan the surface with a diamond stylus (radius 2 or 5 lm) and with a typical contact force of 100 lN. The advantage of stylus experiments is that the measurement procedure is standardized (Ref9). The major drawback is the fact that soft surfaces may be modified by the diamond stylus. Characteristic lateral and vertical measurement ranges are 100 mm and 200 lm, respectively. The corresponding resolutions are 50 nm (vertical) and 1 lm (lateral). For this study an instrument from UBM Corporation, Sunnyvale, CA 94089, USA is used.
The principle of the laser profilometer used in this study (from UBM Corporation, Sunnyvale, CA 94089, USA) is the auto-focusing of a 1 lm diameter laser spot on the surface. The adjustment of the optics for auto-focusing along the vertical direction is a measure for the surface topography. The lateral and vertical measurement ranges for the laser profilometer used in this study are 100 mm and 100 lm, respectively. The corresponding resolutions are 1 lm (lateral) and 20 nm (vertical).
For a white light profilometer the surface of the sample is illuminated by focalized white light. The lens system used for the focalization has a strong but well-defined chromatic aberration. As a consequence, for each wave-length of the white light a different focal distance exists. The light of the wavelength for which the focal point is on the surface is analyzed. A spectrometer detects this wavelength, and the height information can be calculated. The advantage of a white light instrument compared to a laser profilometer is that no optical parts in the vertical direction have to be moved. This results in faster data acquisition. The lateral and vertical measurement ranges are 100 mm and 300 lm, respectively. The corresponding resolutions are 10 nm (vertical) and 1 lm (lateral). In this study, an Altisurf white light profilometer (ALTIMET, Avenue des Tilleuls, FR-74200, Thonon-les-Bains, France) is used. Compared to stylus instruments, soft samples can be measured with contact-free laser or white light instru-ments but difficulties may arise for both methods if trans-parent surfaces are to be measured because reflection sites on the sample may be ill defined and misinterpreted. 2.2 Stereomicroscopy with StereoExplorer
Software
The Leica StereoExplorer (Leica Microsystems Schweiz AG, CH-9435 Heerbrugg, Switzerland) provides
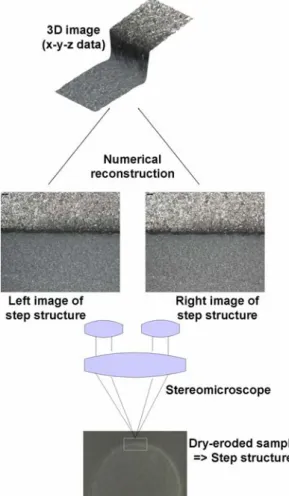
a possibility to extend the capability of a conventional stereomicroscope (here a Leica MZ 16A from Leica Microsystems Schweiz AG, CH-9435 Heerbrugg, Switzerland is used) to enable surface topography reconstruction. This surface topography can be used for qualitative and quan-titative analysis. Beside surface topography data, the SM-based method also assigns a texture map to the sur-face, which shows the color of the digitized sample. To generate the data model of the sample, a stereo image pair is captured using an integrated stereo camera. Due to a slight but well-defined and known difference in the per-spective angle of the two images, they show the same portion of the surface at slightly different positions in the image. The SM software automatically locates similar portions of the image and their offset in the two images. Using this offset and the optical configuration of the microscope and the camera, the software can calculate a height value for each surface point and assign its color to it. The flexibility of the stereomicroscope enables the adjustment of the system to the needs of the sample to be investigated. It covers a field of view of up to 31.7 9 23.5 mm with a depth of view of 3.12 mm and an optical resolution of up to 833 lines per mm depending on the system setup and the zoom position. An illustration of the different steps is shown in Fig. 1. The sample is a
Fig. 1 Illustration of the principle of quantitative topographical measurements using a stereomicroscope
Peer
thermally sprayed WC-Co-Cr coating (see photograph at the bottom of Fig.1). A circular part of the coating has been dry-eroded such that a step is induced. A section of this step (illustrated by the white rectangle in the photo-graph) has been imaged using the stereomicroscope. The two captured images are shown in the middle part of Fig.1. Using these two images, the topographical surface model is then calculated using StereoExplorer.
2.3 Samples
Different samples have been investigated for this comparative study between SM, scanning stylus, and scanning optical profilometers. For reference surface, a Rugotest surface comparator (see Ref10,11for images) featuring well-defined sinusoidal planed and turned sur-face textures is measured. Different sections of the Rugotest sample with different profile arithmetic average roughness (Ra) values can be assessed. Because in this
work the main focus is made on the measurement of rather rough surfaces typical for thermal spraying, only the Rugotest surfaces labeled CN9 (arithmetic average profile roughness Ra= 6.3 lm, reference value indicated
on the sample), CN8 (Ra= 3.2 lm), and CN7 (Ra= 1.6 lm)
were measured. Note that it is not indicated how these reference values have been determined. Due to its sinu-soidal surface structure this sample is also used to measure the lateral (wavelength k of the surface structure) and the vertical (amplitude A of the surface structure) precision. As a second set of samples, two thermally sprayed WC-Co-Cr coatings with different roughnesses (labeled hereafter ‘‘Sample 1’’ and ‘‘Sample 2,’’ respectively) deposited on steel substrates (DIN 1.4313) were studied. The coatings were deposited by high velocity oxy-fuel (HVOF) spraying. The conditions of the HVOF process using a top gun were as follows (see Ref3for details): The kerosene pressure was 21-23 bar, and the flow rate 20-24 L/h. The O2 pressure was 20-21 bar, and the flow
rate was 800-1000 L/min. The N2 pressure was 9-10 bar
with a flow rate of 15-17 L/min. The spraying distance was set to 0.3-0.5 m. A circular part of Sample 1 has been dry-eroded (see Ref3for details about the erosion process and Fig.1 for a photograph of the sample). Note that the coatings were not removed from the substrates. Dry-eroding was done only on a part of the coated steel sub-strate until the steel subsub-strate was visible. The other part of the coated steel substrate has been masked such that the coating was not damaged. Step height measurements were then done to determine the thickness of the removed coating.
3. Results and Discussion
3.1 General ConsiderationsTwo quantities that can be obtained from a topography measurement of a coating, step height and surface roughness, are often of particular interest. Step height measurements are used to determine the thickness of a
coating. Information about the surface roughness is of interest for the coating and the substrate. Because the arithmetic average roughness (labeled Ra for profiles, Sa
for surfaces) is the most popular one (Ref 12), the main focus here is on this parameter. Measuring average surface roughness values is a statistical approach to describe the microstructure of a surface with a single parameter value. Due to this statistical approach even accredited mea-surement institutes cannot go below a meamea-surement uncertainty of ±7% under best conditions (Ref13).
An important issue is the influence of the chosen magnification for the stereomicroscope (SM). The avail-able magnification (M) for the SM instrument used in this study ranges from M = 7.1 to M = 115. It turned out that for all investigated samples an optimal magnification range has to be found for reliable quantitative measurements. The selection of the optimal magnification is mainly gov-erned by the depth of field, which should be larger than the peak-to-peak height of the investigated surface. A possible inclined support of the sample has also to be considered thereby. An additional aspect concerns the area to be investigated. For SM, this area decreases with increasing magnification. Therefore a compromise between the lateral and vertical measurement ranges and the lateral and vertical resolutions must be found. Addi-tionally, the illumination settings must be optimized for reliable 3D reconstructions. In general, an iterative pro-cedure has to be applied for each ‘‘class’’ of samples (such as polished or matt metals, ceramics, polymers). Several images with different magnifications and illumination settings must be recorded and optimal parameters defined by the operator.
Another aspect to be regarded is the length that has to be measured for the accurate determination of roughness values. If standards (Ref9) are applied, then the length (or area) to be measured is specified by the standard and varies with the roughness of the sample. For that reason, the correct measurement length often has to be deter-mined in an iterative process: a roughness value must be estimated and a measurement using the corresponding parameters has to be performed. Depending on the obtained roughness value, the measuring parameters then need to be adjusted. The Raroughness values (as obtained
with the scanning methods) for the samples investigated in this study vary between 1.5 and 7.4 lm (refer to the fol-lowing sections). The default values for the length to be measured according to the standard are 5.6 mm for Ra
values between 0.1 and 2.0 lm, and 17.5 mm for Ravalues
between 2.0 and 10 lm. For the SM experiments the optimal magnification has to be determined for each investigated surface and this also influences the measured area. For the samples investigated in this study optimal results were found for magnifications between 50 and 90. This corresponds to side lengths of the recorded optical images of 2.3 and 1.3 mm, respectively. This means that with the stereomicroscope used in this study the mea-surements lengths are below the values prescribed by the standards. This may lead to differences of the roughness values as determined by the different experimental methods.
Peer
Finally it should be mentioned that another potential error source in a comparison as made in this study is the data treatment after the measurement. A linear or qua-dratic background leveling of the raw data is a common procedure but influences the subsequently calculated roughness values. To ensure the maximum of accuracy for the comparison of the different methods, identical data treatment procedures have been applied to all data sets for a given sample.
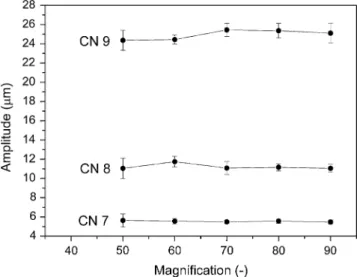
3.2 Height Measurements: Rugotest Surfaces The investigated Rugotest surfaces (CN9, CN8, CN7) yield a sinusoidal profile superimposed to a cylindrically shaped form. The amplitude of this sinusoidal surface structure has been measured. Prior to the amplitude determination the cylindrically shaped basis was sub-tracted from the raw 3D data. Figure2 shows the mea-sured amplitudes of the Rugotest CN surfaces as measured with SM. As can be seen, the obtained results can be considered as independent from the chosen mag-nification. A comparison of the SM results with values from a stylus and a laser profilometer is given in Table1. For the determination of the amplitude values, four line profiles have been extracted at different locations of measured 3D data. The values for SM indicated in Table1
are averaged values from four measurements per magni-fication done at the same magnimagni-fications as indicated in Fig.2. As can be seen from Table1, the measured amplitude values agree fairly well. The wavelengths k (not shown) of the investigated Rugotest surfaces were found to match within 4% for all methods used and for all Rugotest surfaces investigated. It is therefore concluded that SM yields identical information when compared to the established classical methods.
3.3 Step Height Measurements
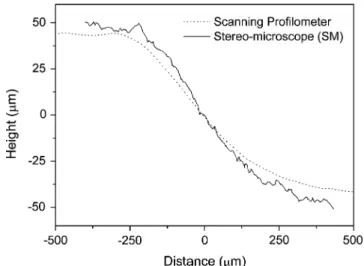
Figure3 shows the measured step height induced by dry-erosion of the thermally sprayed WC-Co-Cr coating surface (Sample 1) as measured with SM. Again the determined step height values are similar for most of the chosen magnifications. The rapid decrease of the mea-sured step height values for magnifications above 85 is explained as follows: The depth of field depends on the setup of the iris diaphragm and the chosen magnification. All SM measurements presented here have been done with a half-open iris diaphragm. For magnifications above 85 the depth of field is smaller than the peak-to-peak value of the raw data, which is about 160 lm. This value is not only given by the step on the surface but also by an in-clined support of the sample. As a consequence, no fully focused images can be captured with SM for the investi-gated sample with magnifications above 85. Measured profiles of the step induced by dry-erosion are displayed in Fig.4. Profile shapes as measured with two different methods (scanning white light profilometer: dotted line, SM: solid line) are in fair agreement. One can easily observe that the profile measured with SM shows a ‘‘more structured’’ shape than the one with white light profi-lometer. This is due to a better lateral resolution and higher data density that results from the measurement with SM. In principle, the higher the data density and the resolution, the closer the true shape of the profile that can be measured and displayed. On the other hand one has to
Table 1 Amplitude values and standard deviations of the sinusoidal profile shape for the Rugotest surfaces CN9, CN8, and CN7 as measured with SM, stylus, and laser profilometers
Method Amplitude CN9, lm Amplitude CN8, lm Amplitude CN7, lm Stylus 26.7 ± 0.1 12.0 ± 0.1 ÆÆÆ Laser 25.1 ± 0.4 11.0 ± 0.1 5.5 ± 0.3 SM 24.9 ± 0.9 11.2 ± 0.6 5.5 ± 0.3
Fig. 2 Amplitudes for the Rugotest CN9, CN8, and CN7 sur-faces as measured with SM
Fig. 3 Step height induced by dry-erosion of a WC-Co-Cr coating (Sample 1) as measured with SM
Peer
ensure that noise-induced errors (e.g., due to incorrect camera settings) are not confounded with real surface structures. The step height values indicated in Table2
reveal that SM measurements yield similar values com-pared to the data obtained with a scanning white light profilometer. The values given in Table2are the average obtained from four single profiles extracted from 3D data sets.
3.4 Average Profile Roughness Ra
Average profile roughness (Ra) for the Rugotest
sur-faces CN9, CN8, and CN7 determined with a Stylus, a Laser profilometer, and SM are presented inTable3. The label reference indicates the nominal values given by the Rugotest manufacturer. It is not indicated on the refer-ence sample or its documentation under what conditions
the reference values have been measured and what mea-surement uncertainty has do be considered for it. The CN7 surface could not be measured with the stylus profilometer due to its limited resolution. All results are average values (with standard deviation values) obtained from four single data sets. For SM the data has been collected with mag-nifications 50, 60, 70, 80, and 90, respectively.
3.5 Average Surface Roughness Sa
Average surface roughness values (Sa) of the two
investigated WC-Co-Cr surfaces as determined by scan-ning white light profilometer and SM are indicated in Table 4. For the white light profilometer, measurements at three different locations have been done. The Sa value
obtained from SM is an average value from 4 to 6 mea-surements each done at different locations for magnifica-tions of 80, 90, and 100, respectively. For the calculation of Saa reference plane has been subtracted from the raw 3D
data to account for an inclined sample support. SM data have been analyzed by the MEX software package (Alicona Imaging GmbH, Grambach, Austria) and the white light data by the software supplied with the instru-ment. As can be seen from Table 4, both methods yield rather similar roughness values. Note that all measure-ments have been done on different locations of the sam-ple. The presented results therefore indicate that the SM method for quantitative topographical measurements based on optical microscopy can be used to reliably determine the average roughness of thermally sprayed coatings. An important aspect for a reliable determination of surfaces such as thermally sprayed coatings is an accurate determination of a reference plane prior to the calculation of the roughness value. The experiments revealed that at least 25 interpolation points have to be taken for the calculation of the reference plane. This is illustrated in Table5. For a single SM data set measured on the dry-eroded WC-Co-Cr specimen (Sample 1),Saand
St(peak-to-peak value or profile height) roughness values
have been determined using references planes calculated with different numbers of interpolation points. As can be clearly deduced from Table5, at least 25 interpolation points are necessary to obtain roughness values that are independent from the number of interpolation points. It is, however, not possible to generalize this finding for all types of samples. One should note that the number of interpolation points must be chosen such that the calcu-lated roughness values are independent of the number of points.
Table 2 Step height values and standard deviations for the dry-eroded WC-Co-Cr surface (Sample 1) as measured with SM and a scanning white light profilometer
Method Step height, lm
White light 82 ± 9
SM 79 ± 12
Fig. 4 Step height profiles of the dry-eroded WC-Co-Cr coating (Sample 1) measured with a scanning white light profilometer (dotted line) and SM (solid line). The magnification was 65 for the SM measurement
Table 4 Saroughness values (ISO 4287) and standard
deviations of the two investigated WC-Co-Cr specimens as measured with the scanning white light profilometer and SM
Method Sa, lm ‘‘Sample 1’’ Sa, lm ‘‘Sample 2’’
White light 3.9 ± 0.4 7.1 ± 0.3
SM 3.6 ± 0.2 7.4 ± 0.4
Table 3 Average profile roughness Raand standard
deviations for the Rugotest surfaces measured with different methods Method CN9 Ra, lm CN8 Ra, lm CN7 Ra, lm Reference value 6.3 3.2 1.6 Stylus 6.7 ± 0.3 3.3 ± 0.1 ÆÆÆ Laser 5.6 ± 0.1 2.9 ± 0.1 1.5 ± 0.1 SM 6.5 ± 0.3 3.2 ± 0.2 1.9 ± 0.2
Peer
Reviewed
3.6 Advantages and Constraints of SM
Beside the fact that SM yields similar surface topographies and roughness values when compared to ‘‘classical’’ scanning profilometers and that it has a larger vertical measurement range, there are more benefits: SM allows first to examine rapidly a large part of the sample surface with low magnification. From this the region for high magnification images and topographical reconstruc-tion are chosen. The method yields a 3D data set of the surface topography and colored optical micrographs at the same time. It is also possible to first record the two optical micrographs and then reconstruct the sample topography at a later time. This may be important when the method is used as a control tool in a production process.
A major difference between the scanning methods and SM is the point density of a data set. For scanning profi-lometers a typical data set has lateral step size of the data points between 1 and 100 lm. The typical total number of data points is about 105. SM images and data sets contain several 106data points. For a roughness parameter like Sa
where data points are averaged, possible outliers are likely to be smeared out. For parameters like the peak-to-peak height Stevery single data point is relevant. As shown in
the previous section, a fair agreement for Sa values
determined with the different experimental methods has been found. For the parameter St, however, significantly
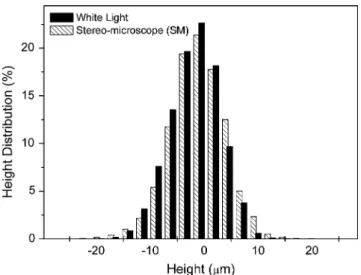
higher values were found for SM compared to the scan-ning methods. This is attributed to a few outlying data points resulting from inappropriate image quality or reconstruction settings. Figure5 shows as example the height distributions for a white light profilometer (black bars) and a SM (dashed bars) measurement done on the dry-eroded WC-Co-Cr surface. TheStvalues for these two
data sets are 38 lm (white light) and 66 lm (SM), respectively. Typical standard deviations for Stare about
±4 lm. The huge difference between the white light and the SM can therefore not be explained by statistical rea-sons. From the data ofFig.5it can however be found that 99.9% of the points of the SM data set lie within the height interval given by the white lightSt value. This
corrobo-rates the assumption of having just a few outlying points in the SM data set. A careful inspection of the raw data regarding outlying points is therefore recommended prior to the application of analysis algorithms. This also requires
that the measurements and the data analysis are done by a skilled operator.
Difficulties may in addition appear if highly reflective surfaces are measured with SM. In these cases, the determination of optimal illumination settings turned out to be very sophisticated. Furthermore, insufficient surface texture or periodic surface structures may cause problems in the calculation of a reliable 3D reconstruction from stereo images. For transparent samples one has to be sure that information from the top and the bottom surfaces is not mixed. It may be an advantage for SM that the image recorded with the optical microscope can be controlled by the operator prior to the calculation of the surface. By this, possible errors may be ruled out.
4. Conclusions
In this paper a novel quantitative topography mea-surement instrument based on optical microscopy com-bined with image reconstruction has been compared to ‘‘classical’’ scanning profilometers. The results show that the novel SM method yields satisfactory results for typical samples in the field of thermally sprayed coatings. A major advantage of SM compared to typical scanning profilo-meters is the large vertical measurement range. This makes this novel method suitable for thermally sprayed coatings and other engineering surfaces. Typical mea-surement/computing times for SM are favorable compared to scanning methods with measurement times up to an order of magnitude longer. At the same time SM mea-surements result in a surface topography with a much higher data point density, which increases surface resolu-tion. In addition, SM allows a large degree of freedom regarding the sample size and geometry. The stereomi-croscope used with SM can also be used for other visual Table 5 Saand Stroughness values (ISO 4287) from
a single SM measurement measured on the dry-eroded WC-Co-Cr surface (Sample 1). The subtracted reference plane has been calculated using different numbers of interpolation points Interpolation points Sa, lm St, lm 0 15.1 104.4 4 4.7 72.6 9 4.2 66.4 16 4.3 64.0 25 3.9 62.8 36 4.0 64.9 49 3.9 64.6
Fig. 5 Height distribution for the dry-eroded WC-Co-Cr coat-ing (Sample 1) measured with a scanncoat-ing white light profilometer (black bars) with SM at a magnification of 80 (dashed bars)
Peer
inspection and documentation tasks beside surface topography measurements. The additional investment to enable the system to work with StereoExplorer is limited to the software alone. This makes the value-to-cost ratio very attractive compared to specialized measurement systems like scanning laser and white light profilometers. Problems may occur if peak-to-peak information like the Stroughness value is determined because SM seems to be
more susceptible to outlying data points due to nonop-timized illumination or reconstruction settings. The major drawback of SM compared to stylus, laser, or white light profilometers is that the obtained results are more sensi-tive to operator-related settings such as the illumination of the sample.
Acknowledgments
The authors would like to thank S. Siegmann and M. Hadad (Empa) for providing the samples and for stimu-lating discussions and support.
References
1. L. Pawlowski, The Science and Engineering of Thermal Spray Coatings, John Wiley and Sons, Chichester, 1995
2. P. Schneider, S. Siegmann, and R. Hitzek, High Temperature Wear Behaviour of Thermally Sprayed Hardmetal Coatings for Steam Valve Spindle Application, ITSC 2002 International Thermal Spray Conference, Essen, TSS of ASM; IIW/IIS, 1, 2002, p. 306-311
3. M. Hadad, R. Hitzek, P. Buergler, L. Rohr, and S. Siegmann, Performance of Sandwich Structured WC-Co-Cr Thermally Sprayed Coatings Using Different Intermediate Layers, Wear, 2007, 263, p 691-699
4. S. Siegmann and C.A. Brown, Surface Texture Correlations with Tensile Adhesive Strength of Thermally Sprayed Coatings Using Area-scale Fractal Analysis, Proceedings of 2nd United Thermal Spray Conference, DVS Verlag, 1999, p 355-360
5. M. Hadad, G. Marot, D. Chicot, J. Lesage, J. Michler, and S. Siegmann, Adhesion Tests for Thermal Spray Coatings: Corre-lation of Bond Strength and Interfacial Toughness, Surf. Eng., 2007, 23, p 279-283
6. B.D. Boyan, et al., The Titanium-Bone Cell Interface In-Vitro: The Role of the Surface in Promoting Osteointegration, Titanium in Medicine: Materials Science, Surface Engineering, Biological Responses, and Medical Applications, D.M. Brunette, et al., Eds., Springer, New York, 2001, p 561-585
7. D.J. Whitehouse, Handbook of Surface Metrology, Isnt. Phys. Publ., Bristol, 1994
8. K.J. Stout, Three Dimensional Surface Topography, Penton Press, New York, 2000
9. Refer to the standards: ISO 3274 (Geometrical Product Specifi-cations (GPS)—Surface Texture: Profile Method—Nominal Characteristics of Contact (stylus) instruments, 1996) and ISO 4287 (Geometrical Product Specifications (GPS)—Surface Tex-ture: Profile Method—Terms, Definitions and Surface Texture Parameters, 1997)
10. www.elcometer.com. Accessed 10 November 2008
11. www.gardco.com/pages/surface_profile/roughnesscomparison.htm. Accessed 10 November 2008
12. A survey of the International Institution for Production Engi-neering research with 284 companies from 18 countries revealed that 92% are mainly using Raroughness value
13. Kalibrierstelle fu¨r die Messgro¨ssen La¨nge und Rauheit; NTB, Interstaatliche Hochschule fu¨r Technik Buchs, Institut fu¨r Qualita¨tstechnologie,www.ntb.ch/qt