ORIGINAL ARTICLE
Effects of anti-resorptive agents on trabecular bone score (TBS)
in older women
M. A. Krieg&B. Aubry-Rozier&D. Hans&W. D. Leslie&
for the Manitoba Bone Density Program
Received: 10 April 2012 / Accepted: 20 September 2012 / Published online: 3 October 2012 # International Osteoporosis Foundation and National Osteoporosis Foundation 2012
Abstract
Summary We evaluated the longitudinal effects of anti-resorptive agents (534 treated women vs. 1,150 untreated) on lumbar spine bone mineral density (BMD) and trabecular bone score (TBS). TBS was responsive to treatment in women over age 50. The treatment-related increase in TBS was less than the increase in BMD, which is consistent with bone texture preservation.
Introduction In addition to inducing an increase in BMD, anti-resorptive agents also help to preserve bone architecture. TBS, a new gray-level texture measurement, correlates with 3D parameters of bone micro-architecture independent of BMD. Our objective was to evaluate the longitudinal effects of anti-resorptive agents on lumbar spine BMD and TBS. Methods Women (≥50 years), from the BMD program da-tabase for the province of Manitoba, Canada, who had not received any anti-resorptive drug prior to their initial dual X-ray absorptiometry (DXA) exam were divided into two groups: untreated, those without any anti-resorptive drug over the course of follow-up, and treated, those with a non-estrogen anti-resorptive drug (86 % bisphosphonates, 10 % raloxifene, and 4 % calcitonin). Lumbar spine TBS was calculated for each lumbar spine DXA examination. Changes in TBS and BMD between baseline and
follow-up (mean follow-follow-up 3.7 years), expressed in percentage per year, were compared between the two groups.
Results A total of 1,150 untreated women and 534 treated women met the inclusion criteria. Only a weak correlation was seen between BMD and TBS in either group. Significant intergroup differences in BMD change and TBS change were observed over the course of follow-up (p<0.001). Similar mean decreases in BMD and TBS (−0.36 %/year and −0.31 %/year, respectively) were seen for untreated subjects (both p<0.001). Conversely, treated subjects exhibited a sig-nificant mean increase in BMD (+1.86 %/year, p<0.002) and TBS (+0.20 %/year, p<0.001).
Conclusion TBS is responsive to treatment with non-estrogen anti-resorptive drug therapy in women over age 50. The treatment-related increase in TBS is less than the increase in BMD, which is consistent with bone texture preservation. Keywords Anti-resorptive therapy . Bisphosphonates . Bone mineral density . Fracture risk . Osteoporosis . Trabecular bone score
Introduction
Osteoporosis is a major health concern in virtually all indus-trialized countries [1] due to the increased risk of fracture and the associated morbidity and mortality associated with these fractures, the mortality rate sometimes exceeding 20 % [2,3]. Up to nine million new osteoporotic fractures are projected worldwide each year [4]. Postmenopausal women are clearly the demographic group at greatest risk. In the USA, osteopo-rosis affects between four and six million postmenopausal women [5]. Increases in the life spans of both males and females are projected to double the magnitude of the osteo-porosis problem over the next 40–50 years [6].
M. A. Krieg
:
B. Aubry-Rozier:
D. Hans (*)Bone Diseases Unit, DAL, Lausanne University Hospital, Avenue Pierre-Decker 4, 1011 Lausanne, Switzerland e-mail: [email protected] D. Hans e-mail: [email protected] W. D. Leslie
Faculty of Medicine, University of Manitoba, Winnipeg, Canada
Since 1994, bone mineral densitometry (BMD), as mea-sured by dual X-ray absorptiometry (DXA), has been the gold standard tool both for osteoporosis detection and the monitor-ing of treatment efficacy [7]. Although bone density is one of the major determinants of bone strength and fracture risk [8], a considerable overlap exists in BMD values between individ-uals who develop fractures and those who do not [9]. Other factors that influence both bone strength and fracture risk include the macro- and micro-architecture of the cortical bone (including cortical porosity), micro-architecture and mineral-ization of the trabecular bone, and bone turnover [10–12].
The trabecular bone score (TBS) is a novel gray-level texture measurement that is able to differentiate between individuals that exhibit the same bone density, but different bone micro-architectural texture [13–16]. One way to achieve this is to determine the variogram of the projected bone image, calculated as the sum of the squared gray-level differences between pixels at a specific distance and angle [13–16]. In brief, TBS is calculated as the slope of the log– log transform of this variogram. This slope characterizes the rate of gray-level amplitude variations in the bone. TBS can be applied retrospectively to an existing DXA exam, with-out the need for any further imaging, and can therefore be compared directly with BMD since both evaluate the same region of the bone. In short, TBS is derived from the texture of the DXA image and has been shown to be related to bone micro-architecture and fracture risk.
The added value of the TBS in bone mineral densitome-try for fracture risk assessment has been documented in cross-sectional and longitudinal studies [17–25]. The objec-tive of the current study was to assess the sensitivity of TBS to detect change over time in a large cohort of treated versus untreated older women.
Methods Study population
In this retrospective cohort study, paired baseline and follow-up DXA images of the lumbar spine, which had been collected from a large clinical cohort of women (≥50 years) in the Canadian province of Manitoba, were sent to the University of Lausanne, Switzerland for the calculation of TBS values. In addition to the actual gray-scale images, further information collected for analysis through the Man-itoba Bone Density Program included the following: (1) demographic data; (2) clinical data, including diagnosed fractures; and (3) BMD results, thereby allowing for the calculation of baseline and follow-up BMD values for each subject. The Manitoba Bone Density Program is a clinical program based upon targeted case finding, as described elsewhere [26–29]. The associated database exceeds 99 %
in terms of completeness and accuracy [29]. Our study protocol was approved by both the Research Ethics Board for the University of Manitoba and the Health Information Privacy Committee of Manitoba Health.
To be eligible for the current study, women had to (1) be at least 50 years of age; (2) have medical coverage from Man-itoba Health over the entire course of the study observation period; (3) have paired baseline and follow-up lumbar spine DXA examinations, including BMD measurements of the lumbar spine and hip, utilizing one of the program's three cross-calibrated single narrow fan-beam scanners (Prodigy, GE Healthcare, Madison, WI, USA); and (4) have not re-ceived any hormone replacement therapy (HRT) or other anti-resorptive drug prior to their baseline BMD assessment. The average duration of follow-up was marginally shorter in women who received treatment versus untreated women (3.6 vs. 3.8 years). We excluded anyone with >90 days of gluco-corticoid use in the year before baseline DXA or in a single year between the baseline and follow-up DXA.
A second database used for the study was Manitoba's provincial pharmacy database system, a province-wide pro-gram that records all retail prescriptions and drug dispensa-tions, thereby allowing us to identify which women had received treatment for osteoporosis as well as the drugs pre-scribed and adherence rates. Using the data drawn from the provincial pharmacy system, eligible women were divided into two subgroups: (1) those who had not received any HRT or anti-resorptive drug therapy over the period of time between their baseline and follow-up DXA examination, des-ignated as the “untreated” group; and (2) those who had initiated a non-estrogen anti-resorptive drug and exhibited a high level of treatment adherence (defined as a medication possession ratio >75 %), designated as the“treated” group. Measurement of BMD
All DXA scans had been performed and analyzed in the province of Manitoba, in accordance with manufacturer recommendations. BMD measurements were recorded for the lumbar spine for L1 through L4 (L1–L4) and for the femoral neck (and total hip). Hip T-scores were calculated using the revised NHANES III Caucasian female reference values [30,31]. All scans were reprocessed centrally using the same software (enCore version 12.0, GE Healthcare). Values that fell below the 0.1 percentile or above the 99.9 percentile were treated as outliers and excluded from further analysis. The resultant data approximated a normal distribu-tion. The three instruments used in the study (all Prodigy, GE Healthcare) were cross-calibrated using anthropomorphic phantoms, and no clinically significant differences were iden-tified (T-score differences <0.2). Therefore, all analyses are based upon unadjusted numerical results generated by the instrument. For 98 % of the subjects, the follow-up scan was
performed on the same instrument as the baseline scan. No magnification effects have been reported for the densitometer used in this study [32, 33]. Instruments used in this study exhibited stable long-term performance (coefficient of varia-tion (CV) <0.5 %) and satisfactory in vivo precision [34]. Measurement of TBS
All TBS measurements were performed within the Bone Disease Unit at the University Hospital of Lausanne, Lau-sanne, Switzerland using TBS iNsight® software version 1.8.2 (Med-Imaps, Bordeaux, France). Each lumbar spine DXA examination selected from the Manitoba database was anonymized to ensure blinding to clinical parameters and outcomes. Then, each lumbar spine raw DXA images were uploaded into the TBS iNsight software. Lumbar spine TBS was then evaluated using the patented algorithm in the same regions of measurement as those used for the lumbar spine BMD (mask of the region of interest and edge detection were copied from the DXA scans), with lumbar spine TBS calcu-lated as the mean value of the individual measurements for vertebrae L1–L4. Short-term reproducibilities (CV) for TBS calculated from the three instruments used in the Manitoba study and thus from several technicians were 2.1 % and 1.7 % for spine TBS and BMD, respectively, in 92 individuals with repeat spine DXA scans performed within 28 days [23]. Statistical analysis
Descriptive analysis included means and percentages with standard deviations. Annual percent change in BMD and TBS was calculated for each subject as the absolute change divided by the baseline value, and years of follow-up. Bivar-iate intergroup comparisons were performed between those treated and not treated with a non-HRT anti-resorptive drug using Student's t tests and Pearson's χ2analysis for contin-uous and non-contincontin-uous variables, respectively. All statis-tical analyses were performed using Statistica (version 8.0, StatSoft, Inc., Tulsa, OK, USA). Given that there were four outcomes of interest (percent annual changes in total hip, femoral neck, and lumbar spine BMD, and lumbar spine TBS), the Bonferroni-adjusted threshold for statistical sig-nificance was set at p<0.01. All inferential tests were two-tailed.
Results
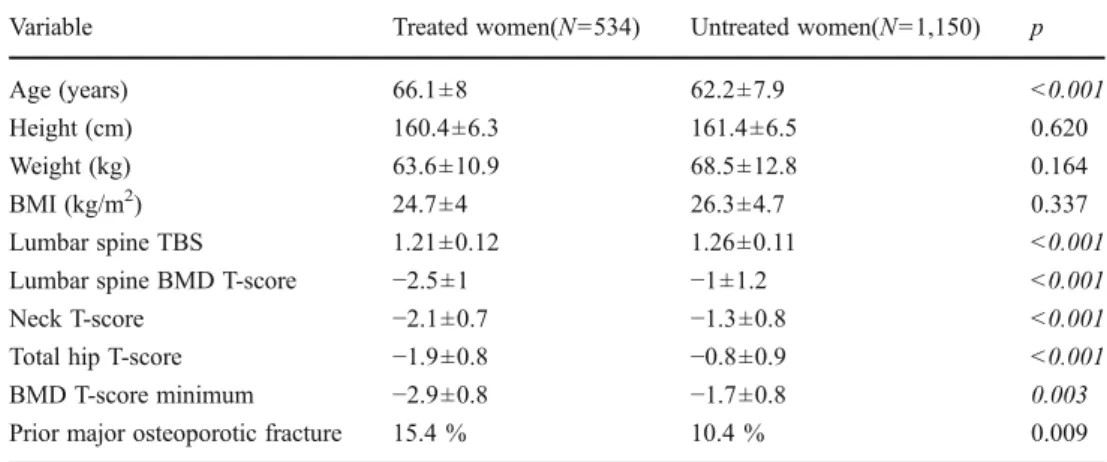
The final sample consisted of 1,684 women: 534 treated and 1,150 untreated. At baseline, treated and untreated women differed significantly in most characteristics that would favor the initiation of osteoporosis treatment (Table 1). Treated women averaged almost 4 years older (66.1±8.0 vs. 62.2±
7.9, respectively; p<0.001). Baseline lumbar spine BMD T-score and TBS were all significantly lower in women who were started on treatment (all p<0.001). Roughly one in six women initiated on treatment had had a prior major osteopo-rotic fracture (hip, clinical spine, forearm, or humerus) versus one in ten untreated women (p00.009). Only weak correla-tions were seen between baseline lumbar spine TBS and lumbar spine BMD (r00.30, p<0.001), femoral neck BMD (r00.23, p<0.001), and total hip BMD (r00.22, p<0.001), which were of similar magnitude in subgroups stratified according to treatment status (all p<0.001). Baseline BMD therefore explained less than 10 % of the variance in lumbar spine TBS. There were even weaker correlations between the change in lumbar spine TBS and change in lumbar spine BMD (r00.18, p<0.001), femoral neck BMD (r00.11, p<0.001), and total hip BMD (r00.08, p<0.001). The corre-lation between the change in lumbar spine TBS and lumbar spine BMD was significant in both untreated (r00.11, p<0.001) and treated subgroups of women (r00.18, p<0.001) but explained less than 5 % of the variance in change.
Of the different anti-resorptive drugs prescribed to the trea-ted women, by far, the most common were bisphosphonates (86 % of which, the majority (73 %) was alendronate); ralox-ifene use (10 %) and calcitonin use (4 %) were much less common. Over the course of follow-up, significant differences in BMD change and TBS change were observed between those treated and untreated (p<0.001); BMD and TBS measurements increased significantly in women on treatment compared to both baseline and the untreated group, but decreased signifi-cantly in untreated women compared to both baseline and the treated group (Table2). Similar mean decreases in lumbar spine BMD and TBS were seen among the untreated women com-pared to the baseline (−0.36 % per year, 95 % confidence interval (CI) −0.52 to −0.20 %; −0.31 % per year, 95 % CI −0.48 to −0.15 %) (Fig.1). Conversely, a much greater increase in lumbar spine BMD was observed among treated women (+1.86 % per year, 95 % CI +1.71 to +2.02 %) than in lumbar spine TBS (+0.20 % per year, 95 % CI +0.04 to +0.37 %).
When considering individuals, for detecting significant decrease (below the least significant change) in untreated subjects, BMD showed a slightly greater sensitivity than TBS (24 vs. 18 %, McNemar test p00.0003). For detecting significant increase (above the least significant change) in treated subjects, as expected, BMD is much more sensitive than TBS (54 vs. 12 %, p<0.0001).
Discussion
Previous studies have documented the value of the TBS in assessing fracture risk in postmenopausal women [14–25]. The value of TBS for assessing risk is both sizeable and inde-pendent of BMD, which makes sense given the increasing
understanding of the importance of bone architecture in deter-mining bone strength [1,9–11,35]. Indeed, TBS has been found (1) to be lower in postmenopausal women with a past osteopo-rotic fracture relative to age- and BMD-matched women with-out fracture [17]; (2) to be associated with an incremental increase in odds ratio for spine fracture when combined with lumbar spine BMD [18–22]; (3) to be lower in women with fractures, irrespective of whether their BMD meets the criteria for osteoporosis or osteopenia [18–22]; (4) to prospectively predict fracture as well as lumbar spine BMD [23–25]; and (5) to capture roughly one third of misclassified fractures according to the BMD WHO definition of osteoporosis alone [23–25].
In the current study, we sought to establish whether TBS is useful for monitoring the effectiveness of anti-osteoporosis therapy. First of all, the BMD response on anti-resorptive drugs at all skeletal sites is in general agreement with pub-lished treatment-related increases [36]. We observed that lum-bar spine TBS, an index of bone micro-architectural texture, does indeed increase significantly over time with treatment and falls significantly without treatment, paralleling changes in BMD. Interestingly, the magnitude of the decrease in lum-bar spine TBS without treatment closely mimicked that of BMD. The same cannot be said of the increases in lumbar
spine TBS and BMD on treatment, with the latter being almost ten times greater. If one can prove that an increase of TBS under treatment is associated with a fracture reduction (or the reverse when TBS decrease), then it would make perfect sense to use both BMD and TBS to monitor treatment or at least to select the most appropriate drugs for a given patient. Unfor-tunately, our current study has not been designed to support such assumption which then remains speculative.
If trabeculae were“reinforced” in terms of increased min-eralization of the existing structure with perhaps subsequent thickening, one would wonder, how would this be reflected by TBS? In the context of TBS, because of the intrinsic value of the experimental variogram, the trabecular thickening would have only a limited influence on TBS parameters except when the trabecular thickness would have been, prior to treatment, thin enough to be negligible in the 2D projection. In this later case, the thickening process would make the structure more visible and would have a small impact [14]. This correlation with trabecular thickness could be increased if other 3D parameters would be taken into account into a model (e.g., at BV/TV and trabecular number constant). However, the effect of anti-resorptive drugs on the bone quantity being documented and the interpretation of stand-alone 3D param-eters cannot be clearly stated other than a global positive maintenance of the bone texture.
Table 2 Mean annualized change in BMD and TBS for treated versus untreated women Variable Treated women Untreated women p
Mean follow-up (years) +3.6±1.1 +3.8±1.2 <0.001
Lumbar spine BMD (% per year) +1.9±1.8 % −0.4±1.6 % <0.001 Femoral neck BMD (% per year) +1.0±1.6 % −0.5±1.4 % <0.001 Total hip BMD (% per year) +1.1±1.3 % −0.6±1.2 % <0.001 Lumbar spine TBS (% per year) +0.2±1.9 % −0.3±2.0 % <0.001
Data are means ± SD
Statistical significance was set at p<0.01
Fig. 1 Annualized percent change in lumbar spine BMD and TBS in treated and untreated women. Errors bars are 95 % confidence intervals Table 1 Baseline demographic
and clinical characteristics
Statistical significance was set at p<0.01
Variable Treated women(N0534) Untreated women(N01,150) p
Age (years) 66.1±8 62.2±7.9 <0.001
Height (cm) 160.4±6.3 161.4±6.5 0.620
Weight (kg) 63.6±10.9 68.5±12.8 0.164
BMI (kg/m2) 24.7±4 26.3±4.7 0.337
Lumbar spine TBS 1.21±0.12 1.26±0.11 <0.001
Lumbar spine BMD T-score −2.5±1 −1±1.2 <0.001
Neck T-score −2.1±0.7 −1.3±0.8 <0.001
Total hip T-score −1.9±0.8 −0.8±0.9 <0.001
BMD T-score minimum −2.9±0.8 −1.7±0.8 0.003
Combining BMD and TBS could potentially provide a better understanding of the overall effects of treatment at a structural level. Ultimately, whether combining BMD and TBS in clinical practice is warranted will require longitudi-nal studies assessing not only how these two independent markers of bone structure change over time, but also how these changes correlate with fracture risk.
Our study is a first step towards establishing a possible role for TBS in the monitoring of osteoporosis therapy. However, to apply such parameters in the individual patient, one needs to determine the least significant change (LSC) and monitoring time interval (MTI) [37]. Our precision for spine TBS (2.1 %) [23] is slightly worse than that for spine BMD (1.7 %), while the average annual increase of TBS for anti-resorptive therapy is much lower than that of BMD. Therefore, the LSC and MTI for spine TBS would be 4.8 % and close to 10–15 years (corresponding values for spine BMD 4.2 % and 2.5 years). The small increase in TBS from anti-resorptive treatment limits the utility of TBS for individual patient monitoring as only 12 % of treated sub-jects had an increase in TBS that exceeded the LSC. This is consistent with other observations that anti-resorptive thera-py is expected to provide a“positive maintenance” of bone micro-architecture rather than a major improvement in micro-architecture [38]. Technically, since the TBS has been shown to reflect treatment changes with osteoporosis-targeted therapies [39–42] and to deteriorate significantly over periods of time as short as 2 years in untreated patients, it can be used to monitor the effectiveness of treatment once the diagnosis of osteoporosis has been made. However, most importantly, one still has to investigate how these changes correlate with fracture risk. Potentially, one can also imagine using TBS in conjunction with BMD and clinical risk factors to select the most appropriate drugs as not all of them have the same effect on bone texture [39–42], but most of them show a similar BMD increase and fracture risk reduction. However, this later statement is speculative and would re-quire specific validation.
Our study has the advantages of a large cohort of older women, a clinically relevant mean follow-up interval (aver-age of 3.7 years), and a provincial pharmacy database to assess drug initiation and adherence. One of the limitations of our database is related to our inability to assess non-pharmacological interventions (e.g., diet, vitamin D status, exercise). Another limitation is that the follow-up interval is not constant across all subjects, as in a clinical trial, so that annualized percent change is difficult to compare against previous clinical trials. However, the average change we observed in lumbar spine BMD on treatment was +1.9 % per year which, over the mean of 3.6 years of follow-up, equates to a +6.8 % overall increase, which is similar to the changes reported previously for clinical trials on major bisphosphonates [36].
Conclusions
Based upon the results of a large study involving over 1,600 older women, lumbar spine TBS seems to be weakly re-sponsive to anti-resorptive treatment and might be suitable for monitoring bone texture in women untreated for osteo-porosis. Although the treatment-related increase appears to be considerably less than that observed for BMD, further research delineating the value of TBS as an index of treatment-related anti-fracture effect clearly is warranted.
Acknowledgments The authors are indebted to Manitoba Health for
providing data that are essential to this study (HIPC file no. 2008/2009-033). We note, however, that the results and conclusions are those of the authors, and no official endorsement by Manitoba Health is intended or should be inferred. This work has been reviewed and approved by the Manitoba Bone Density Program Committee.
Conflicts of interest Didier Hans is co-owner of the TBS patent and
has corresponding ownership shares. All the other authors state that they have no conflicts of interest.
References
1. Czerwinski E, Badurski JE, Marcinowska-Suchowierska E, Osieleniac J (2007) Current understanding of osteoporosis accord-ing to the position of the World Health Organization (WHO) and International Osteoporosis Foundation. Ortop Traumatol Rehabil
9:337–356
2. Browner WS, Pressman AR, Nevitt MC et al (1996) Mortality following fractures in older women. The study of osteoporotic
fractures. Arch Intern Med 156:1521–1525
3. Hannan EL, Magaziner J, Wang JJ et al (2001) Mortality and locomotion 6 months after hospitalization for hip fracture: risk factors and risk-adjusted hospital outcomes. JAMA 285:
2736–2742
4. Johnell O, Kanis JA (2006) An estimate of the worldwide preva-lence and disability associated with osteoporotic fractures. Osteo-poros Int 17:1726–1733
5. Looker AC, Orwoll ES, Johnston CC Jr et al (2009) Prevalence of low femoral bone density in older U.S. adults from NHANES III. J Bone Miner Res 12:1761–1768
6. Johnell O, Kanis JA (2006) An estimate of the worldwide preva-lence and disability associated with osteoporotic fractures.
Osteo-poros Int 17(12):1726–1733
7. World Health Organization (1994) Assessment of fracture risk and its application to screening for postmenopausal osteoporosis. Re-port of a WHO study group. World Health Organ Tech Rep Ser
843:1–129
8. Johnell O, Kanis JA, Oden E et al (2005) Predictive value of BMD
for hip and other fractures. J Bone Miner Res 20(7):1185–1194
9. Hordon LD, Raisi M, Paxton S, Beneton MM, Kanis JA, Aaron JE (2000) Trabecular architecture in women and men of similar bone mass with and without vertebral fracture. Part I. 2-D histology.
Bone 27(2):271–276
10. Link TM, Majumdar S (2004) Current diagnostic techniques in the evaluation of bone architecture. Curr Osteoporos Rep 2(2):47–52 11. Rubin CD (2005) Emerging concepts in osteoporosis and bone
12. Dalle Carbonare L, Giannini S (2004) Bone microarchitecture as an important determinant of bone strength. J Endocrinol Invest 27
(1):99–105
13. Pothuaud L, Carceller P, Hans D (2008) Correlations between grey-level variations in 2D projection images (TBS) and 3D micro-architecture: applications in the study of human trabecular bone microarchitecture. Bone 42:775–787
14. Hans D, Barthe N, Boutroy S, Pothuaud L, Winzenrieth R, Krieg M-A (2011) Correlations between TBS, measured using anteroposterior dual-energy X-ray absorptiometry acquisition, and 3-dimensional parameters of bone microarchitecture: an experimental study on
human cadaver vertebrae. J Clin Densitom 14(3):302–312
15. Piveteau T, Winzenrieth R, Hans D (2011) Trabecular Bone Score (TBS) the new parameter of 2D texture analysis for the evaluation of 3D bone micro architecture status. J Clin Densitom 14(2):169 16. Winzenrieth R, Piveteau T, Hans D (2011) Assessment of
correla-tions between 3D μCT microarchitecture parameters and TBS:
effects of resolution and correlation with TBS DXA measure-ments. J Clin Densitom 14(2):169
17. Pothuaud L, Barthe N, Krieg M-A, Mehsen N, Carceller P, Hans D (2009) Evaluation of the potential use of trabecular bone score to complement bone mineral density in the diagnosis of osteoporosis: a preliminary spine BMD-matched, case–control study. J Clin Densitom 12(2):170–176
18. Rabier B, Héraud A, Grand-Lenoir C, Winzenrieth R, Hans D (2010) A multicentre, retrospective case–control study assessing the role of trabecular bone score (TBS) in menopausal Caucasian women with low areal bone mineral density (BMDa): analysing
the odds of vertebral fracture. Bone 46(1):176–181
19. Winzenrieth R, Dufour R, Pothuaud L, Hans D (2010) A
retrospec-tive case–control study assessing the role of trabecular bone score in
postmenopausal Caucasian women with osteopenia: analyzing the
odds of vertebral fracture. Calcif Tissue Int 86(2):104–109
20. Winzenrieth R, Cormier C, Del Rio L, Di Gregorio S (2012) Is bone micro-architecture status at spine assessed by TBS related to
femoral neck fracture? A Spanish case–control study. Osteoporosis
International (in press)
21. Colson F, Winzenrieth R (2011) Assessment of osteopenic women microarchitecture with and without osteoporotic fracture by TBS on a new generation bone densitometer. In: ISCD annual meeting. April 6-9. Miami, Florida, USA
22. Bréban S, Kolta S, Briot K, Ghazi M, Fechtenbaum J, Dougados M, Roux C (2010) Combination of bone mineral density and trabecular bone score for vertebral fracture prediction in secondary osteoporosis. In: Annual meeting of the American Society of Bone and Mineral Research., Toronto, Canada; Oct. 15-19. SA0297 23. Hans D, Goertzen A, Krieg M-A, Leslie WD (2011) Bone
micro-architecture assessed by TBS predicts osteoporotic fractures inde-pendent of bone density: the Manitoba study. J Bone Miner Res 16
(11):2762–2769
24. Boutroy S, Hans D, Sornay-Rendu E, Vilayphiou N, Winzenrieth R, Chapurlat R (2010) Trabecular bone score helps classifying women at risk of fracture: a prospective analysis within the OFELY study. J Bone Miner Res 25(S1):89
25. Popp AW, Meer S, Hans D, Krieg M-A, Perrelet R, Lippuner K (2012) Bone mineral density (BMD) combined with microarchi-tecture parameters (TBS) significantly improves the identification of women at high risk of fracture: the SEMOF cohort study. In: IOF-ECCEO12 European congress on osteoporosis and osteoar-thritis. March 21 to 24. Bordeaux, France. P598
26. Leslie WD, Pahlavan PS, Tsang JF, Lix LM (2009) Prediction of hip and other osteoporotic fractures from hip geometry in a large
clinical cohort. Osteoporos Int 10:1767–1774
27. Leslie WD, Metge C (2003) Establishing a regional bone density program: lessons from the Manitoba experience. J Clin Densitom 6:275–282
28. Leslie WD, Caetano PA, MacWilliam LR et al (2005) Construction and validation of a population-based bone densitometry database. J Clin Densitom 8:25–30
29. Roos NP, Shapiro E (1999) Revisiting the Manitoba Centre for Health Policy and Evaluation and its population-based health
information system. Med Care 37:JS10–JS14
30. Kanis JA, McCloskey E, Johansson H et al (2008) A reference
standard for the description of osteoporosis. Bone 42:467–475
31. Binkley N, Kiebzak GM, Lewiecki EM et al (2005) Recalculation of the NHANES database SD improves T-score agreement and
reduces osteoporosis prevalence. J Bone Miner Res 20:195–201
32. Faulkner KG, Wacker WK, Barden HS et al (2006) Femur strength index predicts hip fracture independent of bone density and hip
axis length. Osteoporos Int 17:593–599
33. Boudousq V, Goulart DM, Dinten JM et al (2005) Image resolution and magnification using a cone beam densitometer: optimizing data acquisition for hip morphometric analysis. Osteoporos Int 16:813–822
34. Leslie WD (2006) The importance of spectrum bias on bone density monitoring in clinical practice. Bone 39:361–368
35. Seeman E, Delmas PD (2006) Bone quality—the material and
structural basis of bone strength and fragility. N Engl J Med 354
(21):2250–2261
36. Russell RG, Xia Z, Dunford JE, Oppermann U, Kwaasi A, Hulley PA, Kavanagh KL, Triffitt JT, Lundy MW, Phipps RJ, Barnett BL, Coxon FP, Rogers MJ, Watts NB, Ebetino FH (2007) Bisphosph-onates: an update on mechanisms of action and how these relate to
clinical efficacy. Ann N Y Acad Sci 1117:209–257, Review
37. Glüer CC, Blake G, Lu Y, Blunt BA, Jergas M, Genant HK (1995) Accurate assessment of precision errors: how to measure the re-producibility of bone densitometry techniques. Osteoporos Int 5
(4):262–270
38. Rizzoli R, Chapurlat RD, Laroche JM, Krieg MA, Thomas T, Frieling I, Boutroy S, Laib A, Bock O, Felsenberg D (2012) Effects of strontium ranelate and alendronate on bone microstruc-ture in women with osteoporosis. Results of a 2-year study. Osteo-poros Int 23(1):305–315
39. Popp AW, Buffat H, Lamy O et al (2012) Beneficial effect of zoledronate compared to placebo on spine BMD and micro-architecture (TBS) parameters in postmenopausal women with
osteoporosis. A 3-year study. Osteoporosis Int 23(Suppl 2):S85–
S386, P599
40. Günther B, Popp AW, Stoll D et al (2012) Beneficial effect of PTH on spine BMD and microarchitecture (TBS) parameters in post-menopausal women with osteoporosis. A 2-year study.
Osteopo-rosis Int 23(Suppl 2):S85–S386, P609
41. Hadji P, Kalder M, Kauka A et al (2012) Effects of exemes-tane and tamoxifen treatments on bone quantity and quality in
patient with breast cancer. Osteoporosis Int 23(Suppl 2):S85–
S386, P518
42. Hans D, Krieg MA, Lamy O, Felsenberg D (2012) Beneficial effects of strontium ranelate compared to alendronate on trabecular bone score in post menopausal osteoporotic women. A 2-year study. Osteoporosis Int 23(Suppl 2):S85–S386, P471