HAL Id: hal-02892687
https://hal.archives-ouvertes.fr/hal-02892687
Submitted on 9 Jul 2020
HAL is a multi-disciplinary open access
archive for the deposit and dissemination of
sci-entific research documents, whether they are
pub-lished or not. The documents may come from
teaching and research institutions in France or
abroad, or from public or private research centers.
L’archive ouverte pluridisciplinaire HAL, est
destinée au dépôt et à la diffusion de documents
scientifiques de niveau recherche, publiés ou non,
émanant des établissements d’enseignement et de
recherche français ou étrangers, des laboratoires
publics ou privés.
From arc-melted ingot to MTR fuel plate A SEM/EBSD
microstructural study of U3Si2
J. Havette, X. Iltis, H. Palancher, D. Drouan, Olivier Fiquet, Étienne
Castelier, Mathieu Pasturel
To cite this version:
J. Havette, X. Iltis, H. Palancher, D. Drouan, Olivier Fiquet, et al.. From arc-melted ingot to MTR
fuel plate A SEM/EBSD microstructural study of U3Si2. Journal of Nuclear Materials, Elsevier, 2020,
537, pp.152224. �10.1016/j.jnucmat.2020.152224�. �hal-02892687�
C
REDIT AUTHORSHIP CONTRIBUTION STATEMENT
Julien Havette: review, editing, sample synthesis, sample polishing. Xavière Iltis: writing-review, editing, supervision, EBSD acquisition and results treatment. Hervé Palancher: writing-writing-review, editing, supervision, Doris Drouan: sample polishing, EBSD acquisition. Olivier Fiquet: writing-review, editing. Etienne Castelier: writing-writing-review, finite element calculations. Mathieu Pasturel: writing-review, editing, supervision.
Graphical abstract:
Influence of cooling rate on the microstructure of U
3Si
2arc melted ingots: vertical sections
analysed by EBSD (maps coloured in IPF-Z)
From arc-melted ingot to MTR fuel plate: a SEM/EBSD
microstructural study of U
3Si
2Julien Havette
1,2, Xavière Iltis
1*, Hervé Palancher
1, Doris Drouan
1, Olivier Fiquet
1, Etienne
Castelier
1, Mathieu Pasturel
21
CEA, DES, IRESNE, DEC, Cadarache F-13108 Saint-Paul-Lez-Durance, France
2Univ Rennes, CNRS, Institut des Sciences Chimiques de Rennes – UMR6226, F-35042
Rennes, France
ABSTRACT
U3Si2/Al fuel plates are widely used in Material Testing Reactors (MTRs) as Low Enriched Uranium
driver fuel. In this paper, a reinvestigation of the microstructure of U3Si2 particles is proposed to take
full advantage of the new capabilities offered by Electron BackScattered Diffraction (EBSD) techniques.
Using EBSD we demonstrate that most particles are single crystalline in as-fabricated plates. To understand this characteristic, linked to the microstructure of the starting material, an in-depth study of U3Si2 ingots produced by arc-melting was performed at a laboratory scale; they were extensively
characterized by EBSD, scanning electron microscope, energy dispersive spectroscopy and X-ray diffraction. It is shown that U3Si2 grain may be large (up to several thousands of micrometers) and that
they exhibit a strong preferential orientation, linked to the axial thermal gradient created in the arc-melting chamber. A significant impact of the cooling rate after arc-arc-melting on the ingot microstructure is noticed: grains are smaller and more columnar when the cooling rate is high. A deviation from 3U/2Si stoichiometry caused for example by impurities induces the formation of a secondary phase, which exhibits a square spiral morphology.
We then demonstrate that the cooling rate of U3Si2 ingots has a direct influence on the
characteristics of the powders obtained by crushing these ingots. Indeed the powder obtained from “slow” cooled ingots is found very close to the powder used for industrial MTR plates. On the contrary particles obtained from “fast” cooled ingots, are polycrystalline and more resistant to crushing.
Thus, this work provides significant advances both in the characterisation of technological products like U3Si2/Al MTR plates and in more basic knowledge about the U3Si2 phase formation.
Keywords: U3Si2; arc-melting; MTR fuel; EBSD
2
1. INTRODUCTION
Material Testing Reactors (MTRs) are used primarily to study materials under irradiation and to produce radioisotopes for medical and industrial applications. The fuel elements of MTRs are mostly plates in which the fissile material in powder form is dispersed within an aluminium matrix, to form a fuel core cladded between two aluminium alloy sheets.
In the 1980’s, due to nuclear proliferation issues related to High Enriched Uranium (HEU, >20%
235
U), it has been decided to convert MTRs to Low Enriched Uranium (LEU, <20% 235U). Within HEU fuels, the low uranium density UAlx (i.e. a mixture of different uranium aluminides) for example was
often used as fissile material. To keep the same reactor performances using LEU fuels, new materials with higher uranium density were developed, the most promising being currently γU-Mo alloys and U3Si2 [1]. U3Si2 is qualified up to 4.8 gU.cm
-3
for medium powers (below about 300 W.cm-²). However, for its use in high performance research reactors, a higher uranium loading (typically 5.3 gU.cm-3 or even higher) may be needed [2–4]. A deeper knowledge on the microstructure of this compound, from the arc-melted ingots to the fuel plates (made from powders obtained by crushing such ingots), could therefore contribute to the development/qualification of this “high loaded” fuel. Furthermore, U3Si2 has
a twofold interest as it is also considered as an alternative fuel for Light Water Reactors (LWRs) within the Accident Tolerant Fuel (ATF) international initiative, due to its high thermal conductivity at high temperature and its high U density with respect to standard UO2 [5].
This silicide is mainly synthesized by arc-melting, on laboratory [6], but also industrial scales [7]. It can also be synthesized by induction melting [8,9] or centrifugal atomization [10–12]. The arc-melted U3Si2 microstructure received relatively little attention. Large elongated grains were revealed by
Obbard et al., after metallographic etching [13]. Scanning electron microscopy (SEM) observations evidenced a U-rich phase at grain boundaries [6,14], or other minor phases such as USi, depending on slight deviations from the 60/40% atomic ratio in the starting materials mixture and/or local heterogeneities in the U+Si mixture. As U3Si2 is a strictly stoichiometric compound, it is almost
impossible to synthesize a perfectly single-phased product by direct melting-solidification methods. As part of the ATF initiative, U3Si2 pellets were obtained by powder metallurgy, i.e. by pressing and
sintering an U3Si2 powder (obtained by arc-melting of U + Si, followed by a mechanical crushing) [15–
17]. Grain size was studied as a function of sintering conditions by analysis of optical microscopy images [18] but these results cannot be compared to those obtained on an arc-melted material.
The interest of characterizing the microstructure of fissile particles in as-manufactured MTR fuels has been previously demonstrated on UAlX/Al [19] and U-Mo/Al fuels [10,20,21] These studies
investigated the influence of each step of the production process on the fissile particle composition and microstructure and revealed the presence of minority phases in the final product. These works provided data which are needed to understand the in-pile behavior of these fuels and which should exist before initiating any optimization project. In U3Si2/Al MTR fuels, the microstructure of fissile
particles was investigated 20 to 30 years ago [22-24]. Beyond the valuable information these studies provided, the recent development of new analytical techniques like Electron Backscattered Diffraction (EBSD) justifies a reinvestigation, as for example shown on U-Mo particles [20,21].
The present study aims at characterizing the U3Si2 microstructure after the three main steps of the
MTR fuel plate fabrication [22,25]: (i) after arc-melting (special attention will be paid on melting and cooling conditions, impurities and homogeneity of the ingot), (ii) after crushing [22,23], and (iii) after plate fabrication [24-26].
To achieve this goal, chemical etching coupled to optical/scanning electron microscopies (OM/SEM), and EBSD, has been used to determine the size and shape of the grains. EBSD method was particularly efficient on U-Mo alloys [20] and has never been reported on U3Si2, to the best of the
authors knowledge.
2. EXPERIMENTAL METHODS
2.1 S
AMPLES DESCRIPTION2.1.1 Ingots obtained by arc-melting
(Table 1), and silicon chunks with size ranging from 1 to 4 mm (Neyco, 99.999% purity). The uranium chips were cleaned in a dilute nitric acid solution in order to remove any outer oxide layer. The analyses available for these two batches do not include the C and O contents, although both elements are known to have a significant influence on the U-Si system [27–29]. Based on the analysis reports of other uranium batches and on the US NRC recommendation [22] usually followed by fuel manufacturers, the C and O contents can be reasonably estimated to be of the order of a few hundred ppm and between 1000 and 2000 ppm respectively, in the low purity batch. In the case of the high purity batch, these amounts could be reduced to a few hundred ppm for both elements (also based on other analysis reports).
Three types of ingots (I1, I2 and I4, Table 2) were prepared by weighing uranium and silicon in stoichiometric ratio to obtain the U3Si2 composition. To compensate for silicon vaporization upon
arc-melting, some authors use a small excess of silicon (about 1 at.%) [6,30]. To slightly exacerbate the impact of a silicon excess on the arc-melted microstructure and study it more easily, a higher Si excess (2 at.%) was chosen for the I3 ingot (Table 2).
The materials were placed on a water-cooled copper hearth inside the arc-melting furnace chamber (Edmund Buhler MAM-1). It works with an electrical current ranging from 3 up to 180 A and an open circuit voltage of 80 V were used.The melting was performed under a relative Ar pressure of -0.2 bar at room temperature, with a cooling water at 12°C and with an arc intensity of 4 (on a whole scale of 10).
In order to minimize silicon vaporization, uranium chips were laid over silicon chunks, as uranium melts at lower temperature as recommended in [14]. After cleaning the furnace chamber by five vacuum/argon filling cycles, a Ti-Zr getter was melted first to trap any residual oxygen. Then U3Si2
ingots were melted, flipped and remelted three times to ensure homogeneity.
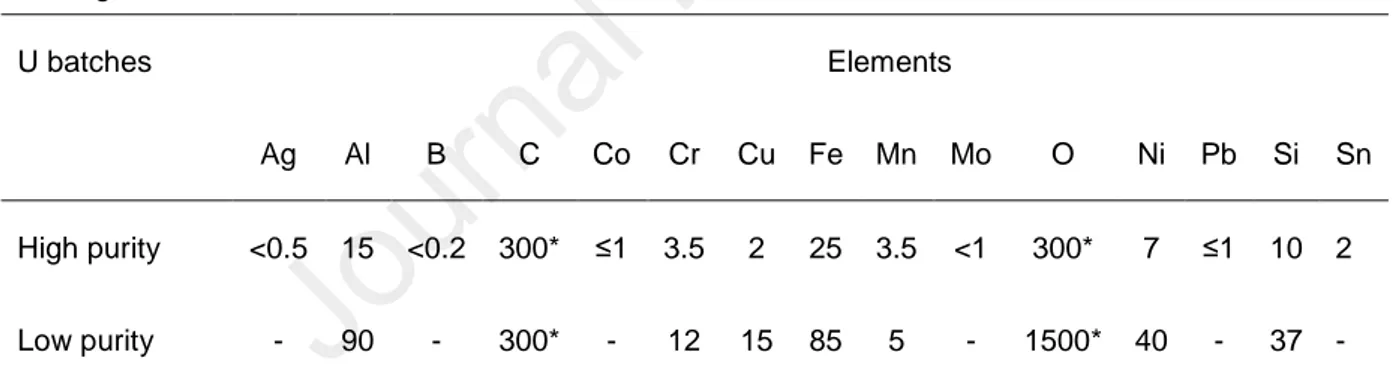
Table 1. Main impurities (in mg.kg-1) in the two uranium batches used for the synthesis of U3Si2 by
arc-melting.
U batches Elements
Ag Al B C Co Cr Cu Fe Mn Mo O Ni Pb Si Sn
High purity <0.5 15 <0.2 300* ≤1 3.5 2 25 3.5 <1 300* 7 ≤1 10 2
Low purity - 90 - 300* - 12 15 85 5 - 1500* 40 - 37 - *estimation based on other uranium batches
The four types of ingot were synthesized with different cooling conditions. The arc-melting device use in this study does not precisely monitor the temperature and the cooling rate of the ingot after melting. For “very fast” cooling (I1 ingot, Table 2), a charge of 0.5 g was used and the arc was stopped instantly by switching the device off. For “slow” cooling (I2), the charge of raw materials was set to 1 g and the intensity was lowered manually down to a value of 0, within a 10 seconds period of time. For “fast” cooling (I3 and I4), a charge of 1 g was also used and the arc intensity was stopped instantly by switching the device off.
In each case, a very small mass loss was observed (<0.3 wt.%). The size of the ingots was typically 4 mm diameter for I1 and 6 mm for I2, I3 and I4. They present an almost flat surface on the bottom side in contact with the copper hearth. For each type of ingot, two samples were synthesized with the same conditions in order to be able to observe full vertical and horizontal sections.
4 Table 2. Main fabrication parameters of U3Si2 ingots produced by arc-melting.
Label Uranium batch Cooling U/Si atomic
ratio Weight (g) I1 High purity “Very fast” 60/40 0.5 I2 High purity “Slow” 60/40 1 I3 High purity “Fast” 58/42 1 I4 Low purity “Fast” 60/40 1
2.1.2 Powders obtained by milling Two powder batches were analysed.
The first one was obtained by crushing a piece of an I1 and I2 ingots for 90 seconds at 10 Hz with a mixer mill (Retsch MM200) inside a tungsten carbide vial (25 mL), with a 25 g WC grinding ball, in order to approximately reach the particle size distribution of the second U3Si2 batch studied in the
present paper.
The second batch was provided by Framatome CERCA. It was produced using depleted uranium. In the latter process, much larger ingots (several hundreds grams) are obtained by arc-melting. They are flipped and remelted several times before being crushed with jaw crusher, hammer mill or ball mill [22]. Powders are then sieved to obtain two granulometric classes: the first one inferior to 40 µm, the second one between 40 and 125 µm. These two classes are then mixed in a desired ratio (exact values are proprietary data).
2.1.3 Fuel plate
A fuel plate for MTRs prepared with depleted uranium and representative of those irradiated in the frame of the SHARE irradiation experiment [31] was supplied by Framatome CERCA. Such a plate is about 1.3 mm thick, 5-7 cm large and up to 1 m long. It is obtained by mixing U3Si2 powder with Al
powder to obtain an U loading in the fuel core of about 4.8 gU.cm-3. This mixture is pressed to obtain a briquette, which is inserted in a frame and cladded between two aluminium alloy sheets. This assembly is then hot and cold rolled and cut to the required dimensions [31].
2.2 C
HARACTERIZATION TECHNIQUES2.2.1 Sample preparation
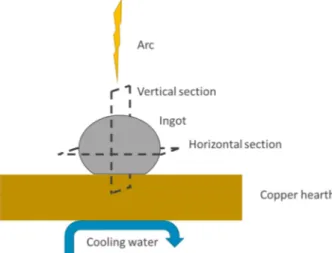
Figure 1 gives a schematic representation of the arc-melting chamber. During ingot cooling and solidification i.e. just after arc-melting, the thermal field is strongly anisotropic (see 4.4 for further description). Therefore, detailed microstructural characterization of the ingot implied observations along two sections, i.e. parallel and normal to the water cooled copper hearth. In the following they are referred to as horizontal and vertical, respectively, as drawn in Figure 1.
Fig. 1. Schematic representation of the U3Si2 ingot in the arc-melting chamber. Horizontal and vertical
cutting planes are indicated.
Both U3Si2 powders obtained by milling or from Framatome CERCA, were dispersed in Al powder
and pressed with a manual press, to obtain a cylindrical compact suitable for polishing. Concerning the fuel plate, one cross section was also embedded in an Al compact prior to polishing.
These different samples were mechanically polished by successive steps with SiC abrasive papers of grades up to 4000, followed by a mirror finish with a diamond suspension.
A dilute nitric acid solution was used on arc-melted samples, to reveal grains by chemical etching, before examinations by optical microscopy. This surface state is not suitable for obtaining exploitable electron backscatter patterns (EBSPs). Instead of a chemical etching, an additional smooth polishing step with a diluted colloidal silica suspension, similar to that applied on U-Mo [20], was then used. Freshly polished samples were then put in the SEM chamber, to limit their exposure to air before examination by SEM and analysis by EDS and EBSD.
2.2.2 Optical microscopy, SEM and EDS
The as-etched ingots were observed with an Olympus DSX500 opto-numerical microscope, in polarized light. Several images were acquired and stitched to obtain a complete view of an ingot section.
The scanning electron microscopy (SEM) examinations were performed using a Nova Nano SEM 450 from FEI. For energy dispersive spectroscopy (EDS), it is equipped with an Oxford Instruments EDS silicon drift detector with an active surface of 80 mm2. Working distance was set to 8 mm and high voltage was 15 kV. Linescans were acquired with a step size of 0.1 µm. As virtual standards were used for EDS quantifications, absorption corrections factors were not optimized for a mixture of a heavy (U) and a light (Si) elements and led to a slight overestimation of the uranium quantity.
2.2.3 Electron BackScatter Diffraction
Electron backscatter diffraction (EBSD) was performed with the above described microscope. It is equipped with a Nordlys II Nano EBSD camera (maximum resolution: 1344×1024 pixels) from Oxford Instruments. AZTEC and Channel 5 softwares were used for data collection and analysis respectively. Acquisitions were performed with a 70° tilt, a 15 mm working distance, a high voltage of 20 kV and a beam current of about 10 nA.
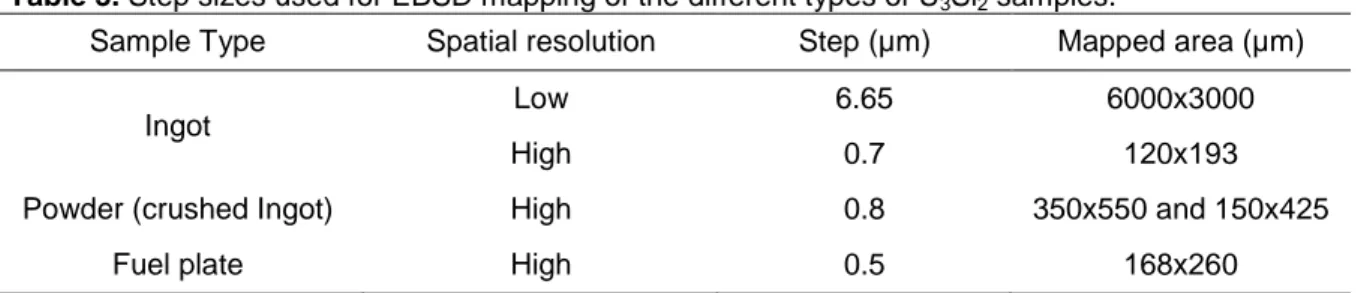
The EBSD mapping of the whole ingot section was performed by acquiring several maps (from 4 to 6, depending on the ingot size) and stitching them together. Distortions were corrected with the Autostitch software. The acquisition step size for each mapping performed in this work were optimized for each sample type and its specific microstructure. These steps are given in Table 3. Crystallographic structures of U-silicides used for the indexation of EBSPs are reported in Table 4.
6 Table 3. Step sizes used for EBSD mapping of the different types of U3Si2 samples.
Sample Type Spatial resolution Step (µm) Mapped area (µm)
Ingot Low 6.65 6000x3000
High 0.7 120x193
Powder (crushed Ingot) High 0.8 350x550 and 150x425
Fuel plate High 0.5 168x260
Table 4. Crystallographic structures used for the indexation of EBSD and XRD patterns.
Phase Space group a (Å) b (Å) c (Å) Reference
U3Si2 P4/mbm 7.33 - 3.90 [32]
U34Si34.5 I4/mmm 10.58 - 24.31 [33]
U8Si8O Pnma 7.67 3.90 5.67 [32]
αU Cmcm 2.85 5.86 4.95 [34]
Grain size and shape were analysed, based on EBSD maps. The aspect ratio (AR) was used to quantify the U3Si2 grains shape. It is defined by the ratio between the maximum diameter and the
minimum diameter of an ellipse fitted around the grain. This ratio is equal to one, for a perfectly equiaxed grain and is greater for an elongated one.
The d50 parameter, which is the value of the particle diameter (in Equivalent Circular Diameter
(ECD)) at 50% in the cumulative distribution, was used to compare the different granulometric distributions. In the same way, the AR50 was used to compare aspect ratios.
2.2.4 X-ray diffraction
X-ray diffraction (XRD) measurements were performed with a Bragg-Brentano θ-θ Bruker D8 Advance X-ray diffractometer using Cu Kα1 and Kα2 radiations (1.5406 and 1.5444 Å respectively) from
a conventional tube source. The same crystallographic structures as those mentioned in Table 4 were used for indexation. Analyses were performed on crushed ingots. Due to the pyrophoricity of the U3Si2
compound, the ingots were crushed inside a glovebox under inert gas atmosphere.
2.3 T
HERMAL MODELLINGAs the local cooling conditions control the grain nucleation and growth from the molten U+Si mixture, the cooling of a 1 g ingot has been modelled using finite elements method, to help understanding the grain morphology in the solidified ingots. The following assumptions were taken into account: at the beginning, the ingot, lying on the copper hearth is entirely at the U3Si2 fusion
temperature (1665°C). We assume that the top of the copper hearth is at the same temperature as cooling water (12°C). The ingot is cooled both by the contact of the copper hearth and by heat exchange with the Argon gas filling the arc-furnace chamber. The Ar temperature is set at room temperature (20°C). The heat exchange coefficient with this atmosphere is calculated assuming natural convection [35].
3. RESULTS
3.1 I
NGOTS PRODUCED FROM HIGH PURITY URANIUM3.1.1 X-Ray diffraction
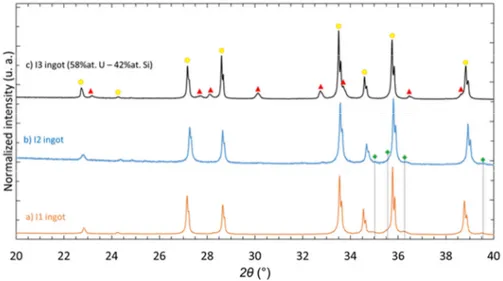
Starting from a 60U-40Si stoichiometric mixture (I1 and I2 ingots), U3Si2 is the main phase present
in the as-cast ingots. A secondary phase, αU, can also be indexed confirming the presence of an U-rich minor phase, as noted by Harp et al.[6] (Fig. 2a,b).
For the as-cast ingot with a small Si over-stoichiometry (I3), U3Si2 was also indexed as the major
to index minor diffraction peaks (Fig. 2c). This secondary phase is often reported in literature; it seems clear that this phase is stabilized by impurities, even if it is sometimes labelled USi [36,37]. As the presence of oxygen in this minor secondary phase was not definitely assessed neither in the present work nor in other publications [36,37], and knowing that this phase was also observed in the U-Si-N ternary system [38] this phase will be referred to as U8Si8X in the following of the present study, with X
corresponding to light impurities (mainly O and/or other light elements).
Note that according to the U-Si binary phase diagram [39] i.e. without impurities, the formation of another secondary phase would have been expected: the U34Si34.5 binary phase (I4/mmm, Table 14) .
Fig. 2. X-ray diffraction patterns acquired on crushed “U3Si2” ingots of (a) I1 (orange), (b) I2 (blue) and
(c) I3 (black), indexed with U3Si2, U8Si8X and αU diffraction peaks.
3.1.2 Preliminary observations by optical microscopy
Figure 3 shows a typical horizontal cross section of an etched 1 g U3Si2 ingot (I2) observed by
optical microscopy. Variations in grey levels evidence large grains (several hundreds of microns), with irregular and angular shapes. Cracks are also visible that could be at least partly due to polishing and etching steps. No differences in terms of size and shape are noticed between the grains located close to the surface and those located in the core of the ingot.
However, the contrast between grains is not sufficiently marked to analyse precisely their size and shape. When extending the duration of the acid etching, this contrast becomes stronger but, at the same time, the surface of the sample is increasingly damaged (enlargement of cracks and pores…). Because of these issues, SEM and EBSD were used to characterize the grains more accurately.
8 Fig. 3. Horizontal section of an U3Si2 arc-melted ingot (I2), observed by optical microscopy with
polarized light, after etching with a dilute nitric acid solution (with pores and cracks in black, enlarged by chemical etching).
3.1.3 SEM + EDS
It was possible to observe certain grains in arc-melted ingots by SEM, in backscattered electron mode (BSE) (Fig. 4). These observations confirmed the large size of the grains (more than 100 µm), and their irregular and angular shape anywhere in the sample horizontal cross section. However, the contrast between grains was not always sufficiently marked to enable the detection of their contours and measurement of their size by automatic image analysis.
Fig. 4. Backscattered electron SEM image of a horizontal section of an U3Si2 arc-melted ingot (I2).
In ingots I1 and I2, made with a stoichiometric 60U-40Si mixture and a high-purity U feedstock, SEM observations were performed at higher magnifications and evidenced the presence of a minor phase at U3Si2 grain boundaries (Fig. 5a). In this figure, this minor phase appears in light grey and
contains some pores (in black). EDS linescans show that this phase contains almost only uranium (Fig. 5b) and, in full consistency with XRD results, indicate its αU nature.
²
Fig. 5. (a) Backscattered electron SEM image of U-rich phase inclusions at U3Si2 grain boundaries,
in an I2 ingot and (b) EDS linescan performed through one of these inclusions.
With an excess of silicon (ingot I3), a secondary Si rich phase, is clearly observed (Fig. 6). Its surface fraction is significant. This phase adopts a square spiral pattern inside U3Si2 grains, on the
horizontal section (Fig. 6a), and a V shape on the vertical one (Fig. 6b). It is worth noting that this secondary phase exhibiting a spiral shape has also been observed in an ingot made with a lower Si excess (59%at. U/41%at. Si, unshown results). Such a composition is close to the one recommended for producing pure U3Si2 ingots [30].
According to EDS linescans (Fig. 6c), the majority phase composition is close to the 60U-40Si composition expected for the U3Si2 phase and the U/Si ratio of the secondary phase is close to 1. This
is consistent with the result of the XRD study, in which the U8Si8X phase has been identified (X
corresponding probably to a light element, such as O). O and C were detected on the whole sample surface, as surface contaminants (their concentration amounts to several at%). It was thus not possible to quantify the amount of these elements in the secondary phase by EDS analyses.
10
Fig. 6. Backscattered electron SEM images of (a) horizontal and (b) vertical sections of an I3 ingot (58 at.% U – 42 at.%Si) synthesized by arc-melting; (c) EDS linescan measured at the position
displayed by a yellow line in (a).
3.1.4 EBSD
Figure 7 gathers the EBSD maps acquired on two I1 and two I2 ingots, on their horizontal and vertical sections. The indexing rate, for EBSD raw data, was greater than 90% in the four cases. These data were gently cleaned, using a classical noise reduction treatment. In this figure, grains are coloured according to their orientation, using a classical inverse pole figure (IPF-Z) colour code. Grain boundaries with misorientations greater than 10° are outlined in black and non-indexed points (at crack locations, for example) are drawn in black. These settings are effective for studying grains in U3Si2 ingots, as very few low angle grain boundaries were encountered in these samples. However it
was impossible to index αU phase as it requires very specific polishing conditions to acquire exploitable EBSPs [40], not compatible with the one applied on U3Si2.
EBSD maps of the horizontal sections (Fig. 7b and d) confirm the OM observations, showing the presence of large angular grains, without strong differences between the inner and outer parts of the ingots. The grains are nevertheless much larger in the case of a “slow” cooling (mm-sized) than in the case of a “fast” cooling (hundred µm-sized). Furthermore, many grains exhibit colours close to red (Fig. 7b and Fig. 7d). This tends to indicate that they have a preferential orientation, corresponding to {001} planes of the tetragonal structure lying parallel to the sample surface, or <001> fiber axis perpendicular to that surface. This is particularly visible on the IPF-Z figure presented in Fig. 7b, which presents a clear reinforcement (in red) close to the 001 pole. This preferential orientation also exists for “slow” cooling conditions (IPF-Z figure in Fig. 7d) but is less marked. This indicates that the solid phase tends to grow with the c axis of the U3Si2 cell perpendicular to the cold Cu-hearth surface. In the
anisotropic tetragonal unit cell of U3Si2, the c direction has both the lowest atomic density and the
highest thermal conductivity [41]. This phenomenon is well known and commonly observed in different tetragonal intermetallic materials (e.g. [42]).
EBSD maps of the vertical sections (Fig. 7a and c) confirm this scenario. While small grains are observed at the surface in contact with the cold Cu-hearth, evidencing a fast solidification of the liquid
a) b)
in this area, the grains quickly grow with a strongly elongated morphology running from the cold side to the surface of the ingots. In this case also, the faster the cooling, the smaller the grains. Fig. 8a corresponds to the grain size distributions deduced from the two maps acquired on these vertical sections, in order to take into account both the small grains present at the surface in contact with the cooled copper hearth and the larger ones present in the core of the ingot. For “fast” (I1) and “slow” (I2) cooling, the d50 are 60 and 121 µm, respectively. The shape of U3Si2 elongated grains can be
characterized by analysing the aspect ratio defined in §2.2.3. This ratio was calculated from the EBSD maps collected for ingots I1 and I2 after exclusion of the smaller grains in contact with the copper hearth in order to quantify only the shape of elongated grains: the AR50 values obtained for I2 (“slow”
cooled) and I1 (“fast” cooled) are 2.75 and 3.20 respectively (Fig. 8b). U3Si2 grains are therefore much
more elongated along the vertical direction in a “fast” cooled than in “slow” cooled ingots. In horizontal section, AR50 of the two cooling conditions are very close, 1.86 and 1.94 for “slow” and “fast” cooling
respectively (not displayed). The colour code of these grains, mainly ranging from blue to green, indicate orientations perpendicular to the c-axis, in agreement with (i) the observations in the horizontal sections, and (ii) this axis as preferential growth direction from the cold hearth to the surface.
12 Vertical section Horizontal section
“Fast” cooling : Ingot I1 (a) (b) “Slow” cooling : Ingot I2 (c) (d)
Fig. 7. EBSD maps coloured in IPF-Z, collected on (a) (b) “fast” cooled ingot (I1) and (c) (d) “slow” cooled ingot (I2), in (a) (c) vertical cross sections and (b) (d) horizontal sections with corresponding
(a) (b)
Fig. 8. (a) Relative frequency of grain diameter and (b) cumulative frequency of aspect ratio, determined from EBSD maps acquired on vertical sections of a “fast” cooled (I1, in blue) and a “slow” cooled (I2, in
red) ingots.
3.2 I
NGOT PRODUCED WITH LOW PURITY URANIUMThis section is focused on the study of a single type of sample, ingots I4, prepared from the so-called “low purity uranium” (Table 1) with a stoichiometric 60U-40Si composition.
3.2.1 XRD
X-ray diffraction patterns monitored on I4 ingots are indexed with U3Si2, as the majority phase, and
U8Si8X and U34Si34.5, as minor phases (Fig. 9). Surprisingly, these secondary phases are Si-richer than
U3Si2, whereas one expects to observe a minor U-rich phase, as previously observed in I1 and I2
ingots (Fig. 5). In the absence of significant mass loss during the melting process (∆m/m = 0.3 %), another explanation had to be found for this different behaviour
Fig. 9. X-ray diffraction pattern measured on the crushed as-cast I4 ingot (60 at.% U of low purity) indexed with U3Si2, U8Si8X and U34Si34.5 .
14 grains defined from a metallurgical point of view as regions with same crystallographic orientation (see for example the grain contoured in red in Fig. 10a). EDS analyses confirmed that this phase is Si-rich (Fig. 10b). Based on these data, we believe that its composition is close to 50-50 at.% U-Si. Indeed, such EDS quantifications led to a slight overestimation of the uranium quantity since, as mentioned in section 2.2.2, only virtual standards were used. This means that absorption corrections factors were not optimized for a mixture of a heavy (U) and a light (Si) elements quantity, i.e. the uranium fraction is slightly overestimated.
The presence of light elements such as O and/or C in these secondary phases could not be neither confirmed nor ruled out by EDS quantifications as these elements are present as contaminants on the whole sample surface.
(a) (b)
Fig. 10. (a) Backscattered electron SEM image ofan I4 ingot prepared from “low purity U”, (b) EDS analysis of the secondary phase along the yellow line displayed in image (a). The red dotted line in (a)
contours an unique U3Si2 grain. 3.2.3 EBSD
Figure 11 gathers two large EBSD maps acquired on two I4-type “fast” cooled ingots, along vertical and horizontal sections, with a low spatial resolution (Table 2). Grain boundaries with misorientations greater than 10° are underlined in black and non-indexed pixels are drawn in black. Since this acquisition step (6.65 µm) is large compared to the size of the thickness of the secondary phase, only the U3Si2 majority phase could be indexed.
These maps are thus similar to the ones acquired on ingots with high purity uranium (Fig. 7), with elongated grains in the core and small and more equiaxed grains in contact with the copper hearth. A clear preferential orientation is also noticed in the horizontal section, with many grains having an orientation close to a <001> fiber axis perpendicular to that surface.
.
a) Vertical section b) Horizontal section c)
Fig. 11. EBSD maps coloured in IPF-Z, acquired on a “fast” cooled U3Si2 ingot, produced with low purity
U (I4), on (a) vertical section, (b) horizontal section and (c) its associated inverse pole figure in IPF-Z. As ingots obtained with low purity uranium exhibited a significant fraction of secondary phase, we performed local EBSD maps with a higher resolution, in order to index this secondary phase.
Figure 12 presents two maps, acquired at two different locations in the horizontal section of an I4 ingot. In addition to the U3Si2 majority phase, two other phases were indexed by EBSD: U34Si34.5 at the
core of the ingotand U8Si8X at the periphery. These phases are the same as those previously used to
interpret the XRD patterns (Fig. 9).
Fig. 12. EBSD local maps in phase contrast acquired (a) at the core and (b) at the periphery of the I4 ingot synthesized with “low purity U”. , with U3Si2 U8Si8X and U34Si34.5.
When the same areas are displayed in IPF-Z (Fig. 13), it is possible to see that the secondary phase has a unique orientation inside one U3Si2 grain (Fig. 13b). It can also be located as veins at the
interface between two U3Si2 grains (Fig. 13a).
Hearth
16 Fig. 13. EBSD local map of the areas displayed in Figure 12, in IPF-Z. IPF-Z colour codes are given
for the three following phases: U3Si2, U34Si34.5 and U8Si8X.
3.3 U
3S
I2 POWDERS FROM CRUSHED INGOTSThree U3Si2 powder samples (crushed I1 and I2 ingots, in strictly identical conditions; and industrial
material) were characterized by EBSD (Fig. 14). The main objective of this comparison was to insure that powders obtained at laboratory scale were comparable to those dispersed inside the fuel meat. The second objective was to study the impact of the ingot cooling rate on the characteristics of the crushed powder. In the case of the industrial powder, only few particles are displayed (Fig. 14c) because a very small amount of material was available and thus particles were far from each other inside the prepared compact.
In the three cases, the particle size varies from about 100 µm for the largest down to about 1 µm for the smallest ones. Moreover, particles present systematically angular shapes. In the case of the “fast” cooling conditions, the majority of the particles is polycrystalline (Fig. 14a). In the case of “slow” cooling conditions (Fig. 14b), the majority of the particles is single crystalline as observed on the industrial powder (Fig. 14c). Only a few ones comprise two or three grains, delimited by grain boundaries (some are pointed out by arrows in Fig. 14b and c). Slight colour variations corresponding to small orientation differences (of the order of a degree) are also observed in some grains (e.g. the grain encircled by a white dotted line in Fig. 14b). They are probably the result of topographic artefacts induced by crushing and/or polishing, in particular in cracked particles.
Based on SEM observation and image analyses, performed on polished sections of 500 particles from the crushed I1 ingot and 200 particles from the I2 one, it was possible to plot the cumulative frequency of particles as a function of their equivalent circular diameter for both crushed ingots. The corresponding results are presented in Fig. 15 and clearly show that particles are bigger in the case of “fast” cooled ingot. Indeed, the d50 (in number) of the I1 powder is about 16 µm, compared to 9 µm, for
that from the I2 ingot.
b) a)
Fig. 14. EBSD maps (coloured in IPF-Z) of crushed arc-melted U3Si2 ingots dispersed in an
aluminium matrix (black) obtained by (a) and (b) a laboratory process respectively from an I1 and an I2-type ingot and (c) the industrial process of Framatome CERCA. The white arrows indicate some grain boundaries within U3Si2 particles. The dotted white line in (b) encircles a particle with
18 Fig. 15. (a) Cumulative frequency of particles equivalent circular diameter, determined from SEM characterization of crushed “fast” cooled (I1, in blue) and “slow” cooled (I2, in red) ingots and two
SEM images collected on (b) I1 and (c) I2 ingots.
3.4 U
3S
I2/A
L PLATEFig. 16a corresponds to the EBSD map acquired on the meat of U3Si2/Al fuel plate [31], with the
U3Si2 phase coloured according to its IPF-Z orientation, and with the aluminium matrix and the
non-indexed points drawn in black. In agreement with the previous observations on the industrial powders, particles are very often single-crystalline, whatever their size. With the secondary electron image, important cracks are visible inside the U3Si2 particles (Fig. 16b). Some particles which can be seen in
the SEM map are fully or partly missing in the associated EBSD map. This is most probably due to cracks within particles which induce topographic variations. The EBSD patterns collected in such “wavy” areas are often very difficult to index and therefore are marked in black in the EBSD map.
Fig. 16. (a) EBSD map (coloured in IPF-Z) of a U3Si2/Al fuel plate manufactured by CERCA , observed
in cross section and (b) secondary electron SEM image of the same area. The matrix in black corresponds to aluminium.
4. SUMMARY OF MAIN RESULTS AND DISCUSSION
4.1 M
AIN RESULTSTable 5 summarizes the results obtained on the four types of ingots studied in this work. In the case of an I4 ingot, which was made with a low purity U batch, a corrected U/Si ratio is given, assuming that the total amount of impurities (including light elements such as C and O) in the U batch is about 2 at% (based on certificates of analysis of different U batches) and that impurities react with uranium. The I3 ingots were not studied by EBSD but, according to OM and SEM examinations, their microstructure is similar to those observed for the I4 ingots.
Table 5. Overview of the synthesis conditions and main microstructural characteristics of arc-melted ingots. Ingots U purity Mass (g) Estimated cooling rate
U/Si ratio (at.%)
Secondary phases Secondary phase characteristics d50 grain diameter in vertical section (µm)
AR50 aspect ratio of U3Si2 grains
Initial corrected Vertical section Horizontal section I1 High 0.5 “Very
fast” 60/40 60/40 αU
At U3Si2 grain
boundaries 60 3.20 1.94 I2 High 1 “Slow” 60/40 60/40 αU At U3Si2 grain
boundaries 121 2.75 1.86 I3 High 1 “Fast” 58/42 58/42 U8Si8X Spiral shape / / /
I4 Low 1 “Fast” 60/40 58/40 U8Si8X,
U34Si34.5 Spiral shape 67 2.87 1.90
Based on this table, all three investigated parameters, namely the U/Si ratio, the cooling rate and the uranium purity, are influencing the structure and microstructure of the ingots. The effect of each of
20
4.2 I
MPACT OF THEU/S
I RATIO ON THE MICROSTRUCTUREWhen using a stoichiometric U/Si ratio, the αU phase is systematically observed at grain boundaries of as-cast samples. These results are fully consistent with the literature [6] and confirm that, because U3Si2 phase does not accept any deviation from stoichiometry (Fig. 17), it is nearly
impossible to synthesize a single-phase ingot – moreover at a large industrial scale - even if U raw material contains few impurities and the exact stoichiometric ratio 3U/2Si is used. The high temperature extended domain of existence of U3Si2 highlighted by density functional theory
calculations [37] is thus not evidenced experimentally in the present work. A faster cooling rate would perhaps be necessary to stabilize an eventual non-stoichiometric U3Si2 phase down to room
temperature.
It is worth noting that the presence of a small fraction of αU is not deleterious under irradiation as it reacts with the aluminium matrix to form UAlx during fuel plate manufacturing [43].
Fig. 17. U-rich part of the U-Si binary phase diagram, displaying the congruent melting of U3Si2, the
eutectic point between U3Si2 and USi (U34Si34.5 or U8Si8X in presence of impurities) and the
composition of the ingots synthesized with excess of silicon (dashed green line) [39].
When adding on purpose an excess of silicon (2 at.%) (I3 ingots), a Si-rich phase corresponding to a U8Si8O type phase (named U8Si8X in this work) was indexed by XRD (Fig. 2). Zachariasen reported
this U8Si8O phase as a USi phase [32]. It was later supposed that this phase was stabilized by oxygen
impurities [29,33] and that the pure binary phase to be considered was U34Si34.5 [27]. Questions about
U8Si8O and its coexistence with U34Si34.5 arise from the results obtained in the present work. Studies
aimed to precise the conditions of formation of these two phases are currently ongoing but are outside the frame of the present article.
The results obtained on the I3 ingots tend to indicate that the voluntary addition of a small silicon excess in the U-Si mixture led to a shift towards the Si rich part of the binary phase diagram, as drawn in Fig. 17 (cf. green dotted line). A eutectic point between U34Si34.5 (or U8Si8X, according to XRD)and
U3Si2 is present in this part of the diagram. This means that the liquid phase leads to a mixture of
these two phases, as indeed observed in this ingot, which exhibits a two-phase microstructure characterized by a square spiral morphology.
It is interesting to note that similar spiral patterns of a secondary phase have been observed in the Zn-Mg system and, more precisely, in the eutectic Zn-Zn+3% Mg [44,45]. Eutectic solidification consists in the solidification of two phases. The faster growing phase (i.e. that with the highest melting point) tends to grow around the slower growing one, forming a spiral in the horizontal section. In vertical section a V-shape is adopted during solidification, with the tip of the V corresponding to the starting point of nucleation of the primary phase, as illustrated in Fig. 18 [44,46]. In the case of the Zn-Zn+3% Mg eutectic [45], spirals adopt a hexagonal shape, imposed by the Zn unit cell (space group P63/mmc no. 194). Our observations, in horizontal and vertical sections (Fig. 6), are in perfect
agreement with this phenomenon described and explained by Fullman and Wood [44]. The tetragonal unit cell of U3Si2 induces the square shape of the secondary phase spirals. Indeed, as U3Si2 solidifies
at higher temperature than the secondary phase, it would have a higher growth rate and would grow around this secondary phase (Fig. 18), leading to a spiral pattern. This particular microstructure of slightly over-stoichiometric U3Si2 ingots has never been reported in the literature, to the best of our
knowledge.
Finally, it is worth noting that “chevron” or “spiral” microstructures were also observed in as cast aluminium-uranium alloys and were attributed to an eutectic transformation involving an anisotropic phase (UAl4) [47].
Fig. 18. 3D Schematic representation of spiral cone morphology formed during an eutectic solidification, in vertical and horizontal sections, from [44] and associated images of I4 ingots.
4.3 I
MPACT OF URANIUM PURITY ON THE MICROSTRUCTUREIn the I4 ingot synthesized with low purity uranium, two secondary phases were evidenced: U8Si8X
and U34Si34.5. As in the case of the I3 ingot (made with high purity uranium and slightly deficient in
uranium), these secondary phases adopted a square spiral morphology, probably based on the same mechanism of formation as the one explained in §4.2. A similar composition of these phases was also obtained, according to EDS. According to the EBSD maps coloured in IPF-Z (Fig. 13), orientation relationships probably exist respectively between U8Si8X and U3Si2 and between U34Si34.5 and U3Si2
since in a given U3Si2 grain (characterized by a given colour), the veins of secondary phase tend to
have an unique orientation (also characterized by one colour). It was not possible to establish these relationships but their occurrence is fully consistent with the principle described in §4.2, where the U3Si2 phase grows around the secondary phase, inducing its orientation during solidification.
22 (O, C…), and the total amount of impurities in this batch could reach about 2 at.%, or even more. Their presence lead to a slight overestimation of the uranium quantity used in the synthesis. Furthermore, one or several of these impurities could stabilize the U8Si8X phase.
All these observations tend to confirm the assumption that impurities present in the feedstock lead to an overestimation of the uranium quantity and a shift of the U/Si ratio towards the eutectic point between U3Si2 and U34Si34.5 or U8Si8X in presence of impurities (Fig. 17).
4.4 I
MPACT OF THE COOLING RATE ON THE GRAIN SIZE AND SHAPEOn the one hand, as for each condition two ingots were synthesized, the results observed on vertical and horizontal section (Fig. 7) are consistent in term of grain size. On the other hand, these two sections are complementary because they revealed different structures.
For both cooling conditions, the vertical sections reveal elongated grains (Fig. 7a and c), compatible with those more “equiaxed” observed in the horizontal sections (Fig. 7b and d), in terms of number and size. It is also worth noting that these maps are consistent with the OM observations (Fig. 3) and with Obbard et al. results, obtained on a vertical section [13]. In both cooling conditions, small grains are observed close to the flat face that was in contact with the cooled copper hearth. In case of “slow” cooling, grains are much larger than for “fast” cooling. This difference is a clear indication of the incidence of the cooling rate on the microstructure of the ingots.
EBSD maps also reveal the consequences on the microstructure of the thermal gradient between the cooled copper hearth and the top of the ingot. These consequences are obvious in the case of the “fast” cooled ingot (Fig. 7a): at the bottom of this ingot, close to the cold copper hearth, the solidification rate is very high and leads to the formation of small grains, nearly equiaxed, as classically observed at the periphery of large ingots, in metallurgy [48]. Then, there is a slower transition from the liquid to the solid state with nucleation and growth driven by the thermal gradient. This gradient is strongly oriented and leads to a microstructure similar to that obtained with directional solidification [49]. This explains the elongated shape of the grains observed in the vertical section.
In the case of the “slowly” cooled ingot, grains are less elongated and their major axis tends to deviate from the vertical direction (Fig. 7c). This indicates that thermal transfers occur both with the cooled hearth and the Ar atmosphere, during the solidification, i.e. that a non-negligible thermal gradient also exists radially between the periphery and the core of the ingot.
Finite element calculations were performed to evaluate the temperature field in a 1 g ingot, after its melting. Calculations aim only at giving indicative information about what happened during the cooling and to confirm our assumption based on experimental data. Fig. 19 illustrates the results obtained at an intermediate time-step after melting for a “fast” cooling condition. It clearly shows that (i) the ingots are mainly cooled by the copper hearth but (ii) a radial contribution of thermal exchanges with the Ar atmosphere also plays a role and can explain the fan shape organisation taken by columnar grains in both cooling conditions. Note that this fan shape organisation is more visible in the “slowly” cooled ingot (Fig. 7c). The qualitative comparison of calculations made for “fast” and “slow” cooling conditions shows that the upper part of the ingot remains longer in the liquid state, promoting grain growth. With slower cooling conditions, the obtained temperature gradient is very similar to the one given in Fig. 19. It is therefore not presented. To investigate more deeply the solidification mechanisms (nucleation and growth of grains) in U3Si2 ingots, more complex calculations should be used (perhaps by a phase field
method). Moreover, the U3Si2 surface and interface energies recently reported by Beeler et al. [50] and
Fig. 19. Temperature field within a vertical cross-section of the U3Si2 ingot and the copper hearth at an
intermediate time step during the ingot solidification, obtained with a finite element calculation made for a “fast” cooling condition.
These results are in agreement with those obtained on other materials, also elaborated by arc-melting (see e.g. [49]). They highlight the impact of cooling rate on the grain size, grain shape and the preferential orientation induced by the thermal gradient. However, it is clear that arc-melting remains an apparatus/operator dependant technique and it is difficult to obtain fully reproducible results by precisely controlling the cooling conditions. A potential variability, in term of microstructure, between different arc-melted U3Si2 ingots can thus be expected.
4.5 I
MPACT OF FABRICATION PROCESS ON THE POWDER AND PLATE CHARACTERISTICSA large majority of particles obtained by laboratory (with “fast” or “slow” cooling conditions) or by an industrial process present an angular shape, as evidenced by the SEM and EBSD results (see Fig. 14). Particles obtained by crushing the “fast” cooled ingot, are mainly polycrystalline. Conversely, those obtained from the “slow” cooled laboratory ingot and from the industrial process are mainly single crystalline (as shown by the EBSD map presented in Fig. 14a). These observations are very probably a direct consequence of the grain size of the arc-melted samples.
Moreover, as proved by Metzger et al. [52] by microindentation, cracks propagate through grains, meaning that fragmentation is mainly intragranular. That is why, in the “slow” cooled ingots, particles can be found that include two grains separated by a grain boundary, as the one pointed by white arrow in Fig. 14b.
Ingot cooling conditions also influenced the particle size after crushing: Fig. 15 highlights that particles are bigger in the case of “fast” cooled ingot. We may speculate that their polycrystalline microstructure enhanced their resistance to fragmentation. This could have an important impact during the crushing step by limiting the level of fine particles and so the particle rejection rate after sieving.
In the as-fabricated fuel plate, almost all particles seem to be single crystalline. This is probably the consequence of the industrial manufacturing process. Indeed, the high charges used in the industrial arc melting process probably induce relatively “slow” cooling conditions of the ingot leading to large grains and, after crushing, to single crystalline particles. Another potential interest for using powder from “fast” cooled ingots must be mentioned here. Since they may have a higher resistance to fragmentation under mechanical loading, we may believe that their fragmentation during fuel plate fabrication by rolling should also be lower than for current particles. This is an important point because U3Si2 particle fragmentation during rolling is believed to be an important source of porosity in the core
[25]. Optimizing the ingot cooling conditions could therefore help for better controlling the U loading in the meat which a key point in the development towards “high loaded” U3Si2 plates [2].
24
5. CONCLUSION
The U3Si2 microstructure was studied from the arc-melted material to the MTR fuel plate. For this
purpose, we synthesized by arc-melting four types of U3Si2 ingots in order to investigate the effect of
cooling rate, excess of silicon and uranium purity on the solidified microstructure. EBSD proved to be an efficient technique to study the characteristics and the evolution of the microstructure of this intermetallic compound at the different stages of the manufacturing process.
With a 60%U-40%Si atomic ratio, an almost single-phase ingot with αU phase at U3Si2 grain
boundaries is observed, consistent with the fact that U3Si2 does not accept any deviation from
stoichiometry. The impact of cooling rate on grain size and shape on U3Si2 ingot microstructure is as
follows: “fast” cooling rate promotes smaller and more elongated grains than “slow” cooling rate. We also noticed that grain growth is driven by the thermal gradient within the ingot and that arc-melting induces a preferential orientation, with grains growing along the c-axis of the U3Si2 tetragonal cell.
The excess of silicon induced the occurrence of a minor phase, forming a eutectic with U3Si2 and
exhibiting a spiral shape microstructure. We also noticed that careful attention needs to be paid to uranium purity. Indeed, it can lead to overestimate the uranium quantity, inducing the formation of a secondary phase (U34Si34.5 or U8Si8X) in the ingot, which solidifies in spiral shape inside U3Si2 grains.
Studying the impact of cooling rate on the presence and morphology of secondary phase could be interesting, even if these minor phases may not be deleterious under irradiation [53].
After crushing the ingots, most of U3Si2 particles are single crystalline in the cases of a “slow”
cooled ingots, which is a direct consequence of the large grain size in the arc-melted material. On the contrary, for “fast” cooled ingots, particles are larger and mainly polycrystalline after crushing. Even if this property has probably no impact under irradiation as U3Si2 quickly amorphizes [1], it could
influence the fabrication process. The single crystalline feature could enhance the fragmentation during both crushing (increasing the rejection rate after sieving the powders) and during rolling of the fuel plates, and thus promote an increase of the porosity in the fuel core. Performing such a study on larger ingots obtained industrially would thus be of great interest.
A
CKNOWLEDGEMENT
Framatome-CERCA (Romans, France) is gratefully acknowledged for supplying the industrial U3Si2
samples (powder and plate) used in this study.
C
REDIT AUTHORSHIP CONTRIBUTION STATEMENT
Julien Havette: review, editing, sample synthesis, sample polishing. Xavière Iltis: writing-review, editing, supervision, EBSD acquisition and results treatment. Hervé Palancher: writing-writing-review, editing, supervision, Doris Drouan: sample polishing, EBSD acquisition. Olivier Fiquet: writing-review, editing. Etienne Castelier: writing-writing-review, finite element calculations. Mathieu Pasturel: writing-review, editing, supervision.
6. REFERENCES
1.
Kim, Y.S. Uranium Intermetallic Fuels (U–Al, U–Si, U–Mo). Compr. Nucl. Mater. 2012, 391–422.
2.
Valance, S.; Breitkreutz, H.; Calzavara, Y.; Hrehor, M.; Huet, F.; Jaroszewicz, J.; Palancher, H.;
Van den Berghe, S. The H2020 European Project LEU-FOREVER: LEU fuels for medium and high
power research reactors in Europe.; Munich, Germany, 2018.
3.
Jeong, Y.J.; Kim, S.H.; Song, H.Y.; Kang, D.H.; Park, C.H.; Lee, K.H.; Kim, K.N.; Park, J.M. A
Qualification Base Report on High-Density U
3Si
2/Al Dispersion Fuel for High-Power Research
Reactors.; Zagreb, Croatia, 2019.
4.
Kim Y.S.; Oaks, A.; Ye, B.; Jamison, L.; Mo, K.; Miao, Y.; Bhattacharya, S.; Mei, Z.; Hofman, G.L.;
Yacout, A.M.; et al. Current Status on the Development of High-density LEU U
3Si
2Fuel in KAERI.;
Zagreb, Croatia, 2019.
5.
Liu, R.; Zhou, W.; Cai, J. Multiphysics modeling of accident tolerant fuel-cladding U
3Si
2-FeCrAl
performance in a light water reactor. Nucl. Eng. Des. 2018, 330, 106–116,
doi:10.1016/j.nucengdes.2018.01.041.
6.
Harp, J.M.; Lessing, P.A.; Hoggan, R.E. Uranium silicide pellet fabrication by powder metallurgy
for accident tolerant fuel evaluation and irradiation. J. Nucl. Mater. 2015, 466, 728–738,
doi:10.1016/j.jnucmat.2015.06.027.
7.
Durand, J.; Duban, B.; Lavastre, Y. CERCA’s 25 years experience in U
3Si
2fuel manufacturing 25th
International meeting on RERTR.; Chicago, USA, 2003.
8.
Saliba-Silva, A.M.; Durazzo, M.; Carvalho, D.; Urano, E.F.; Riella, H.G. Fabrication of U
3Si
2Powder for Fuels Used in IEA-R1 Nuclear Research Reactor. In Proceedings of the Materials
Science Forum; 2008.
9.
Marín, J.; Lisboa, J.; Ureta, J.; Olivares, L.; Contreras, H.; Chávez, J.C. Synthesis and clad
interaction study of U
3Si
2powders dispersed in an aluminum matrix. J. Nucl. Mater. 1996, 228,
61–67, doi:10.1016/0022-3115(95)00167-0.
10. Kim, C.K.; Park, J.M.; Ryu, H.J. Use of a centrifugal atomization process in the development of
research reactor fuel. Nucl. Eng. Technol. 2007, 39, 617–626.
11. Kim, K.-H.; Bae LEE, D.; Kim, C.-K.; Hyun KUK, I.; Paik, K.-W. Characteristics of U
3Si and U
3Si
2Powders Prepared by Centrifugal Atomization. J. Nucl. Sci. Technol. 1997, 34, 1127–1132,
doi:10.3327/jnst.34.1127.
12. Kim, C.-K.; Kim, K.-H.; Lee, D.-B. High U-Density Nuclear Fuel Development with Application of
Centrifugal Atomization Technology.; Korea, 1997.
13. Obbard, E.G.; Johnson, K.D.; Burr, P.A.; Lopes, D.A.; Gregg, D.J.; Liss, K.-D.; Griffiths, G.; Scales,
N.; Middleburgh, S.C. Anisotropy in the thermal expansion of uranium silicide measured by
neutron diffraction. J. Nucl. Mater. 2018, 508, 516–520, doi:10.1016/j.jnucmat.2018.04.049.
14. Lopes, D.A.; Benarosch, A.; Middleburgh, S.; Johnson, K.D. Spark plasma sintering and
microstructural analysis of pure and Mo doped U
3Si
2pellets. J. Nucl. Mater. 2017, 496, 234–
241, doi:10.1016/j.jnucmat.2017.09.037.
15. Nelson, A.T.; White, J.T.; Byler, D.D.; Dunwoody, J.T.; Valdez, J.A.; McClellan, K.J. Overview of
Properties and Performance of Uranium-Silicide Compounds for Light Water Reactor
Applications. Trans. Am. Nucl. Soc. 2014, 110, 4.
16. Metzger, K.E. Analysis of pellet cladding interaction and creep of U
3Si
2fuel for use in light water
reactors. Ph.D., University of South Carolina: United States - South Carolina, 2016.
17. Hoggan, R.; Harp, J.; He, L. Evaluation of U
3Si
2Fuel Pellets Sintered in an Argon vs. Vacuum
Environment. Adv. Ceram. Environ. Funct. Struct. Energy Appl. 2018, 21–26.
18. Hoggan, R.E.; Tolman, K.R.; Cappia, F.; Wagner, A.R.; Harp, J.M. Grain size and phase purity
characterization of U
3Si
2fuel pellets. J. Nucl. Mater. 2018, 512, 199–213,
doi:10.1016/j.jnucmat.2018.10.011.
26