HAL Id: halshs-01243694
https://halshs.archives-ouvertes.fr/halshs-01243694
Submitted on 15 Dec 2015
HAL is a multi-disciplinary open access
archive for the deposit and dissemination of
sci-entific research documents, whether they are
pub-lished or not. The documents may come from
teaching and research institutions in France or
abroad, or from public or private research centers.
L’archive ouverte pluridisciplinaire HAL, est
destinée au dépôt et à la diffusion de documents
scientifiques de niveau recherche, publiés ou non,
émanant des établissements d’enseignement et de
recherche français ou étrangers, des laboratoires
publics ou privés.
A network-based analysis of the European Emission
Market
Andreas Karpf, Antoine Mandel, Stefano Battiston
To cite this version:
Andreas Karpf, Antoine Mandel, Stefano Battiston. A network-based analysis of the European
Emis-sion Market. 2015. �halshs-01243694�
Documents de Travail du
Centre d’Economie de la Sorbonne
A network-based analysis of the European
Emission Market
Andreas K
ARPF,Antoine M
ANDEL,Stefano B
ATTISTONA network-based analysis of the European
Emission Market
Andreas Karpf1, Antoine Mandel2, and Stefano Battiston3
1
Universit´e Paris 1 Panth´eon-Sorbonne, Centre d’ ´Economie de la Sorbonne / Paris School of Economics, France
2 Universit´e Paris 1 Panth´eon-Sorbonne, Centre d’ ´Economie de la Sorbonne, France 3
University of Zurich, Department of Banking and Finance, Switzerland
Abstract. This paper analyses the European Emission Trading System (ETS) from a network perspective. It is shown that the network exhibits a strong core-periphery structure also reflected in the network formation process. Due to a lack of centralized market places, operators of instal-lations which fall under the EU ETS reguinstal-lations have to resort to local networks or financial intermediaries if they want to participate in the market. This undermines the central idea of the ETS to exploit marginal abatement costs.
Keywords: network, emission market, ETS, network topology JEL Classification: L14, D85, Q56
This article is forthcoming in the Proceedings of the European Con-ference on Complex Systems [ECCS] 2014.
1
The European Emission Trading System
1.1 Background
The Kyoto Protocol (KP) [2] from 1998 extended the United Nations Framework Convention on Climate Change (UNFFCCC) [1] negotiated in 1992 during the UN Conference on Environment and Development by defining targets for the re-duction of green house gas (GHG) emissions into the atmosphere. These targets follow the principle of “common but differentiated responsibilities” as outlined in Article 3 of the KP [2]. Accommodating the responsibility of industrialized countries for the contemporary levels of GHG emissions, these targets were de-termined to be binding for the group of developed signatory states referred to as the Annex 1 parties. The protocol was signed and ratified by 191 parties of
which one was the European Union4.5
The Annex 1 parties comprise 37 industrialized countries of which 28 are now members of the European Union. The legally binding commitment of the
4 Council Decision of 15 December 1993 [3] 5
Noteworthy exceptions are the United States which signed but never ratified the KP and finally withdrew in 2001 and Canada which quit the treaty in 2011.
signatory countries concerns the most relevant greenhouse gases and gas groups.6
The targets themselves are however quantified in CO2 equivalents with regard
to global warming potential and as percentages of the emissions in a base year, which, for the majority of the Annex 1 parties, is 1990. The European Union as
a whole committed itself to collectively reduce CO2 emissions by 8% until 2012
and 20% until 2020 with respect to base year emissions. Under the premise of “common but shared responsibilities” member state specific reduction goals were defined, which take into account the different levels of economic development within the union, the respective structures of the national economies as well as early measures to reduce GHG emissions.
To keep the costs of limiting CO2emissions as small as possible for the
signa-tory countries the KP allows for so called “flexible mechanisms” which serve as an alternative to traditional approaches like carbon taxes or compensating mea-sures as reforestation (Art. 3.3) [2]. These mechanisms comprise International Emission Trading (IET), Clean Development Mechanisms (CDM) [2, Art. 12] and Joint Implementation (JI) (Art. 6)[2].
Emission Trading The concept of IET plays the central role of flexible emission
reduction instruments. It exploits differing marginal abatement costs (MAC)7
between countries, firms, industries or even between different branches within a company [7]. The system bases on a “cap-and-trade” principle in which
per-mitted emission units, so called allowance units 8, are allocated to emitters of
green house gases. These assigned allowance units (AAU) normally depend on historical yearly green house gas emission data and are capped with regard to committed emission reduction targets. Thereby allowance units become a scarce good which participants can exchange in a market context. Periodically mar-ket participants which are legally committed to reduce their emissions have to surrender the amount of allowance units in their possession. These are subse-quently compared with the realized emissions which are permanently recorded at the respective installations to check if the emission reduction targets were met. Installations can be factories, power plants or even aircrafts. If the available al-lowance units fall short of the realized emissions the obliged market participants have to pay a fine proportional to the allowance units by which the emission reduction obligations were missed.
Clean Development Mechanism & Joint Implementation The system of emis-sion trading is complimented by the CDM and the JI mechanism. In contrast to emission trading these mechanisms are project based. Predicated on the assump-tion that acassump-tions which lead to the reducassump-tion of GHG eventually have positive effects in slowing down global warming no matter where on the planet they are conducted, Annex 1 countries can engage in GHG emission reducing projects 6 Carbon dioxide, methane, nitrous oxide, sulphur hexafluoride, hydrofluorocarbons
and perfluorocarbons
7 This is the marginal cost of reducing green house gas emissions by one unit. 8
One emission allowance unit typically corresponds to one metric ton of CO2
abroad in order to earn emission reduction units (ERU) which in turn can be traded on the emission market or used when surrendering one’s allowances at the end of a compliance period. While the JI mechanism is supposed to foster
coop-eration between Annex 1 countries9 to meet their GHG reduction targets, the
CDM aims to stimulate GHG reducing investments and projects in non-Annex 1 countries (mainly developing countries) to promote sustainable development (Art. 12) [2] and to help Annex 1 countries to meet their emission reduction commitments with the lowest possible costs.
1.2 The adoption of European Emission Trading System and its
Functioning
Since Japan rejected all attempts to give the UN the legal instruments to enforce the emission reduction commitments in the KP and the United States withdrew from the protocol in 2001 it became soon clear that the EU had to find an internal solution if it wanted to stick to the GHG reduction targets to which it committed itself in the KP [8]. After an understanding was found between member states to differentiate the GHG reduction targets with regard to the level of economic development in the form of the “burden sharing agreement ” (BSA) [10], the initial resistance with regard to the implementation of a European emission trading scheme (ETS) began to crumble. The European Union emission
trading scheme was finally legally implemented by directive 2003/87/EC [9]10
and subsequently adopted into national laws.
The ETS covers factories, power stations, and other installations with a net heat excess of 20 MW in emission intensive industries responsible for roughly 50% of the GHG emissions in the concerned 31 countries (EU plus Switzerland, Norway and Liechtenstein). With directive 2008/101/EC the aviation industry was also included into the ETS. The emission allowance units (EUA) are allo-cated to each of the approximately 11,000 installations in February each year on a national level in line with the respective BSA and KP reduction targets and have to be surrendered by the operator holding accounts (OPA) at latest end of April in the subsequent year. The fine for each EUA after surrendering that falls short of the verified emissions amounts to EUR 100. Operators are allowed to bank and respectively borrow allowances within a trading period. It was however not permitted to carry allowances from Pilot Phase I (2005 - 2007) to Phase II (2008-20012), and from there to Phase III (2013 - 2020) [11].
The ETS is not only open to OHAs, but also private entities which don’t fall under the ETS regulation are allowed against a fee to trade on the emission market. These entities are referred to as private holding accounts (PHA). EUAs can be traded bilaterally, over the counter (OTC) via a broker or on one of 9 The majority of currently ongoing Joint Implementation projects are situated in
transition economies with Annex 1 obligations like the Russian Federation and Ukraine [6]
10
The directive was later amended by Directive 2004/101/EC, Directive 2008/101/EC, Regulation (EC) No 219/2009 and Directive 2009/29/EC
Europe’s climate exchange markets like the European Climate Exchange (ECX), the European Energy Exchange AG (EEX) etc. For the time for which the transaction data set is available the most common form of transactions was OTC.
As prescribed by 2003/87/EC and 2009/29/EC every transaction in the ETS has to be recorded in some sort of accounting system (registries) and is accessible to the public with an embargo of three years. At the beginning these registries were organized on a national level. Since 2008 this function is resumed by a central Community Independent Transaction Log (CITL) accessible online un-der http://ec.europa.eu/environment/ets/. The transaction data from the CITL form the base of our network-based analysis of the EU ETS.
2
The data set
The transaction data set containing the exact time stamp of the transaction and its volume as well as information about the accounts active in the ETS and data with regard to the allowance allocation, the surrendering of the allowances as well as the verified emissions were scraped from the CITL. The raw data set contains approximately 520,000 transactions to which we added spot price information downloaded from Bloomberg as well as data about the ownership structure and the type of companies in the ETS from the “Ownership Links and Enhanced EUTL Dataset” [12]. In our analysis we concentrate only on the market movements which are relevant for the price formation of the EUA cer-tificates (transaction types 3-0, 3-21 and 10-0). Transactions connected to the administration of the ETS as for the allowance issuance, retirement, cancella-tion, surrender, allocacancella-tion, and correction were discarded. The remaining 364,810 transactions are analyzed in what follows.
3
Methodology and research questions
A network based analysis of the European Emission market is performed. A network based on the transaction data set is therefore constructed. Thereby agents active in the emission market are regarded as vertices. These vertices are connected by directed edges in the form of transactions from the seller (the source vertex) to the buyer (the target vertex). The edges are weighted by the volume of EUAs transferred in the respective transaction. Figure 1 shows a plot of the resulting network graph.
The aim is to investigate the connection between the network structure and the functioning of the market. In this context the following research questions are to be addressed: 1) Is the organization of the market reflected in the structure of the network? 2) Which factors are relevant for the matching process on the EU ETS? 3) Is the network structure supporting the idea of emission markets to exploit differences in marginal abatement costs? 4) Does the position of an agent within the network have an implication for its ability to create revenues out of a trade?
Fig. 1. The CO2 trading network [CDM (green), finance (red), foundation (yellow), government (orange), industry (blue)]
4
The Network structure of the European Emission
markets
Following Li et al. [13] some tests with regard to the market structure were
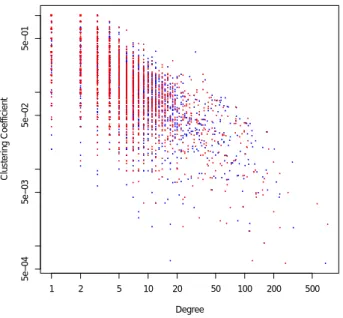
conducted. Figure 2 plots the in- and out-degrees11 vs. the cliquishness12 of
agents. The downward sloping cloud implies a hierarchy in the market with a strong core of highly connected nodes and clusters of nodes on the periphery. This phenomenon can also be observed in the plot of the emission market network in Figure 1.
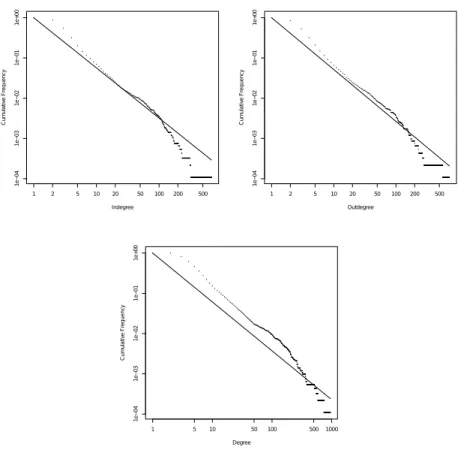
The core periphery structure of the trading network is also observable when looking at the degree distribution directly (see Figure 3): The distributions of the in-, out- and total-degrees follow a power law i.e. there are agents whose in-, out- or total degrees strongly exceed the average. The exponents of the power-law distributions fitted to the in-, out- and total-degree-distribution are 2.25, 11The in- and out-degrees of each agent: this means the active and passive
connected-ness of agents.
12Be the k-core of graph a maximal subgraph in which each vertex has at least degree
k. The cliquishness or coreness of a vertex is then k if it belongs to the k-core but not to the (k+1)-core.[15]
● ● ● ● ● ● ● ● ● ● ● ● ● ● ● ● ● ● ● ● ● ●● ● ● ● ● ● ● ● ● ● ● ● ● ● ● ● ● ● ● ● ● ● ● ● ● ● ● ● ● ● ● ● ● ● ● ● ● ● ● ● ● ● ● ● ● ● ● ● ● ● ● ● ● ● ● ● ● ● ● ● ● ● ● ● ● ● ● ● ● ● ● ● ● ● ● ● ● ● ● ● ● ● ● ● ● ● ● ● ● ● ● ● ● ● ● ● ● ● ● ● ● ● ● ● ● ● ● ● ● ● ● ● ● ● ● ● ● ● ●● ● ● ● ● ● ● ● ● ● ● ● ● ● ● ● ● ● ● ● ● ● ● ● ● ● ● ● ● ● ● ● ● ● ● ● ● ● ● ● ● ● ● ● ● ● ● ● ● ● ● ● ● ● ● ● ● ● ● ● ● ● ● ● ● ● ● ● ● ● ● ●● ● ● ● ● ● ● ● ● ● ● ● ● ● ● ● ● ● ● ● ● ● ● ● ● ● ● ● ● ● ● ● ● ● ● ● ● ● ● ● ● ● ● ● ● ● ● ● ● ● ● ● ● ● ● ● ● ● ● ● ● ● ● ● ● ● ● ● ● ● ● ● ● ● ● ● ● ● ● ● ● ● ● ● ● ● ● ● ● ● ● ● ● ● ● ● ● ● ● ● ● ● ● ● ● ● ● ● ● ● ● ● ● ● ● ● ● ● ● ● ● ● ● ● ● ● ● ● ● ● ● ● ● ● ● ● ● ● ● ● ● ● ● ● ● ● ● ● ● ●● ● ● ● ● ● ● ● ● ● ● ● ● ● ● ● ● ● ● ● ● ● ● ● ● ● ● ● ● ● ● ● ● ● ● ● ● ● ● ● ● ● ● ● ● ●● ● ● ● ● ● ● ● ● ● ● ● ● ● ● ● ● ● ● ● ● ● ● ● ● ● ● ● ● ● ● ● ● ● ● ● ● ● ● ● ● ● ● ● ● ● ● ● ● ● ● ● ● ● ● ● ● ● ● ● ● ● ● ● ● ● ● ● ● ● ● ● ● ● ● ● ● ● ● ● ● ● ● ● ● ● ● ● ● ● ● ● ● ● ● ● ● ● ● ● ● ● ● ●● ● ● ● ● ● ● ● ● ● ● ● ● ● ● ● ● ● ● ● ● ● ● ● ● ● ● ● ● ● ● ● ● ● ●● ● ● ● ● ● ● ● ● ● ● ● ● ● ● ● ● ● ● ● ● ● ●● ● ● ● ● ● ● ● ● ● ● ●● ● ● ● ● ● ● ●● ● ● ● ● ● ● ● ● ● ● ●●● ● ● ● ● ● ●● ● ● ● ● ● ● ● ● ● ● ● ● ● ● ● ● ● ● ● ● ● ● ● ● ● ● ● ● ● ● ● ● ● ● ● ● ● ● ● ● ● ● ● ● ● ● ● ● ● ● ● ● ● ●●● ● ● ● ● ●● ● ● ● ● ● ● ● ● ● ● ● ● ● ● ● ● ● ● ● ● ● ● ● ● ● ● ● ● ● ● ● ● ● ● ● ● ● ● ● ● ● ● ● ● ● ● ● ● ● ● ● ● ● ● ● ● ● ● ● ● ● ● ● ● ● ● ● ● ● ● ● ● ● ● ● ● ● ● ● ● ● ● ● ● ● ● ● ● ● ● ● ● ● ● ● ● ● ● ● ● ● ● ● ● ● ● ● ● ● ● ● ● ● ● ● ● ● ● ● ● ● ● ● ● ● ● ● ● ● ● ● ● ● ● ● ● ● ● ● ● ● ● ● ● ● ●● ● ● ● ● ● ● ● ● ● ● ● ● ● ● ● ● ● ● ● ● ● ● ● ● ● ● ● ● ● ● ● ● ● ● ● ● ● ● ● ● ● ● ● ● ● ● ● ● ● ● ● ● ● ● ● ● ● ● ● ● ● ● ● ● ● ● ● ● ● ● ● ● ● ● ● ● ● ● ● ● ● ● ● ● ● ●● ● ● ● ● ● ● ●● ● ● ● ● ● ● ● ● ● ● ● ● ● ● ● ● ● ● ● ● ● ● ● ● ● ● ● ● ● ● ●● ● ● ●● ● ● ● ● ● ● ● ● ● ● ● ● ● ● ● ● ● ● ● ● ● ● ● ● ● ● ● ● ● ● ● ● ● ● ● ● ● ● ● ● ● ● ● ● ● ● ● ● ● ● ● ● ● ● ● ● ● ● ● ● ● ● ● ● ● ● ● ● ● ●● ● ● ● ● ● ● ● ● ● ● ● ● ● ● ● ● ● ● ● ● ● ● ● ● ● ● ● ● ● ● ● ● ● ● ● ● ● ●● ● ● ● ● ● ● ● ● ● ● ● ● ● ● ● ● ● ● ● ● ●● ● ● ● ● ● ● ● ● ● ●● ●●● ● ● ● ● ● ● ● ● ● ● ● ● ● ● ● ● ● ● ● ● ● ● ● ● ● ● ● ● ● ● ● ● ● ● ● ● ● ● ● ● ● ● ● ● ● ● ● ● ● ● ● ● ● ● ● ● ● ● ● ● ● ● ● ● ● ● ● ● ● ● ● ● ● ● ● ● ● ● ● ● ● ● ● ● ● ● ● ● ● ● ● ● ● ● ● ● ● ● ●● ● ● ● ● ● ● ● ● ● ● ● ● ● ● ● ● ● ● ● ● ● ● ● ● ● ● ● ● ● ● ● ● ● ● ● ● ● ● ● ● ● ● ● ● ● ● ● ● ● ● ● ● ● ● ● ● ● ● ● ● ● ● ● ● ● ●● ● ● ● ● ● ● ● ● ● ● ● ● ● ● ● ● ● ● ● ● ● ● ● ● ● ● ● ● ● ● ● ● ● ● ● ● ● ● ● ● ● ● ● ● ● ● ● ● ● ● ● ●● ● ● ● ● ● ● ● ● ● ● ● ● ● ● ● ● ● ● ● ● ● ● ● ● ● ● ● ● ● ● ● ● ● ● ● ● ●● ● ● ● ● ● ● ● ● ● ● ● ● ● ● ● ● ● ● ● ● ● ● ● ● ● ● ● ● ● ● ● ● ● ● ● ● ● ● ● ● ● ● ● ● ● ● ● ● ● ● ● ● ● ● ● ● ● ● ● ● ● ● ● ● ● ● ● ● ● ● ● ● ● ● ● ● ● ● ● ● ● ● ● ● ● ● ● ● ● ● ● ● ● ● ● ● ● ● ● ● ● ● ● ● ● ● ● ● ● ● ● ● ● ● ● ● ● ● ● ● ● ● ● ● ● ● ●● ● ● ● ● ● ● ● ● ●● ● ●● ● ● ● ● ● ● ● ● ● ● ● ● ● ● ●● ● ● ● ● ● ● ● ● ● ● ● ● ● ● ● ● ● ●● ● ● ● ● ● ● ● ● ● ● ● ● ● ● ● ● ● ● ● ● ● ● ● ● ● ● ● ● ● ● ● ● ● ● ● ● ● ● ● ● ● ● ● ● ● ● ● ● ● ● ● ● ● ● ● ● ● ● ● ● ● ● ● ● ● ● ● ●● ● ● ● ● ● ● ● ● ● ● ● ● ● ● ● ● ● ● ● ● ● ● ● ● ● ● ● ● ● ● ● ● ● ● ● ● ● ● ● ● ● ● ● ● ● ● ● ● ● ● ● ● ● ● ● ● ● ● ●● ● ● ● ● ● ● ● ● ● ● ● ● ● ● ● ● ●● ● ● ●● ● ● ● ● ● ● ● ● ● ● ● ● ● ●● ● ● ● ● ● ● ● ● ● ●● ● ● ● ● ●● ● ● ● ● ● ● ●● ● ● ● ● ● ● ● ● ● ● ● ● ● ●● ● ● ● ● ● ● ● ● ● ● ● ● ● ● ● ● ● ● ● ● ● ●● ● ● ● ● ● ● ● ● ● ● ●● ● ● ● ● ● ● ● ● ● ● ● ● ● ● ● ● ● ● ● ● ● ● ● ● ● ● ● ● ● ● ● ● ● ● ● ● ● ● ● ● ● ● ● ● ● ● ● ● ● ● ● ● ●● ● ● ● ● ● ● ● ● ● ●● ● ● ● ● ● ● ● ● ● ● ● ● ● ● ● ● ● ● ● ● ● ● ● ● ● ● ● ● ● ● ● ● ● ● ● ● ● ● ● ● ● ● ● ● ● ● ● ● ● ● ● ● ● ● ● ● ● ● ● ● ● ● ● ● ● ● ● ●● ● ● ● ●● ● ● ● ● ● ● ● ● ● ● ● ● ● ● ● ● ● ● ● ● ● ●●● ● ●●●● ● ●● ● ● ● ● ● ●●● ● ●●●●●●●●● ● ● ● ● ●● ● ● ● ● ● ● ● ● ● ● ● ● ● ● ● ● ● ● ● ● ● ● ● ● ● ● ● ● ● ● ● ● ● ● ● ● ● ● ● ● ● ● ● ● ● ● ● ● ● ● ● ● ● ● ● ● ● ● ● ● ● ● ● ● ● ● ● ● ● ● ● ● ● ● ● ● ● ● ● ● ● ● ● ● ●● ● ● ● ● ● ● ● ● ● ● ● ● ● ● ● ●● ● ● ● ● ● ● ● ● ● ● ● ● ● ● ● ● ● ● ● ● ● ● ● ● ●● ● ● ● ● ● ● ● ● ● ● ● ● ● ● ● ● ● ● ● ● ● ● ● ● ● ● ● ● ● ● ● ● ● ● ● ● ● ● ● ● ● ● ● ● ● ● ● ● ● ● ● ● ● ● ●● ● ● ● ●● ● ● ● ● ● ● ● ● ● ● ● ● ●● ● ● ● ● ● ● ● ● ● ● ● ● ● ● ● ● ● ● ● ● ● ● ● ● ● ● ● ● ● ● ● ● ● ● ● ● ● ● ● ● ● ● ●● ● ● ● ● ● ● ● ● ● ● ● ● ● ● ● ● ● ● ● ● ● ● ● ● ● ● ● ● ● ● ● ● ● ● ● ● ● ● ● ● ● ● ● ● ● ● ● ● ● ● ● ● ● ● ● ● ● ● ● ● ● ● ● ● ● ● ● ● ● ● ● ● ● ● ● ● ● ● ● ● ● ● ● ● ● ● ● ● ● ● ● ● ● ● ● ● ● ● ● ● ● ● ● ●● ● ● ● ● ● ● ● ● ● ● ● ● ● ● ● ● ● ● ● ● ● ● ● ● ● ● ● ● ● ● ● ● ● ● ● ● ● ● ● ● ● ● ● ● ● ● ● ● ● ● ● ● ● ● ● ● ● ● ● ● ● ● ● ● ● ● ● ● ● ● ● ● ● ● ● ● ● ● ● ● ● ● ● ● ● ● ● ● ● ● ● ● ● ● ● ● ● ● ● ● ● ● ● ● ● ●● ●● ● ● ● ●● ● ● ● ● ● ●● ● ● ● ● ● ● ● ● ●● ● ● ●● ● ● ● ● ● ● ● ● ● ● ● ● ● ● ● ● ● ● ● ● ● ● ● ● ● ● ● ● ● ● ● ● ● ● ● ● ● ● ● ● ● ● ● ● ● ● ● ● ● ● ● ● ● ● ● ● ● ● ● ● ● ● ● ● ● ● ● ●● ● ● ● ● ● ● ● ● ● ● ● ● ● ● ● ● ● ● ● ● ● ● ● ● ● ● ● ● ● ●● ● ● ● ● ● ● ● ● ● ● ● ● ● ● ● ● ● ● ● ● ● ● ● ● ● ● ●● ● ● ● ● ● ● ● ● ● ● ● ● ● ● ● ● ● ● ● ●● ● ● ● ● ● ● ● ● ● ● ● ● ● ● ● ● ● ● ● ● ● ●●● ● ● ● ● ● ● ● ● ● ● ● ● ● ● ● ● ● ● ● ● ● ● ● ● ● ● ● ● ●● ● ● ● ● ● ● ● ● ● ● ● ● ● ● ● ● ● ● ● ● ● ● ● ● ● ● ● ● ● ● ● ● ● ● ● ● ● ● ● ● ● ● ● ● ● ● ● ● ● ● ● ● ● ● ● ● ● ● ● ● ● ● ● ● ● ● ● ● ● ● ● ● ● ● ● ● ● ● ● ● ● ● ● ● ● ● ● ● ● ● ● ● ●● ● ● ● ● ● ● ● ● ● ● ● ● ● ● ● ● ● ● ● ● ● ● ● ● ● ● ● ● ● ● ● ● ● ● ● ● ● ● ● ● ● ● ● ● ● ● ● ● ● ● ● ● ● ● ● ●● ● ● ● ● ● ● ● ● ● ● ● ● ● ● ● ● ● ● ● ● ● ● ● ● ● ● ● ●● ● ● ● ● ● ● ● ●● ● ● ● ● ● ● ● ● ● ● ● ● ● ● ● ● ● ● ● ● ● ● ● ● ● ● ● ● ● ● ● ● ● ● ● ● ● ● ● ● ● ● ● ● ● ● ● ● ● ● ● ● ● ● ● ● ● ● ● ● ● ● ● ● ● ● ● ● ● ● ● ● ● ● ● ● ● ●● ● ● ● ●● ● ● ● ● ●● ● ● ● ● ● ● ● ● ● ● ● ● ● ● ● ● ● ● ● ● ● ● ● ● ● ● ● ● ● ● ● ● ● ● ● ● ● ●● ● ● ● ● ● ● ● ● ● ● ● ● ●● ● ● ● ● ● ● ● ● ● ● ●● ● ● ● ● ●● ● ● ● ● ● ● ● ● ● ● ● ● ● ● ● ● ● ● ● ● ● ● ● ● ● ● ● ●● ● ● ● ● ●● ●●● ● ● ● ● ● ● ● ● ● ● ● ● ● ● ● ● ● ● ● ● ● ● ● ● ● ● ● ● ● ● ● ● ● ● ● ● ● ● ● ● ●● ● ● ● ● ● ● ● ● ● ● ● ● ● ● ● ● ● ● ● ● ● ●● ● ● ● ● ● ● ● ● ● ● ● ● ● ● ● ● ● ● ● ● ● ● ● ● ● ● ● ● ● ● ● ● ● ● ● ● ● ● ● ● ● ● ● ● ● ● ● ● ● ● ● ● ● ● ● ● ● ● ● ● ● ● ● ● ● ● ● ● ● ● ● ● ● ● ● ● ● ● ● ● ● ● ● ● ● ● ● ● ● ● ● ● ● ● ● ● ● ● ● ● ● ● ● ● ● ● ● ● ● ● ● ● ● ● ● ● ● ● ● ● ● ● ● ●● ● ● ● ● ● ● ● ● ● ● ● ● ● ● ● ● ● ● ● ● ● ● ● ● ● ● ● ● ● ● ● ● ● ● ● ● ● ● ● ● ● ● ● ● ● ● ● ● ● ● ● ● ● ● ● ● ● ● ● ● ● ● ● ● ● ● ● ● ● ● ● ● ● ● ● ● ● ● ● ● ● ● ● ● ● ● ● ● ● ● ●● ● ● ● ● ● ● ● ● ● ● ● ● ● ● ● ● ● ● ● ● ● ● ● ● ● ● ● ● ● ● ● ● ● ● ● ● ● ● ● ●● ● ● ● ● ● ● ● ● ● ● ● ● ● ● ● ● ● ● ● ● ● ● ● ● ● ● ● ● ● ● ● ● ● ● ● ● ● ● ● ● ●● ● ● ● ● ● ● ● ● ● ● ● ● ● ● ● ● ● ● ● ● ● ● ● ● ● ● ●● ● ●● ● ● ● ● ● ● ● ● ● ● ● ● ● ● ● ●●● ● ●● ● ● ● ● ● ● ● ● ●● ● ● ● ● ● ● ● ● ● ● ● ● ● ● ● ● ● ● ● ● ● ● ● ● ● ● ● ● ● ● ● ● ● ● ● ●● ● ● ● ● ● ● ● ● ● ● ● ● ● ● ● ● ● ● ● ● ● ● ● ● ● ● ● ● ● ● ● ● ● ● ● ● ● ● ●● ● ● ● ● ● ● ●● ● ● ● ● ● ● ● ● ● ● ● ● ● ● ● ● ● ● ● ● ● ● ● ● ● ● ● ● ● ● ●● ● ● ● ● ● ● ● ● ● ● ●● ● ● ● ● ● ● ● ● ● ● ● ● ● ●● ● ● ● ● ● ●●● ● ●● ● ● ● ●● ● ● ● ● ● ● ● ● ● ● ● ● ● ● ● ● ● ● ● ● ● ● ● ● ● ●● ● ● ●● ● ● ● ● ● ● ● ● ● ● ● ● ● ● ● ● ● ● ● ● ● ● ●● ● ● ●●●● ●● ● ● ● ● ● ● ● ● ● ●● ● ● ● ● ● ● ● ● ● ● ● ● ● ● ● ● ● ● ● ● ● ● ● ● ● ● ● ● ● ● ● ● ● ● ● ● ● ● ● ● ● ● ● ● ● ● ● ● ● ● ● ● ● ● ● ● ● ● ● ● ● ● ● ● ● ● ●● ● ● ● ● ● ● ● ● ● ● ● ●● ● ● ● ● ● ● ● ● ● ● ● ● ● ● ● ● ● ● ● ● ● ● ● ● ● ● ● ●●●●●● ● ● ● ● ● ● ● ● ● ● ● ● ● ●● ● ● ● ● ● ● ● ● ● ● ● ●● ● ● ● ● ● ● ● ● ● ● ●● ● ● ● ●● ● ● ● ● ● ● ● ● ●● ● ●● ● ● ● ● ●● ●● ● ● ● ● ●● ● ● ● ●● ● ● ●● ● ● ● ● ● ● ● ● ● ● ● ● ● ● ● ● ● ● ● ● ● ● ● ● ● ● ● ● ● ● ● ●● ● ● ● ● ● ● ● ● ●● ● ● ● ● ● ●● ● ● ● ● ● ● ● ● ● ● ● ● ●●● ● ● ● ● ● ● ● ● ● ● ●● ● ● ● ● ●● ● ● ● ● ● ● ● ● ● ● ●● ● ● ● ● ● ● ● ● ●● ● ● ● ● ● ● ● ● ● ●● ● ● ● ● ● ● ● ● ● ●● ● ● ● ● ● ● ● ● ● ● ● ● ● ● ● ●● ● ● ● ● ● ● ●● ● ● ● ● ●● ● ● ● ● ● ● ● ● ● ● ● ● ● ● ● ● ●● ● ● ● ● ● ● ● ● ● ● ● ● ● ● ● ●● ● ● ● ● ● ● ● ● ● ● ● ● ● ● ●● ●● ● ● ● ● ● ● ● ● ● ● ● ● ● ● ● ● ● ● ● ●●● ● ●●●● ●● ●●● ● ● ●● ● ● ● ● ● ● ● ● ● ● ● ● ● ● ● ● ● ● ● ● ● ● ● ● ● ● ● ● ● ● ● ● ● ● ● ● ●● ●● ● ● ● ● ●● ● ●● ● ● ●● ● ● ● ● ● ● ●●● ● ● ● ● ● ● ● ● ● ● ● ● ● ● ● ● ● ●● ● ● ● ● ● ● ● ● ●●● ● ●●● ● ● ● ● ● ● ● ● ● ● ● ●● ● ● ● ● ● ● ● ● ● ● ●● ● ● ● ● ● ● ● ● ● ● ● ● ● ● ●● ● ● ● ● ● ● ● ● ● ● ● ● ●● ● ●● ● ● ●● ●● ● ● ● ● ● ●●● ● ● ● ● ●● ● ● ● ● ● ●● ● ● ●●●●●● ● ● ●●● ● ● ● ●● ● ● ● ● ● ● ● ● ● ● ● ● ● ● ● ● ● ● ● ● ● ● ● ● ● ● ● ● ● ● ● ● ● ● ● ●● ●● ● ● ● ● ● ● ● ● ● ● ● ●●● ● ● ● ● ● ● ● ● ● ● ● ●● ● ● ● ● ● ● ● ● ● ● ●●● ● ● ● ● ● ● ● ● ●●● ● ● ●●● ● ●●●●●●●●●●●●●● ● ●●●●●●● ● ● ● ● ●●● ● ●●●●● ● ● ● ●●● ●● ● ●● ● ●● ● ● ●● ● ●● ● ● ● ● ● ●●●●●● ● ●● ● ●●●● ● ● ● ● ● ● ●●●● ● ● ● ●●●●●● ● ● ● ●●●●●● ● ●●●●● ●● ●●●● ● ●●● ● ●● ● ● ● ● ●● ● ●●●● ● ● ● ● ●●● ● ● ● ● ● ● ● ● ● ● ● ● ●●●●● ● ● ● ●● ● ●● ●● ● ● ●● ● ● ●●●● ● ●● ● ●●●●●●●● ● ●●● ● ● ● ●●●●●● ● ● ● ● ●●●●●● ● ●●●●●●●● ● ● ●● ● ●● ● ● ●●●● ● ● ● ● ● ● ● ● ● ● ● ● ● ● ● ● ● ● ● ● ● ● ● ● ● ● ● ● ● ● ● ● ● ● ● ● ● ● ● ● ● ● ● ● ● ● ● ● ● ● ● ● ● ● ● ● ● ● ● ● ● ● ● ● ● ● ● ● ● ● ● ● ● ● ● ● ● ● ● ● ● ● ● ● ● ● ● ● ● ● ● ● ● ● ● ● ● ● ● ● ● ● ● ● ● ● ● ● ● ● ● ● ● ● ● ● ● ● ● ● ● ● ● ● ● ● ● ● ● ● ● ● ● ● ● ● ● ● ● ● ● ●● ● ● ● ● ● ● ● ● ● ● ● ● ● ● ● ● ● ● ● ● ● ● ● ● ● ● ● ● ● ● ● ● ● ● ● ● ● ● ● ● ● ● ● ● ● ● ● ● ● ● ● ● ● ● ● ● ● ● ● ● ● ● ● ● ● ● ● ● ● ● ●● ● ● ● ● ● ● ● ● ● ● ● ● ● ● ● ● ● ● ● ● ● ● ● ● ● ● ● ● ● ● ● ● ● ● ● ● ● ● ● ● ● ● ● ● ● ● ● ● ● ● ● ● ● ● ● ● ● ● ● ● ● ● ● ● ● ● ● ● ● ●● ● ● ● ● ● ● ● ● ● ● ● ● ● ● ● ● ● ● ● ● ●● ● ● ● ● ● ● ● ● ● ● ● ● ● ● ● ● ● ● ● ● ● ● ● ● ● ● ● ● ● ● ● ● ● ● ● ● ● ● ● ● ● ● ● ● ● ● ● ● ● ● ● ● ● ● ● ● ● ● ● ●● ● ● ● ● ● ● ● ● ● ● ● ● ● ● ● ● ● ● ● ● ● ● ● ● ● ● ● ● ● ● ● ● ● ● ● ● ● ● ● ● ● ● ● ● ● ●● ● ● ● ● ● ● ● ● ● ● ● ● ● ● ● ● ● ● ● ● ● ● ● ● ● ● ● ● ● ● ● ● ● ● ● ● ● ● ● ● ● ● ● ● ● ● ● ● ● ● ● ● ● ● ● ● ● ● ● ● ● ● ● ● ● ● ● ● ● ● ● ● ● ● ● ● ● ● ● ● ● ● ● ● ● ● ● ● ● ● ● ● ● ● ● ● ● ● ● ● ● ● ● ● ● ●● ● ● ● ● ● ● ● ● ● ● ● ● ● ● ● ● ● ● ● ● ● ● ● ● ● ● ● ● ● ● ● ● ● ●● ● ● ● ● ● ● ● ● ● ● ● ● ● ● ● ● ● ● ● ● ● ● ● ● ● ● ● ● ● ● ● ● ● ● ● ●● ● ● ● ● ● ● ● ● ● ● ● ● ● ● ● ● ● ● ●●● ● ● ● ● ● ● ● ● ● ● ● ● ● ● ● ● ● ● ● ● ● ● ● ● ● ● ● ● ● ● ● ● ● ● ● ● ● ● ● ● ● ● ● ● ● ● ● ● ● ● ● ● ● ● ● ● ● ● ● ● ● ● ●●● ● ● ● ● ● ● ● ● ● ● ● ● ● ● ● ● ● ● ● ● ● ● ● ● ● ● ● ● ● ● ● ● ● ● ● ● ● ● ● ● ● ● ● ● ● ● ● ● ● ● ● ● ● ● ● ● ● ● ● ● ● ● ● ● ● ● ● ● ● ● ● ● ● ● ● ● ● ● ● ● ● ● ● ● ● ● ● ● ● ● ● ● ● ● ● ● ● ● ● ● ● ● ● ● ● ● ● ● ● ● ● ● ● ● ● ● ● ● ● ● ● ● ● ● ● ● ● ● ● ● ● ● ● ●● ● ● ● ● ● ● ● ● ● ● ● ● ● ● ● ● ● ● ● ● ● ● ● ● ● ● ● ● ● ● ● ● ● ● ● ● ● ● ● ● ● ● ● ● ● ● ● ● ● ● ● ● ● ● ● ● ● ● ● ● ●● ● ● ● ● ● ● ● ● ● ● ● ● ● ● ● ● ● ● ● ● ● ● ● ● ● ● ● ● ● ● ● ● ● ● ● ● ● ● ● ● ● ● ● ● ● ● ● ● ● ● ● ● ● ● ● ●● ● ● ● ● ● ● ● ● ● ● ● ● ● ● ● ● ● ● ● ● ● ● ● ● ● ● ● ● ● ● ● ● ● ● ● ● ● ● ● ● ● ● ● ● ● ● ● ● ● ● ● ● ● ● ● ● ● ● ● ● ● ● ● ● ● ● ● ● ● ● ● ● ● ● ● ● ● ● ● ● ● ● ● ● ● ● ● ● ● ● ● ● ● ● ● ● ● ● ● ● ● ● ● ● ● ● ●● ●● ● ● ● ● ● ● ● ● ● ● ● ● ● ● ● ● ● ● ● ● ● ● ● ● ● ● ● ● ● ● ● ● ● ● ● ● ● ● ● ● ● ● ● ● ●● ● ● ● ● ● ● ● ● ● ● ● ● ●● ● ●● ● ● ● ● ● ● ● ● ● ●● ● ● ● ● ● ● ● ● ● ● ● ● ● ● ● ● ● ● ● ● ● ● ● ● ● ● ● ● ● ● ● ● ● ● ● ● ● ● ● ● ● ● ● ● ● ● ● ● ● ● ● ● ● ● ● ● ● ● ● ● ● ● ● ● ● ● ● ● ● ● ● ● ● ● ● ● ● ● ● ● ● ● ● ● ● ● ● ● ● ● ● ● ● ● ● ● ● ● ● ● ● ● ● ● ●● ● ● ● ● ● ● ● ● ● ● ● ● ● ● ● ● ● ● ● ● ● ● ● ● ● ● ● ● ● ● ● ● ● ● ● ● ● ● ● ● ● ● ● ● ● ● ● ● ● ● ● ● ● ● ● ● ● ● ● ● ● ● ● ● ● ● ●● ● ● ● ● ● ● ● ● ● ● ● ● ● ● ● ● ● ● ● ● ● ● ● ● ● ● ● ● ● ● ● ● ● ● ● ● ● ● ● ● ● ● ● ● ● ● ● ● ● ● ● ● ● ● ● ● ● ● ● ● ● ● ● ● ● ● ● ● ● ● ● ● ● ● ● ● ● ● ● ● ● ● ● ● ● ● ● ● ● ● ● ● ● ●● ● ● ● ● ● ● ● ● ● ● ● ● ● ● ● ● ● ● ● ● ● ● ● ● ● ● ● ● ● ● ● ● ● ● ● ● ● ● ● ● ● ● ● ● ● ● ● ● ● ● ● ● ● ● ● ● ● ● ● ● ● ● ● ● ● ● ● ● ● ●● ● ● ● ● ● ● ● ● ● ● ● ● ● ● ● ● ● ● ● ● ● ● ● ● ● ● ● ● ● ● ● ● ● ● ● ● ● ● ● ● ● ● ● ● ● ● ● ● ● ● ● ● ● ● ● ● ● ● ● ● ● ● ● ● ● ● ● ● ● ● ● ● ●● ● ● ● ● ● ● ● ● ● ● ● ● ● ● ● ● ● ● ● ● ●● ● ●● ● ● ● ● ● ● ● ● ● ● ● ● ● ● ● ●● ● ● ● ● ● ● ● ● ● ● ● ● ● ● ● ● ● ● ● ● ● ● ● ● ● ● ● ● ● ● ● ● ● ● ● ● ● ● ● ● ● ● ● ● ● ● ● ● ● ● ● ● ● ● ● ● ● ● ● ● ● ● ● ● ● ● ● ● ● ● ● ● ● ● ● ●● ● ● ● ● ● ● ● ● ● ● ● ● ● ● ● ● ● ● ● ● ● ● ● ● ● ● ● ● ● ● ● ● ● ● ● ● ● ● ● ●● ● ● ● ● ● ● ● ● ● ● ● ● ● ● ● ● ● ● ● ● ● ●● ● ● ● ● ● ● ● ● ● ● ● ● ● ● ● ● ● ●● ● ● ●● ● ● ● ● ● ● ● ● ● ● ● ● ● ● ●● ● ● ● ● ● ● ● ● ● ● ●● ● ● ● ● ●● ● ● ● ● ● ● ●● ● ● ● ● ● ● ● ● ● ● ● ●● ●● ● ● ● ● ● ● ● ● ● ● ● ● ● ● ● ● ● ● ● ● ● ● ● ● ● ● ● ● ● ● ● ●● ●● ● ● ● ● ● ● ● ● ● ● ● ● ● ● ● ● ● ● ● ● ● ● ● ● ● ● ● ● ● ● ● ● ● ● ● ● ● ● ● ● ● ● ● ● ● ● ● ● ● ● ● ● ● ● ● ● ● ● ● ● ● ● ● ● ● ● ● ● ● ● ● ● ● ● ● ● ● ● ● ● ● ● ● ● ● ●● ● ● ● ● ● ● ● ● ● ● ● ● ● ● ● ● ● ● ● ● ● ● ● ● ● ● ● ● ● ● ● ● ● ● ● ● ● ● ● ● ● ● ● ● ● ● ● ● ● ● ● ● ● ● ●● ● ● ● ●● ● ● ● ● ● ● ● ● ● ● ● ● ● ● ● ● ● ● ● ● ● ● ●●● ● ●●●● ● ● ● ● ● ● ● ● ●●● ● ●●●●●●●●● ● ● ● ● ●●● ● ● ● ● ● ● ● ● ● ● ● ● ● ● ● ● ● ● ● ● ● ● ● ● ● ● ● ● ● ● ● ● ● ● ● ● ● ● ● ● ● ● ● ● ● ● ● ● ● ● ● ● ● ● ● ● ● ● ● ● ● ● ● ● ● ● ● ● ● ● ● ● ● ● ● ● ● ● ● ● ● ● ● ● ● ● ● ● ● ● ● ● ● ● ● ● ● ● ● ● ● ● ● ● ● ● ● ● ● ● ●● ● ● ● ● ● ● ● ● ● ● ● ● ● ● ● ● ● ● ● ● ● ● ● ● ● ● ● ●● ● ● ● ● ● ● ● ● ● ● ● ● ● ● ● ● ● ● ● ● ● ● ● ● ● ● ● ● ● ● ● ● ● ● ● ● ● ● ● ● ● ● ● ● ● ● ● ● ● ● ● ● ● ● ●● ● ● ● ● ● ● ● ● ● ● ● ● ● ● ● ● ● ●● ● ● ● ● ● ● ● ● ● ● ● ● ● ● ● ● ● ● ● ● ● ● ● ● ● ● ● ● ● ● ● ● ● ● ● ● ● ● ● ● ● ● ● ● ● ●● ● ● ● ● ● ● ● ● ● ● ● ● ● ● ● ● ● ● ● ● ● ● ● ● ● ● ● ● ● ● ● ● ● ● ● ● ● ● ● ● ● ● ● ● ● ● ● ● ● ● ● ● ● ● ● ●● ● ● ● ● ● ● ● ● ● ● ● ● ● ● ● ● ● ● ● ● ● ● ● ● ● ● ● ● ● ● ● ● ● ● ● ● ● ● ● ● ● ● ● ● ● ● ● ● ● ● ● ● ● ● ● ● ● ● ● ● ● ● ● ● ● ● ● ● ● ● ● ● ● ● ● ● ● ● ● ● ● ● ● ● ● ● ● ● ● ● ● ● ● ● ● ● ● ● ● ● ● ● ● ● ● ● ● ● ● ● ● ● ● ● ● ● ● ● ● ● ● ● ● ● ● ● ● ● ● ● ● ● ● ● ● ● ● ● ● ● ● ● ● ● ● ● ● ● ● ● ● ● ● ● ● ● ● ● ● ● ●● ● ● ● ● ● ●● ● ● ● ● ● ●● ● ● ● ● ● ● ● ● ● ●● ● ● ● ● ● ● ● ● ● ● ● ● ● ● ● ● ● ● ● ● ● ● ● ● ● ● ● ● ● ● ● ● ● ● ● ● ● ● ● ● ● ● ● ● ● ● ● ● ● ● ● ● ● ● ● ● ● ● ● ● ● ● ● ● ● ● ● ● ● ● ● ● ● ● ● ● ● ●● ● ● ● ● ● ● ● ● ● ● ● ● ● ● ● ● ● ● ● ● ● ● ● ● ● ● ● ● ● ● ● ●● ● ● ● ● ● ● ● ● ● ● ● ●● ● ● ● ● ● ● ● ● ● ● ● ● ● ● ● ●● ● ● ● ● ● ● ● ● ● ● ● ● ● ● ● ●● ● ● ● ●● ● ● ● ● ● ● ● ● ● ● ● ● ● ● ● ● ● ● ● ● ● ● ●●● ● ● ● ● ● ● ● ● ● ● ● ● ● ● ● ● ● ● ● ● ● ● ● ● ● ● ● ● ● ●● ● ● ● ● ● ● ● ● ● ● ● ● ● ● ● ● ● ● ● ● ● ● ● ● ● ● ● ● ● ● ● ● ● ● ● ● ● ● ● ● ● ● ● ● ● ● ● ● ● ● ● ● ● ● ● ● ● ● ● ● ● ● ● ● ● ● ● ● ● ● ● ● ● ● ● ● ● ● ● ● ● ● ● ● ● ● ● ● ● ● ● ● ● ● ● ● ● ●● ● ● ● ● ● ● ● ● ● ● ● ● ● ● ● ● ● ● ● ●●● ● ● ● ● ● ● ● ● ● ● ● ● ●●● ● ● ● ● ● ● ● ● ● ● ● ● ● ● ● ● ● ● ● ● ● ● ● ● ●● ● ● ● ● ● ● ● ● ● ● ● ● ● ● ● ● ● ● ● ● ● ● ● ● ● ● ● ● ● ● ●● ● ● ● ● ● ● ● ●● ● ● ● ● ● ● ● ● ● ● ● ● ● ● ● ● ● ● ● ● ● ● ● ● ● ● ● ● ● ● ● ● ● ● ● ● ● ● ● ● ● ● ● ● ● ● ● ● ● ● ● ● ● ● ● ● ● ● ● ● ● ● ● ● ● ● ● ● ● ● ● ● ● ● ● ● ● ● ●● ● ●● ● ● ● ● ●● ● ● ● ●● ● ● ●● ● ● ● ● ● ● ● ● ● ● ● ● ● ● ● ● ● ● ● ● ● ● ● ● ● ● ● ● ● ● ● ● ● ● ●● ● ● ● ● ● ● ● ● ● ● ● ● ● ● ●● ● ● ● ●● ● ● ● ● ● ●● ● ● ● ● ● ● ● ● ● ● ● ● ● ● ● ● ● ● ● ● ● ● ● ● ● ● ● ● ● ● ● ● ●●● ● ● ● ● ●● ●●● ● ● ● ● ● ● ● ● ● ● ● ● ● ● ● ● ● ● ● ● ● ● ● ● ● ● ● ● ● ● ● ● ● ● ● ● ● ● ● ● ●● ● ● ● ● ● ● ● ● ● ● ● ● ● ● ● ● ● ● ● ● ● ● ●● ● ● ● ● ● ● ● ● ● ● ● ● ● ● ● ● ● ● ● ● ● ● ● ● ● ● ● ● ● ● ● ● ● ● ● ● ● ● ● ● ● ● ● ● ● ● ● ● ● ● ● ● ● ● ● ● ● ● ● ● ● ● ● ● ● ● ● ● ● ● ● ● ● ● ● ● ● ● ● ● ● ● ● ● ● ● ● ● ● ● ● ● ● ● ● ● ● ● ● ● ● ● ● ● ● ● ● ● ● ● ● ● ● ● ● ● ● ● ● ● ● ● ● ● ● ● ● ● ● ● ●● ● ● ● ● ● ● ●● ● ● ● ● ● ● ● ● ● ● ● ● ● ● ● ● ● ● ● ● ● ● ● ● ● ● ● ● ● ● ● ● ● ● ● ● ● ● ● ● ● ● ● ● ● ● ● ● ● ● ● ● ● ● ● ● ● ● ● ● ● ● ● ● ● ● ● ● ● ● ● ● ● ● ● ● ● ● ● ● ● ● ● ● ● ● ● ●● ● ● ● ● ● ● ● ● ● ● ● ● ● ● ● ● ● ● ● ● ● ● ● ● ● ●● ● ● ● ● ● ● ● ● ● ● ● ● ● ● ●● ● ● ● ● ● ● ● ● ● ●● ● ● ● ● ● ● ● ● ● ● ● ● ● ● ● ● ● ● ● ● ● ● ● ● ● ● ● ● ● ● ● ● ●● ● ● ● ● ● ● ● ● ● ● ● ● ● ● ● ● ● ● ● ● ● ● ● ● ● ● ● ● ● ● ● ● ● ● ● ● ● ● ● ● ● ● ● ● ● ● ● ●●● ● ●● ● ● ● ● ● ● ● ● ●● ● ● ● ● ● ● ● ● ● ● ● ● ● ● ● ● ● ● ● ● ● ● ● ● ● ● ● ● ● ● ● ● ● ● ● ● ● ●● ● ● ● ● ● ● ● ● ● ● ● ● ● ● ● ● ● ● ● ● ● ● ● ● ● ● ● ● ● ● ● ● ● ● ● ● ● ● ● ● ●● ● ● ● ● ● ● ●● ● ● ● ● ● ● ● ● ● ● ● ● ● ● ● ● ● ● ● ● ● ● ● ● ● ● ● ● ● ● ●● ● ● ● ● ● ● ● ● ● ● ●● ● ● ●● ● ● ● ● ● ● ● ● ●● ● ● ● ● ● ● ●●● ● ●● ●● ● ●● ● ● ● ● ● ● ● ● ● ● ● ● ● ● ● ● ● ● ● ● ● ● ● ● ● ● ●● ● ● ●● ● ● ● ● ● ● ● ● ● ●●● ● ● ● ● ● ● ● ● ● ● ● ● ● ● ● ● ● ●●●● ●● ● ● ● ● ● ● ● ● ● ● ●● ● ● ● ● ● ● ● ● ● ● ● ● ● ● ● ● ● ● ● ● ● ● ● ● ● ● ● ● ● ● ● ● ● ● ● ● ● ● ● ●● ● ● ● ● ● ● ● ● ● ● ● ● ● ● ● ● ● ● ● ● ● ● ● ● ● ● ● ●● ● ● ● ● ● ● ● ● ● ● ● ●● ● ● ● ● ● ● ● ● ● ● ● ● ● ● ● ● ● ● ● ● ● ● ● ● ● ● ● ●●●●●● ● ● ● ● ● ● ● ● ● ● ● ● ● ●● ● ● ● ● ● ● ● ● ● ● ● ●● ● ● ● ● ● ● ● ● ● ● ● ●● ● ● ● ●● ● ● ● ● ● ● ● ● ●● ● ●● ● ● ● ● ● ● ●● ● ● ● ● ●● ● ● ●●●● ● ● ●● ● ● ● ● ● ● ● ● ● ● ● ● ● ● ● ● ● ● ● ● ● ● ● ● ● ● ● ● ● ● ● ● ●● ● ● ● ● ● ● ● ● ●● ● ● ● ● ● ●● ● ● ● ● ● ● ● ● ● ● ● ● ● ●●● ● ● ● ● ● ● ● ● ● ● ●● ● ● ● ● ● ● ● ● ● ● ● ● ● ● ● ● ●● ● ● ● ● ● ● ● ● ● ● ● ● ● ● ● ● ● ● ● ● ● ● ●● ● ● ● ● ● ● ● ● ● ●● ● ● ● ● ● ● ● ● ● ● ● ● ● ● ● ● ●● ● ● ● ● ● ● ●● ● ●● ● ● ● ● ● ● ● ● ● ● ● ● ● ● ● ● ● ● ● ● ● ● ● ● ● ● ● ● ● ● ● ● ● ● ● ● ● ● ● ● ●● ● ●● ● ● ● ● ● ● ● ● ● ● ● ● ● ● ●● ●● ● ● ● ● ● ● ● ● ● ● ● ● ● ● ● ● ● ● ● ● ● ● ●●● ● ● ●●● ● ●● ●●● ● ● ● ● ● ● ● ● ● ● ● ● ● ● ● ● ● ● ● ● ● ● ● ● ● ● ● ● ● ● ● ● ● ● ● ● ● ● ● ● ● ● ● ● ● ●● ●● ● ● ● ● ●● ● ●● ● ● ●● ● ● ● ● ● ● ●●● ● ● ● ● ● ● ● ● ● ● ● ● ● ● ● ● ●●● ● ● ● ● ● ● ● ● ●●● ● ●●● ● ● ●● ● ● ● ● ● ● ● ●●●● ● ● ● ● ● ● ● ● ●● ● ● ● ● ● ● ● ● ● ● ●● ● ● ●● ● ● ● ● ● ● ● ● ● ● ● ● ● ● ● ●● ● ●● ● ● ● ● ●● ● ● ● ●● ● ●●● ● ● ● ● ●● ● ● ● ● ● ●● ● ● ●●●●●● ● ● ●●● ● ● ● ●● ● ● ● ● ●● ● ● ● ● ● ● ● ● ● ● ● ● ● ● ● ● ● ● ● ● ● ● ● ● ● ● ● ● ● ● ●● ●● ● ● ● ● ● ● ● ● ● ●● ●●● ● ● ● ● ● ● ● ● ● ● ● ● ●● ● 1 2 5 10 20 50 100 200 500 5e−04 5e−03 5e−02 5e−01 Degree Cluster ing Coefficient
Fig. 2. In-/Out-Degree vs. Cliquishness (in-degree: blue; out-degree: red)
2.29 and 2.21 respectively. A conducted Kolmogorov-Smirnov test on the degree distributions resulted in p-values of 0.76, 0.97 and 0.96 respectively, indicating that the hypothesis that the original data could have been drawn from the fitted power-law distributions cannot be rejected in several cases. The observed network thus falls into the category of scale free networks.
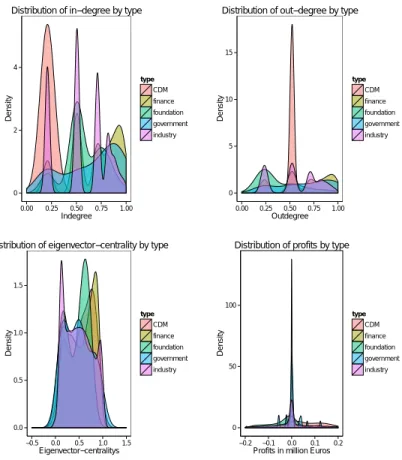
We further computed the density distribution of multiple network statistics
(in-, out- degree as well as eigenvector centrality 13) as well as for profits of
companies in the European emission market combined with informations about their type.
In this case the core-periphery structure is observable in the wave-like forms of the density plots displayed in Figure 4. This structure is also reflected in the network plot in Figure 1 which has a highly connected center which is dominated by nodes from the finance sector (red) surrounded by concentric circles of nodes from the industries (OHA). Going from the inside to the outside the nodes are lesser connected and thus exhibit a lower degree of centrality. Looking at the plot in the lower right of Figure 4 this, at least for the group of agents which 13
Eigenvector centrality: the first eigenvector of the adjacency matrix giving the cen-tralities for each vertex. It can be understood as a reciprocal process in which the centrality of a vertex depends proportionally on the centralities of other vertices to which it is connected.
● ● ● ● ● ● ● ● ● ● ● ● ● ●● ●●● ●● ● ● ●●●●●●●●●●●● ●● ●● ●●● ●● ●●●●●●●●●●●●●●●●●●●●●●●●●●●●●●●●●●●●●●●●●●●●●●●●●●●●●●●●●●●●●●●●●●●●●●●●●●●●● ●●●●●●●●●●●●●●●●●●● ●●●●●●●●●●●●●●●● ●●●●●●●●●●●●● ● ●●●●● ●●●●●●●●●●●●●●●●●●●●●●●●●●●●●● ●●●●●●●●●● ●●●●●●●●●●●●●●● ●●● ●●●●●●●●●●●●●●●●●●●●●●●●●●●●●●●●●●●●●●●●●●●●●●●●●●●●●●●●●●●●●●●●●●●●●●●●●●●●●●●●● ●●●●●●● ●●●●●●●●●●●●●●●●●●●●●●●●●●●●●●●●●●●●●●●●●●●●●●●●●●●●●●●●●●●●●●●●●●●●●●●●●●●●●●●●●●●●●●●●●●●●●●●●●●●●●●●●●●●●●●●●●●●●●●●●●●●●●●●●●●●●●●●●●●●●●●●●●●●●●●●●●●●●●●●●●●●●●●●●●●●●●●●●●●●●●●●●●●●●●●●●●●●●●●●●●●●●●●●●●●●●●●●●●●●●●●●●●●●●●●●●●●●●●●●●●●●●●●●●●●●●●●●●●●●●●●●●●●●●●●●●●●●●●●●●●●●●●●●●●●●●●●●●●●●●●●●●●●●●●●●●●●●●●●●●●●●●●●●●●●●●●●●●●●●●●●●●●●●●●●●●●●●●●●●●●●●●●●● 1 2 5 10 20 50 100 200 500 1e−04 1e−03 1e−02 1e−01 1e+00 Indegree Cum ulativ e Frequency ● ● ● ● ● ● ● ● ● ● ● ● ● ●● ●●●● ●●●●●●●●●●● ●● ●●●● ●●●●●●●●●●●●●●●●●●●●●●●●●●●●●●● ●●●●●●●●●●●●●●● ●●●●●●●●●●●●●●●●●● ●●●●●●● ●●●●●●●●●●●●●●●●●●●●●●●●● ●●●●●●●●●●●●●●●●●●●●●●●●● ●●●● ●●●●●●●●●●●● ●●●●● ●●●●●●●●●●●●●●●●●●●●●● ● ●●●●●●●●●●●●●●●●●●●●●●●●●●●●●●● ● ●●●●●●●●●●●●●●●●●●●●●●●●●●●●●●●●● ●●●●●●●●●●●●●●●● ●●●●●●●●●●●●●●●●●●●●●●●●●●●●●●●●●●●●●●●●●●●●●●●●●●●●●●●●●●●●●●●●●●●●●●●●●●●●●●●●●●●●●●●●●●●●●●●●●●●●●●●●●●●●●●●●●●●●●●●●●●●●●●●●●●●●●●●●●●●●●●●●●●●●●●●●●●●●●●●●●●●●●●●●●●●●●●●●●●●●●●●●●●●●●●●●●●●●●●●●●●●●●●●●●●●●●●●●●●●●●●●●●●●●●●●●●●●●●●●●●●●●●●●●●●●●●●●●●●●●●●●●●●●●●●●●●●●●●●●●●● ●●●●●●●●●●●●●●●●●●●●●●●●●●●●●●●●●●●●●●●●●●●●●●●●●●●●●●●●●●●●●●●●●●●●●●●●●●●●●●●●●●●●●●●●●●●●●●●●●●●●●●●●●●●●●●●●●●●●●●●●●●●●●●●●●●●●●●●●●●●●●●●●●●●●●●●●●●●●●●●●● 1 2 5 10 20 50 100 200 500 1e−04 1e−03 1e−02 1e−01 1e+00 Outdegree Cum ulativ e Frequency ● ● ● ● ● ● ● ● ● ● ● ●● ●● ●● ●●●●●●●●●●●●●●●●●●●●●●●●●●●●●●●●●●●●●●●●●●●●●●●●●●●●●●●●●●●●●●●●●●●●●●●●●●●●●●●●●●●●●●●●●●●●●●●●●●●●●●●●●●●●●●●●●●●●●●●●●●●●●●●●●●●●●●●●●●●●●●●●●●●●●●●●●●●●●●●●●●●●●●●●●●●●●●●●●●●●●●●●● ●●●●●●● ●●●●●●●●●●●●●●●●●●●●●●●●●●●●●●●●●●●●●●●●●●●●●●●●●●●● ●●●●●●● ●● ●●●●●●●●●●●●●●●●●●●●●●●●●●● ●●●●●●●●●●●●●●●●●●●●●●●●●●●●●● ●●●●●●●●●●●●●●●●●●●●●●●●●●●●●●●●●● ●● ●●●●●●● ●●●●●●●●●●● ●●●●●●●●●●●●●●●●●●●●●●●●●●●●●●●●●●●●●●●●●●●●●●●●●●●●●●●●●●●●●●●●●●●●●●●●●●●●●●●●●●●●●●●●●●●●●●●●●●●●●●●●●●●●●●●●●●●●●●●●●●●●●●●●●●● ●●●●●●●●●●●●●●●●●●●●●●●●●●●●●●●●●●●●●●●● ●●●●●●●●●●●●●●●●●●●●●●●●●●●●●●●●●●● ●●●●●●●●●●●●●●●●●●●●●●●●●●●●●●●●●●●●●●●●●●●●●●●●●●●●●●●●●●●●●●●●●●●●●●●●●●●●●●●●●●●●●●●●●●●●●●●●●●●●●●●●●●●●●●●●●●●●●●●●●●●●●●●●●●●●●●●●●●●●●●●●●●●●●●●●●●● ●●●●●●●●●●●●●●●●●●●●●●●●●●●●●●●●●●●●●●●●●●●●●●●●●●●●●●●●●●●●●●●●●●●●●●●●●●●●●●●●●●●●●●●●●●●●●●●●●●●●●●●●●●●●●●●●●●●●●●●●●●●●●●●●●●●●●●●●●●●●●●●●●●●●●●●●●●●●●●●●●●●●●●●●●●●●●●●●●●●●●●●●●●●●●●●●●●●●●●●●●●●●●●●●●● 1 5 10 50 100 500 1000 1e−04 1e−03 1e−02 1e−01 1e+00 Degree Cum ulativ e Frequency
Fig. 3. In-/Out-/Total-Degree distribution with fitted power law
can be attributed to the sector government, seems to have an influence on the profits these respective agents are able to derive from trading on the emission market.
5
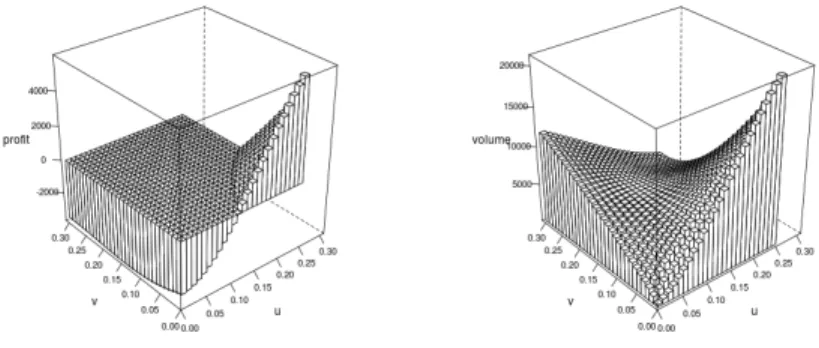
Network position, trading volume and profits
To further investigate the connection between the position of an individual com-pany within the network and its market participation (trade volume) on the one hand and its ability to derive profits from the market on the other hand we fol-low Boyd et al. [16] in computing more sophisticated individual coreness values than the k-core (cliquishness) measure which was used above. Boyd et al. [16] show that a singular value decomposition (SVD) of the adjacency matrix com-bined with a prior imputation of missing values on the diagonal represents a fast and reliable method to compute the out- (u) and in-coreness (v) of individual
0 2 4 0.00 0.25 0.50 0.75 1.00 Indegree Density type CDM finance foundation government industry
Distribution of in−degree by type
0 5 10 15 0.00 0.25 0.50 0.75 1.00 Outdegree Density type CDM finance foundation government industry
Distribution of out−degree by type
0.0 0.5 1.0 1.5 −0.5 0.0 0.5 1.0 1.5 Eigenvector−centralitys Density type CDM finance foundation government industry
Distribution of eigenvector−centrality by type
0 50 100
−0.2 −0.1 0.0 0.1 0.2
Profits in million Euros
Density type CDM finance foundation government industry
Distribution of profits by type
Fig. 4. Densities plots for various trade network statistics and company types in the ETS
agents within a large graph. The coreness of an agent is high, if an agent is well connected with other well connected agents. The SVD is methodologically and in terms of interpretation similar to the eigenvector centrality discussed above. The so computed coreness values as well as information about agents profits and volumes traded in the market were then used in combination with interpola-tion by means of local polynomial regression fitting to create the elevainterpola-tion plots displayed in Figure 5.
Looking at the plot on the left-hand side in Figure 5 it appears as the ability to generate profits on the ETS positively depends on the out-coreness of an individual. The market participation on the other hand depends positively on both the in- and out-coreness of an agent. As far as the in-coreness is concerned this effect seems to be slightly weaker.
Fig. 5. Elevation plots of out- (u) and in- (v) coreness values with respect to the gener-ated profits (left) and market participation (total volume traded) (right) of individual agents
6
Network formation
The results from the last two sections can be interpreted as some kind of infor-mational asymmetry in the market. OHAs which are legally forced to participate in the emission market and are seeking to buy and sell emission certificates re-sort to local networks (firms from the same parent company, country, industry etc.) or to huge financial players which form the center of the trading network. This undermines the central idea of the emission market to take advantage of differentials in abatement costs. This interpretation is further supported when we take a closer look at the network formation process.
A basic method within this class of approaches to investigate the formation process of a network is the Maslov-Sneppen [17] algorithm: comparing the em-pirical network with a quantity of random networks with the identical degree sequence and distribution allows us to generate degree-degree correlation pro-files which permit to identify connectivity patterns between nodes of different degrees. The so called null-model is generated by systematically rewiring the original network. Two pairs of connected nodes A− > B and C− > D are randomly selected from a network and rewired in the fashion A− > D and C− > B. If the thereby generated new connections already exist the proce-dure is aborted and two new pairs of connected nodes are selected and the rewiring attempt is repeated. Doing this sufficiently often, a rule of thumb suggests a number as high as ten times the number of edges, one obtains a random model with the same degree sequence and distribution as the origi-nal graph. This procedure is repeated multiple times. Then the generated null-models are compared with the original network. More precisely, we compare
the number of edges between two nodes with degrees K1 and K2 in the
pirical network N (K1, K2) and the mean in the generated random networks ¯
Nr(K1, K2):R(K1, K2) = N (K1, K2)/ ¯Nr(K1, K2). Whether the deviance of the
empirical network from the null-model is significant can be assessed by
comput-ing the Z-scores: Z(K1, K2) = (N (K1, K2)− ¯Nr(K1, K2))/sigma(K1, K2), where
sigma(K1, K2) is the standard deviation of ¯Nr(K1, K2). This method works for
directed and undirected networks. The results of the Maslov-Sneppen approach for the emission trading network are presented in Figure 6.
Fig. 6. Degree-degree correlation profiles generated by the Maslov-Sneppen algorithm
The interpretation of the degree-degree correlation profiles is twofold: 1) When interpreting the emission trading network as an undirected graph one recognizes a compared to the null model significantly increased connectedness between highly connected nodes (the red area in the upper right corner of the LHS plot). 2) In both the undirected and the directed case (RHS) we note a sig-nificantly increased degree of asymmetric connectedness, i.e. between low- and high degree nodes (the orange to red area along the axes). This is in line with the results of a strong core-periphery structure presented earlier in the paper.
A bit more involved but based on a similar idea is the class of Exponential Random Graph models (ERGM). A random graph Y is made up by a set of n
nodes and e edges {Yij : i = 1, . . . , n; j = 1, . . . , n} where, similar to a binary
the case. One can thus model the given network by
P (Y = y|θ) = exp(θ
Tg(y))
c(θ)
where θ and g(y) are vectors of parameters and network statistics respectively
and c(θ) =P exp{θtg(y)} is a normalizing constant corresponding to all
possi-ble networks. Evaluating above expression (as the number of possipossi-ble outcomes vastly exceeds the number of constraining parameters this is usually done by Gibbs sampling) allows us to make assertions whether and how certain nodal attributes influence the network formation process. These nodal attributes can be endogenous to the network (like the in- and out-degrees of a node) or exoge-nous as in the context of the trading network for example the country in which a specific company is registered.[18]
Dependent variable: carbon network edges −4.785∗∗∗ (0.172) triangle 0.321∗∗∗ (0.026) asymmetric −3.711∗∗∗ (0.166) nodematch.type −0.099∗∗∗ (0.019) nodematch.country 0.392∗∗∗ (0.031) nodematch.guo 0.757∗∗∗ (0.285)
Akaike Inf. Crit. 527,052.300
Bayesian Inf. Crit. 527,150.300
Note: ∗p<0.1;∗∗p<0.05;∗∗∗p<0.01
Table 1. A simple ERGM model applied to the ETS network
We ran a basic ERGM model over the emission trading network. The re-sults are presented in Table 1. The most important features of the rere-sults are as follows: We observe positive log-odds for the closing of triangles (clusters), homophily for country and general ultimate owner (GUO)respectively. We how-ever remark negative log-odds for the formation of ties between agents of the same type (i.e. OHA vs PHA). We thus see what we already observed graphi-cally earlier in the paper: OHAs who seek to sell or buy EUAs have to address themselves to local networks (homophily as far as origin [country] and owner-ship [GUO] is concerned) or to financial institutions or brokers (heterophily with regard to type).
7
Conclusion
The EU ETS network is characterized by a significant core-periphery structure which is also reflected in an asymmetry within the degree-degree correlation profiles computed by the Maslov-Sneppen algorithm. This has effects on the profits agents are able to derive from the market and their market participation in general. An ERGM analysis shows that OHAs have to resort to local networks or financial intermediaries when they want to participate in the market. This might be due to the fact that the EU ETS is not organized in a central market place but based to a large extent (for the time the data was available) on OTC transactions. This in our opinion violates the central idea of exploiting differences in marginal abatement costs, imposes unnecessary additional costs on the OHAs who often don’t possess the resources to collect informations about the market and thus undermines the goal of the EU ETS.
Acknowledgments
The authors acknowledge the support of the EU FP7 FET project SIMPOL.
References
1. United Nations: United Nations Framework on Climate Change. https: //unfccc.int/files/essential_background/background_publications_ htmlpdf/application/pdf/conveng.pdf (1992)
2. United Nations: Kyoto Protocol to the United Nations Framework Convention on Climate Change. http://unfccc.int/resource/docs/convkp/kpeng.pdf (1998) 3. European Council: 94/69/EC: Council Decision of 15 December 1993 concerning the
conclusion of the United Nations Framework Convention on Climate Change. http: //eur-lex.europa.eu/legal-content/EN/TXT/?uri=CELEX:31994D0069 (1993) 4. Ellerman, D., Buchner, B.: The European Union emissions trading scheme: origins,
allocation, and early results. Review of environmental economics and policy, 1(1), 66–87 (2007)
5. Schreurs, M. and Tiberghien, Y.: Multi-level reinforcement: explaining European Union leadership in climate change mitigation. Global Environmental Politics 7(4), 19–46 (2007)
6. UNEP Risoe Centre: JI & CDM projects. http://www.cdmpipeline.org/ (1998) 7. Ellerman, D., Decaux, A.: Analysis of post-Kyoto CO2 emissions trading using
marginal abatement curves. MIT Joint Program on the Science and Policy of Global Change (1998)
8. Ellerman, A.: Pricing carbon: the European Union emissions trading scheme. Cam-bridge University Press (2010)
9. European Parliament: Directive 2003/87/EC of the European Parliament and the Council of 13 October 2003 establishing a scheme for greenhouse gas emission allowance trading within the Community and amending Council Di-rective 96/61/EC.http://eur-lex.europa.eu/legal-content/EN/TXT/PDF/?uri= CELEX:02003L0087-20090625&from=EN (2003)
10. European Council: 2106th Council meeting ENVIRONMENT Luxembourg, 16-17 June 1998. http://europa.eu/rapid/press-release_PRES-98-205_en.pdf (1998) 11. Ellerman, A., Joskow, P.: The European Union’s emissions trading system in
per-spective. Pew Center on Global Climate Change Arlington (2008)
12. Jaraite, J., Jong, T., Kazukauskas, A., Zaklan, A., Zeitlberger, A.: Ownership Links and Enhanced EUTL Dataset. European University Institute, Florence. http: //fsr.eui.eu/CPRU/EUTLTransactionData.aspx (2013)
13. Li, D. and Sch¨urhoff, N.: Dealer networks. SSRN paper 2023201 (2014)
14. Freeman, L.C.: Centrality in Social Networks I: Conceptual Clarification, Social Networks, 1, 215–239 (1979)
15. Seidman, S.: Network structure and minimum degree. Social networks, 5, 269–287 (1983)
16. Boyd, P., et al.: Computing continuous core/periphery structures for social rela-tions data with MINRES/SVD. Social Networks, 32, 125–137 (2010)
17. Maslov, S., Sneppen, K.: Specificity and stability in topology of protein networks. Science, 296, 910–913 (2002)
18. Butts, C. et al.: Introduction to Exponential-family Random Graph (ERG or p*) modeling with ergm. http://cran.r-project.org/web/packages/ergm/ vignettes/ergm.pdf (2014)
![Fig. 1. The CO2 trading network [CDM (green), finance (red), foundation (yellow), government (orange), industry (blue)]](https://thumb-eu.123doks.com/thumbv2/123doknet/13203032.392730/7.918.365.591.235.449/trading-network-finance-foundation-yellow-government-orange-industry.webp)