HAL Id: hal-02620702
https://hal.inrae.fr/hal-02620702
Submitted on 22 Oct 2020HAL is a multi-disciplinary open access archive for the deposit and dissemination of sci-entific research documents, whether they are pub-lished or not. The documents may come from teaching and research institutions in France or
L’archive ouverte pluridisciplinaire HAL, est destinée au dépôt et à la diffusion de documents scientifiques de niveau recherche, publiés ou non, émanant des établissements d’enseignement et de recherche français ou étrangers, des laboratoires
Actin filaments regulate microtubule growth at
the centrosome
Daisuke Inoue, Dorian Obino, Judith Pineau, Francesca Farina, Jeremie
Gaillard, Christophe Guérin, Laurent Blanchoin, Ana-maria Lennon-duménil,
Manuel Thery
To cite this version:
Daisuke Inoue, Dorian Obino, Judith Pineau, Francesca Farina, Jeremie Gaillard, et al.. Actin fila-ments regulate microtubule growth at the centrosome. EMBO Journal, EMBO Press, 2019, 38 (11), �10.15252/embj.201899630�. �hal-02620702�
Actin filaments regulate microtubule growth at the centrosome.
Daisuke Inoue1,+, Dorian Obino2,+,†, Judith Pineau2, Francesca Farina1, Jérémie Gaillard1,3, Christophe Guerin1,3, Laurent Blanchoin1,3*, Ana-Maria Lennon-Duménil2* and Manuel Théry1,3*
1- Univ. Grenoble-Alpes, CEA, CNRS, INRA, Biosciences & Biotechnology Institute of Grenoble, UMR5168, CytoMorpho Lab, 38054 Grenoble, France.
2- INSERM, U932 Immunité et Cancer, Institut Curie, PSL Research University, 75005 Paris, France.
3- Univ. Paris Diderot, INSERM, CEA, Hôpital Saint Louis, Institut Universitaire d’Hematologie, UMRS1160, CytoMorpho Lab, 75010 Paris, France.
+: these authors contributed equally to this work
†: present address: Pathogenesis of Vascular Infections Unit, INSERM, Institut Pasteur, 75015 Paris, France.
*: correspondence should be sent to: [email protected], [email protected], [email protected]
Abstract (158 words)
The centrosome is the main microtubule-organizing centre. It also organizes a local network of actin filaments. However, the precise function of the actin network at the centrosome is not well understood. Here we show that increasing densities of actin filaments at the centrosome of lymphocytes were correlated with reduced amounts of microtubules. Furthermore, lymphocyte activation resulted in centrosomal-actin disassembly and an increase in microtubule number. To further investigate the direct crosstalk between actin and microtubules at the centrosome, we performed in vitro reconstitution assays based on (i) purified centrosomes and (ii) on the co-micropatterning of microtubule seeds and actin filaments. The two assays demonstrated that actin filaments act as a physical barrier blocking nascent microtubules’ elongation. Finally, we showed that cell adhesion and spreading leads to lower densities of centrosomal actin thus resulting in higher microtubule growth. Hence we propose a novel mechanism by which the number of centrosomal microtubules is regulated by cell adhesion and actin-network architecture.
Introduction
The growth of the microtubule network and its architecture regulates cell polarisation, migration and numerous key functions in differentiated cells (de Forges et al, 2012; Sanchez & Feldman, 2016; Mimori-Kiyosue, 2011; Etienne-Manneville, 2013). Microtubule growth first depends on microtubule nucleation, which is regulated by large complexes serving as microtubule templates and proteins that stabilize early protofilament arrangements (Roostalu & Surrey, 2017; Wieczorek et al, 2015). Then, microtubule elongation becomes regulated by microtubule-associated proteins and molecular motors acting at the growing end of microtubules (Akhmanova & Steinmetz, 2015). The architecture of the microtubule network - the spatial distribution and orientation of microtubules - is heavily influenced by its biochemical interactions and physical interplay with actin filaments (Rodriguez et al, 2003; Coles & Bradke, 2015; Huber et al, 2015; Colin et al, 2018; Dogterom & Koenderink, 2018). Although the physical crosslinking of the two networks can occur at any points along microtubule length (Mohan & John, 2015), the sites of intensive crosstalk occur at the growing ends of microtubules (Akhmanova & Steinmetz, 2015; Dogterom & Koenderink, 2018).
The growth of microtubules can also be directed by actin-based structures (Théry et al, 2006; López et al, 2014; Kaverina et al, 1998). They can force the alignment of microtubules (Elie et al, 2015), resist their progression (Burnette et al, 2007), capture, bundle or stabilise them (Zhou et al, 2002; Hutchins & Wray, 2014), submit them to mechanical forces (Gupton
et al, 2002; Fakhri et al, 2014; Robison et al, 2016) or define the limits in space into which
they are confined (Katrukha et al, 2017). The actin-microtubule interplay mostly takes place at the cell periphery, because most actin filaments are nucleated at and reorganized into actin-based structures near the plasma membrane (Blanchoin et al, 2014). We recently have identified a subset of actin filaments that form at the centrosome at the cell centre (Farina et
al, 2016). The centrosome is the main microtubule nucleating and organizing centre of the
cell and sustains the highest concentration of microtubules in the cell. Centrosomal-actin filaments have been shown to be involved in several function including centrosome anchoring to the nucleus (Obino et al, 2016), centrosome separation in mitosis (Au et al, 2017) and ciliary-vesicle transport in the early stages of ciliogenesis (Wu et al, 2018). Whether centrosomal-actin filaments affect centrosomal microtubules is not yet known.
Here we investigated how the processes of actin and microtubule growth at the centrosome influence each other. We provide in vivo and in vitro evidence that centrosomal
actin network blocks microtubule growth, most likely as a result of physical hindrance. Our results further suggest that the regulation by the centrosomal actin filaments restricts microtubule growth in response to cell adhesion.
Results
The centrosomal-actin network appears to negatively regulate the microtubule network in B lymphocytes
B-lymphocyte polarization can be achieved by B-cell receptor (BCR) activation from binding surface-tethered cognate antigens, and requires the local reduction of centrosomal actin density (Obino et al, 2016). To evaluate how microtubules were affected in resting and activated B lymphocytes, we examined by fluorescent microscopy of fixed cells, microtubule density throughout the cell in comparison with changes to the density of centrosomal actin filaments (Fig 1A). As expected, B lymphocyte activation was associated with a lower density (by 30%) of actin at the centrosome (Obino et al, 2016). It appeared to be also associated with a higher density (by 20%) of microtubules at the centrosome and in the entire cytoplasm (Fig 1B, C). A closer analysis by single cells showed a clear negative correlation between centrosomal-actin density and microtubules density in resting (r=−0.44) and activated lymphocytes (r=−0.34) (Fig 1D), suggesting that the interplay between the two networks is not specific to the activation but an intrinsic relationship. Noteworthy, the amount of cortical actin did not vary during the activation (Fig EV1A), and the amount of cortical actin could not be correlated to the amount of microtubules in single cells (Fig EV1B,C), reinforcing the hypothesis of an early regulation at the centrosome. The labelling of actin filaments and microtubules in rest cells revealed the presence at the centrosome of dense actin puncta, from which microtubule were excluded, suggesting they act as physical barrier through which microtubule can not grow (Fig 1E).
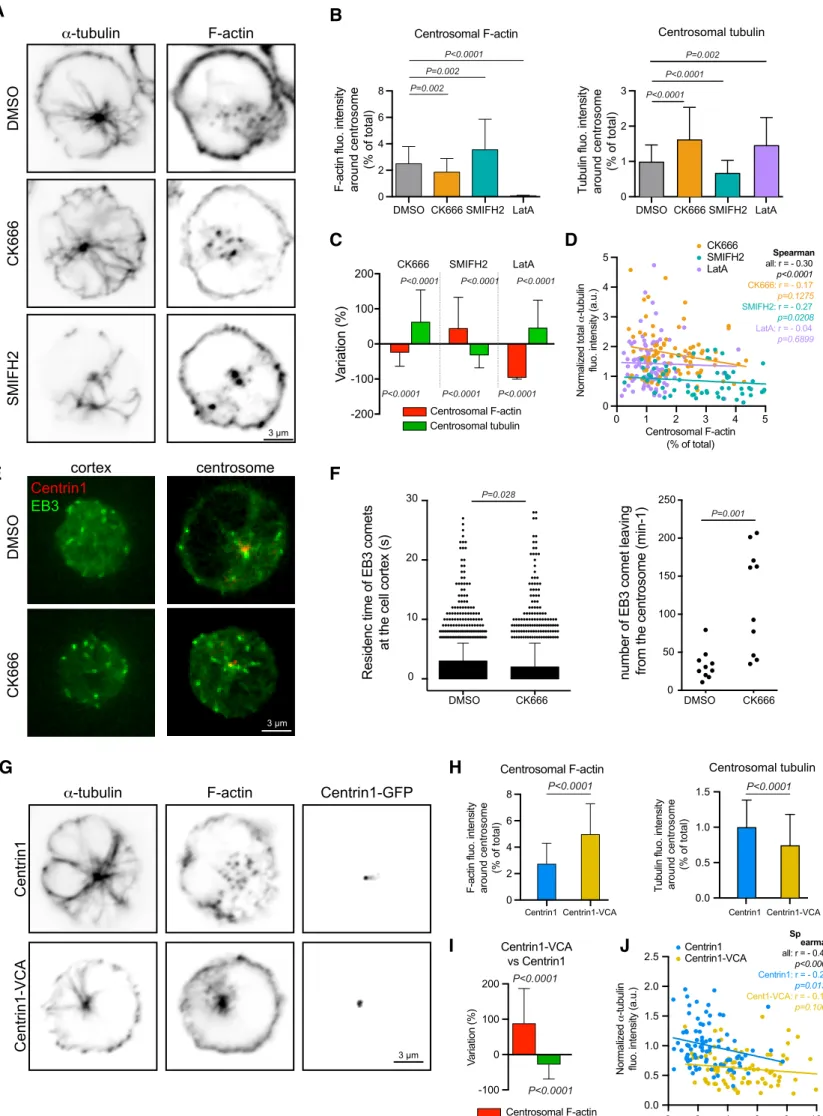
To test the hypothesis that the density of centrosomal actin is driving the reduction in microtubule density, B lymphocytes were treated with actin-filament inhibitors (Fig 2A). Treatment with the actin polymerization inhibitors (Arp2/3 inhibitor CK666) or latrunculin A reduced the centrosomal actin density and increased the microtubule density at the centrosome (Fig 2 B,C) and throughout the cell (Fig EV2A), thus supporting the hypothesis. Conversely, treatment with the formin inhibitor SMIFH2, increased centrosomal actin density, by an unknown mechanism possibly related to the actin homeostasis supporting
when formin is inhibited (Suarez & Kovar, 2016). This increase of centrosomal actin led to a marginally decreased microtubule density at the centrosome and throughout the cell (Fig 2B, C and EV2A), thus confirming the negative relationship between the two networks. Overall, the analysis of individual cells showed a negative correlation between centrosomal actin filaments and microtubules. The inhibition of formin and Arp2/3 induced higher and lower actin densities at the centrosome, respectively, and thus expanded the range in which the negative correlation could be observed (Fig 2D).
Noteworthy, local perturbations to the actin network could have affected other actin networks in the same cell by a process of actin-network homeostasis that operates throughout the cell (Burke et al, 2014; Suarez & Kovar, 2016; Suarez et al, 2014). Therefore, an increase in actin density at the centrosome could have been offset by a corresponding decrease in actin density elsewhere in the cell (e.g. in cytoplasmic and cortical networks). To evaluate this effect, we measured the impact of CK666 on the growth of microtubules at the centrosome and along the cortex by quantifying the dynamics of EB3-mCherry, which labbeled microtubule plus ends (Fig 2E, Movie EV1). We found no major difference in the residency time of EB3 comets, and therefore in the microtubule growth, at the cortex (Fig 2F) suggesting that the changes in the cortical actin induced by Arp2/3 inhibition were not responsible for the overall increase of microtubule number. By contrast, treatment with CK666 significantly increased the number of microtubules growing out of the centrosome (Fig 2F), confirming the involvement of centrosomal actin in this regulation.
To assess more directly the role of centrosomal actin filaments, we next examined B-lymphocytes which expressed a fusion protein (centrin1-VCA-GFP; (Obino et al, 2016)) that promotes actin filament nucleation at the centrosome specifically (Fig 2G). Hence the expression of centrin1-VCA-GFP strongly increased the density of centrosomal-actin filaments and decreased the microtubule density at the centrosome and throughout the cell demonstrating the specific role of actin filaments at the centrosome in the negative regulation of the microtubule network (Fig 2H, I, J, and EV2B).
The centrosomal-actin network perturbs the elaboration of the microtubule network in vitro
A limitation to the interpretation of the B-lymphocyte experiments was that on top of the influence of subcellular actin networks on each other, actin and microtubule networks share numerous signaling pathways (Dogterom & Koenderink, 2018). It was therefore not possible to distinguish purely sterical effects at the centrosome from the modulation of
cross-signalling pathways. To circumvent this limitation, we used an in vitro model that reconstituted actin and microtubule networks from actin monomers and tubulin dimers incubated in the presence of a centrosome labelled with centrin1-GFP. In this model and as expected (Farina et al, 2016), 25% of the centrosomes (i.e. centrin1-GFP positive puncta) were associated with actin and microtubule networks (Fig 3A). Among those centrosomes, the actin density per centrosome was negatively correlated with the number of microtubules per centrosome (Fig 3B). Actin-filament density at the centrosome was then altered by incubating centrosomes in different concentrations of free actin monomers, with the tubulin monomer concentration kept constant (Fig 3C). Consistent with the hypothesis, higher actin concentrations were associated with lower microtubule numbers per chromosome (Fig 3D). Moreover, the highest actin concentration almost completely inhibited microtubule growth (Fig 3D). These changes were not due to the interference of dense actin networks with microtubule growth rate, which did not seem to depend on the density of actin network (Fig 3E). They were neither due to the removal of microtubule nucleation complexes from the centrosome since the intensity of gamma-tubulin staining appeared independent on the presence of actin filaments (Fig 3F). These results from the in vitro experiments rather suggest that actin filaments perturb the early stages of microtubule elongation at the centrosome. Therefore it is plausible that in the B lymphocyte experiments, the centrosomal-actin network had direct and antagonistic effects on the microtubule network emanating from the centrosome.
To further explore the dynamics of the interaction between the centrosomal-actin network and the microtubule network, the in vitro model was manipulated by sequential addition of the network components. By incubating with tubulin dimers first, microtubules formed in the absence of actin filaments (Fig 4A, B). When actin monomers were introduced afterwards (together with tubulin dimers to maintain the tubulin-dimer concentration), the number of microtubules increased on all centrosomes, irrespective of whether the centrosomes triggered the formation of actin filaments or not (Fig 4C). An explanation for this unexpected observation was that the addition of new tubulin dimers increased the effective concentration of free tubulins. Furthermore, not all centrosomes were capable of nucleating actin filaments, and there was no difference in the microtubule numbers per centrosome between those centrosomes with and those without actin filaments (Fig 4C). This suggested that in this model, the stability of preassembled microtubules may not be sensitive to actin filaments that form at the microtubule ends proximal to the centrosome, and newly
created from depolymerized microtubules.
In a second experiment, tubulin dimers were initially added to quantify the number of microtubules per centrosome and in effect, to select those centrosomes with the capability to nucleate microtubules. The tubulin dimers and microtubules were then removed by rinsing the centrosomes in buffer. Actin monomers were then added, followed by tubulin dimers again (Fig 4D, E and F). For those centrosomes devoid of actin filaments, the microtubule number was not significantly different between the initial and final stages of the experiment (Fig 4F). By contrast, for centrosomes which nucleated actin filaments, the microtubule number was significantly reduced at the final stage compared to the initial stage (Fig 4F). This effect was not due to actin filaments impact on the centrosome itself since the number of microtubule was not reduced if actin filaments were disassembled prior to microtubule regrowth (Fig EV3). These experiments confirmed that microtubule regrowth was impaired in the presence of pre-existing actin filaments.
Actin filaments block microtubule growth in a biochemical model
In the above in vitro model, only 25% of the isolated centrosomes had the capability of nucleating microtubules, reflecting the difficulties in centrosome purification. Despite the optimisation steps to improve the quality of the centriole (Gogendeau et al, 2015), the isolation step results in centrosome with more or less fragmented peri-centriolar material. As a consequence, the investigation of their nucleation capacities was informative but intrinsically biased. Therefore, to directly test steric competition between actin and microtubules during the first stages of microtubule growth, we combined two distinct biochemical assays in which short microtubule seeds and actin nucleators were grafted onto the same microfabricated spot on a planar surface in vitro (Portran et al, 2013; Reymann et al, 2010) (Fig 5A).
In the biochemical model, the addition of free tubulin dimers and actin monomers led to the growth of both actin filaments and microtubules from each micropattern (Fig 5B). As with the in vitro model above, the micropattern were treated according to the following sequence: tubulin-dimer incubation, microtubule count; wash; actin-monomer incubation; and tubulin-dimer incubation (Fig 5C). The model showed again that microtubule formation was perturbed by the presence of actin filaments (Fig 5D). Interestingly, the addition of gelsolin to promote the disassembly of the actin filaments overcame the perturbation, indicating that the nucleation of actin filaments did not detach microtubule seeds (Fig EV4) but blocked their elongation (Fig5C-D). Moreover, the relative density of actin was negatively correlated with
microtubule numbers (Fig 5E). Therefore, given the absence of signalling pathways or cross-linking proteins, the actin filaments physically blocked microtubule growth, and the denser the actin network, the stronger the barrier.
Actin filament density at the centrosome is negatively affected by the degree of cell spreading
The experiments above supported the model in which actin filaments perturb the formation of microtubules at the centrosome by forming a physical barrier. This led us to investigate how actin density at the centrosome is regulated in living cells. We have previously shown that with B-lymphocyte forming an immune synapse with antigen presenting cells actin nucleation is decreased at the centrosome (Obino et al, 2016). Because immune synapses are enriched for actin and adhesion molecules such as integrins (Carrasco et
al, 2004; Bretou et al, 2016), we hypothesized that the actin-filament density at the
centrosome is inversely related to the degree of cell adhesion and spreading because actin nucleating structures compete for available actin monomers in the cell (Suarez & Kovar, 2016). Hence, minimal cell spreading permits a high amount of actin filaments to form at the centrosome thus perturbing microtubule growth, whereas extensive cell spreading sequesters most of the available actin monomers, reducing the number of actin filaments at the centrosome and thus favouring microtubule growth (Fig 6A).
For highly adherent RPE1 cells, three states of cell spreading (low, medium and high) were dictated by the degree of substrate adhesiveness (by tuning fibronectin concentration in PEG; Fig 6B). For low-adherent B-lymphocytes, three states of cell adhesion and spreading were dictated by plating on poly-lysine, fibronectin and ICAM-1 (Carrasco et al, 2004) (Fig 6C). For both cell types, the degree of cell adhesion and/or spreading (i.e. the area occupied by the cell on the substrate) was negatively correlated with centrosomal-actin density and positively correlated with the density of the microtubule network at the centrosome and throughout the cell (Fig 6D, E). Although these results do not indicate the exact mechanism by which cell spreading modulates the amount of microtubules, and notably do not exclude the possibility that microtubules were stabilised by contact with focal adhesions (Byron et al, 2015; Bouchet et al, 2016), they support a model in which microtubule growth from the centrosome is modulated by the adhesion state of the cell via the degree to which actin filaments are prevented from forming at the centrosome.
Discussion
Actin is the most abundant protein in the cytoplasm and as such has long been considered as a major contaminant of centrosome proteomics studies (Bornens & Moudjou, 1999; Andersen et al, 2003). However, actin filaments have been directly observed at the poles of mitotic spindles (Stevenson et al, 2001; Chodagam et al, 2005) and at the centrosome of several cell types in interphase (Farina et al, 2016; Obino et al, 2016; Au et al, 2017). Centrosomal-actin filaments have been shown to anchor the centrosome the nucleus (Bornens, 1977; Burakov & Nadezhdina, 2013; Obino et al, 2016), support the transport of vesicles during ciliogenesis (Assis et al, 2017; Wu et al, 2018), connect basal bodies to the actin cortex in ciliated cells (Antoniades et al, 2014; Pan et al, 2007; Walentek et al, 2016; Mahuzier et al, 2018) and power centrosome splitting in prophase (Uzbekov et al, 2002; Wang et al, 2008; Au et al, 2017).
The results of our study identify a new function for actin filaments at the centrosome. We propose a model in which these centrosomal actin filaments provide a conduit through which changes to actin networks at the cell periphery modulate the formation and growth of microtubules emanating from the centrosome. The centrosomal-actin filaments primarily perturb the formation of microtubules by physically blocking the early stages of their elongation. Although we can not exclude that other mechanisms, such as shared signalling pathways or competition for common ressources, support the negative impact of centrosomal actin filaments on microtubules in cells, we favoured the interpretation based on the role of physical constraints since they exist in cells and were proven to be capable to block microtubule growth in our in vitro assays. But these physical constraints may not be only mechanism co-regulating the two networks at the centrosome. Noteworthy, these results add to pre-existing body of evidences showing that physical constraints imposed by actin filaments (Huber et al, 2015) can limit microtubule growth (Colin et al, 2018), microtubule’s shape fluctuations (Katrukha et al, 2017; Brangwynne et al, 2006) and centrosome displacement (Piel et al, 2000). Interestingly, by constrast with previous descriptions of physical barrier blocking microtubule growth locally (Colin et al, 2018; Katrukha et al, 2017) our observations show that centrosomal actin filaments, by preventing microtubule growth at the organizing center, regulate the entire microtubule network throughout the cell.
Our results expand the description of cytoskeleton changes during B-lymphocyte activation (Obino et al, 2016) and show that centrosomal-actin filament disassembly promotes the growth of microtubules. Interestingly, the increase in microtubules may contribute to B
cell polarization, a hallmark of their activation (Yuseff et al, 2011), by promoting centrosome off-centring. Indeed, a high quantity of microtubules can break network symmetry and force centrosome off-centring and its displacement to the cell periphery through the reorientation of pushing forces produced at the centrosome by microtubule growth (Letort et al, 2016; Burute
et al, 2017; Pitaval et al, 2016). Therefore, centrosomal-actin filament disassembly could be
involved in both the disengagement of the centrosome from the nucleus (Obino et al, 2016) and in the stimulation and reorganisation of microtubule-based pushing forces to drive centrosome motion toward the cell periphery.
The regulation of microtubule growth at the cell centre complements those mechanisms that regulate microtubule stability at the cell periphery, where microtubule stability is promoted by cell adhesions and their associated actin networks (Akhmanova & Steinmetz, 2015; Byron et al, 2015; Bouchet et al, 2016). Those mechanisms ensure a form of regulation that can bias microtubule network organisation locally (Gundersen et al, 2004; Etienne-Manneville, 2013). At the cell centre, the actin network can adapt the entire microtubule network to cell shape, cell adhesion and cell spreading (Fig 6A). An explanation for this is that cell adhesion and spreading triggers the elaboration of actin networks at the cortex, hence reducing the pool of available actin monomers, and potentially sequestering from the centrosome actin-filament nucleation and branching factors such as Arp2/3 and WASH (Suarez & Kovar, 2016; Obino et al, 2016; Farina et al, 2016). The reduction in the centrosomal-actin network thus allows more microtubules to be nucleated at the centrosome. The interplay at the centrosome between actin filaments and microtubules in response to cell spreading may have important implications for the ability of the cell to sense and adapt to external cues.
Materials and Methods
Cell culture and chemical treatments
Stable Jurkat cell lines expressing centrin1-GFP (Farina et al, 2016) were cultured in RPMI 1640, (Gibco). Cells were not sorted based on GFP fluorescence. The mouse B lymphoma cell line IIA1.6 (derived from the A20 cell line (American Type Culture Collection #: TIB-208)) was cultured as reported (Obino et al, 2016) in CLICK medium (RPMI1640— GlutaMax-I), supplemented with 0.1% -mercaptoethanol and 2% sodium pyruvate. Both cell lines were tested for mycoplasma infection. The RPE1 cell line stably expressing centrin1-GFP (Farina et al, 2016) was cultured in DMEM/F-12. All media were supplemented with 10% fetal calf serum and penicillin/streptomycin. Cells were cultured at 37ºC and 5% CO2.
All cell lines were tested monthly for mycoplasma contamination.
Two millions of IIA1.6 cells were electroporated with 2ug of EB3-mcherry plasmid and 2ug Centrin-GFP plasmid using the Amaxa Cell Line Nucleofactor Kit R (T-016 programme, Lonza). Cells were incubated in CLICK medium for 8-12 h before analysis.
Cytoskeleton inhibitors (CK666 at 25 µM, SMIFH2 at 25µM; Latrunculin-A at 5µM; all from Tocris Bioscience) were added in the cell medium for 45 minutes at 37 ºC.
For the coating of glass coverslips; fibronectin (Sigma Aldrich) was used at 10 µg/ml and PLL-PEG (JenKem Technologies, Texas) at 10 µg/ml in Hepes 10 mM, Poly-L-Lysine (Invitrogen) was used at 10 µg/mL, and ICAM-1 (R&D System) was used at 10 µg/mL.
Preparation of BCR-ligand-coated beads.
Latex NH2-beads 3 µm in diameter (Polyscience) were coated with 8% glutaraldehyde
(Sigma Aldrich) for 2 h at room temperature (4x10⁷ beads/ml). Beads were washed with PBS and incubated overnight at 4°C with 100 µg/ml of either F(ab’)2 goat anti-mouse IgG
(BCR-ligand+ beads) or F(ab’)2 goat anti-mouse IgM (BCR-ligand− beads; MP Biomedical). Cell fixation and immuno-staining.
Cells were extracted by incubation for 15 sec with cold Cytoskeleton buffer (10 mM MES pH6.1, 138 mM KCl, 3 mM MgCl2, 2 mM EGTA) supplemented with 0.5% Triton
X-100 and fixed with Cytoskeleton buffer supplemented with 0.5% glutaraldehyde for 10 min at room temperature. Glutaraldehyde was reduced with 0.1% sodium borohydride (NaBH4) in
1x PBS for 7 min and unspecific binding sites were saturated using a solution of 1x PBS supplemented with 2% BSA and 0.1% Triton X-100 for 10 min. The following primary
antibodies were used: monoclonal rat anti--tubulin (AbD Serotec, Clone YL1/2, 1/1000) and human anti-green fluorescent protein (GFP) (Recombinant Antibody Platform, Institut Curie, Paris, France, 1/200). The following secondary antibodies were used: AlexaFluor647-conjugated F(ab’)2 donkey anti-rat and AlexaFluor488-conjugated donkey anti-human (Life
Technologies, both 1/200). F-actin was stained using AlexaFluor546-conjugated phalloidin (Life Technologies, #A22283, 1/100).
Isolation of centrosomes.
Centrosomes were isolated from Jurkat cells by modifying a previously published protocol (Moudjou & Bornens, 1998; Gogendeau et al, 2015).In brief, cells were treated with nocodazole (0.2 μM) and cytochalasin D (1 μg/ml) followed by hypotonic lysis. Centrosomes were collected by centrifugation onto a 60% sucrose cushion and further purified by centrifugation through a discontinuous (70%, 50% and 40%) sucrose gradient. The composition of the sucrose solutions was based on a TicTac buffer, in which the activity of tubulin, actin and actin-binding proteins is maintained: 10 mM Hepes, 16 mM Pipes (pH 6.8), 50 mM KCl, 5 mM MgCl2, 1 mM EGTA. The TicTac buffer was supplemented with 0.1%
Triton X-100 and 0.1% β-mercaptoethanol. After centrifugation on the sucrose gradient, supernatant was removed until only about 5 ml remained in the bottom of the tube. Centrosomes were stored at -80 ºC after flash freezing in liquid nitrogen.
Protein expression and purification.
Tubulin was purified from fresh bovine brain by three cycles of temperature-dependent assembly/disassembly in Brinkley Buffer 80 (BRB80 buffer: 80 mM Pipes pH 6.8, 1 mM EGTA and 1 mM MgCl2) (Shelanski, 1973). Fluorescently labelled tubulins
(ATTO-488 and ATTO-565-labelled tubulin) were prepared by following previously published method (Hyman et al, 1991).
Actin was purified from rabbit skeletal-muscle acetone powder. Monomeric Ca-ATP-actin was purified by gel-filtration chromatography on Sephacryl S-300 at 4ºC in G buffer (2 mM Tris-HCl, pH 8.0, 0.2 mM ATP, 0.1 mM CaCl2, 1 mM NaN3 and 0.5 mM dithiothreitol
(DTT)). Actin was labelled on lysines with Alexa-488 and Alexa-568. Recombinant human profilin, mouse capping protein, the Arp2/3 complex and GST-streptavidin-WAwere purified in accordance with previous methods (Michelot et al, 2007; Achard et al, 2010).
In vitro assays with isolated centrosomes.
Experiments were performed in polydimethylsiloxane (PDMS) stencils in order to add/exchange sequentially experimental solutions when needed. PDMS (Sylgard 184 kit, Dow Corning) was mixed with the curing agent (10 : 1 ratio), degassed, poured into a Petri dish to a thickness of 5 mm and cured for 2 h at 80ºC on a hot plate. The PDMS layer was cut to square shape with dimension of 10 mm x 10 mm and punched using a hole puncher (Ted Pella) with an outer diameter of 6 mm. The PDMS chamber were oxidized in an oxygen plasma cleaner for 40 s at 60W (Femto, Diener Electronic) and brought it into contact with clean coverslip (24 mm x 30 mm) via a double sided tape with 6 mm hole.
Isolated centrosomes were diluted in TicTac buffer (Farina et al, 2016) and incubated for 20 min. To remove excess of centrosomes and coating the surface of coverslips, TicTac buffer supplemented with 1% BSA was perfused into PDMS chamber, which was followed by a second rinsing step with TicTac buffer supplemented with 0.2% BSA and 0.25% w/v methylcellulose. Microtubules and actin assembly at the centrosome were induced using a reaction mixture containing tubulin dimers (labelled with ATTO-565, 18 μM final) and actin monomers (labelled with Alexa-488, 0.3 – 1.0 μM final) in TicTac buffer supplemented with 1 mM GTP and 2.7 mM ATP, 10 mM DTT, 20 μg/ml catalase, 3 mg/ml glucose, 100 μg/ml glucose oxidase and 0.25% w/v methylcellulose. In addition, a threefold molar equivalent of profilin to actin and 60 nM Arp2/3 complex were added in the reaction mixture.
Sequential microtubule and actin assembly experiments were carried out based on the aforementioned method. In brief, after assembling microtubules by adding tubulin in the reaction mixture (18 μM final) for 15 min, microtubules were removed by exchanging the reaction mixture with TicTac buffer supplemented with 0.2% BSA and 0.25% w/v methylcellulose. Subsequently, the reaction mixture of actin (1 μM final) with profilin and Arp2/3 was applied to assemble the actin aster. After 15 min incubation, the tubulin reaction mixture with actin, profilin and Arp2/3 complex was added to assemble both microtubules and actin asters together.
Micropatterning.
Micropatterning of microtubules and actin filaments were performed in accordance with previous published methods with modification (Reymann et al, 2010; Portran et al, 2013). In brief, cleaned glass coverslips were oxidized with oxygen plasma (5 min, 60 W, Femto, Diener Electronic) and incubated with poly-ethylene glycol silane (5 kDa, PLS-2011,
Creative PEGWorks, 1 mg/ml in ethanol 96.5% and 0.02% of HCl) solution for overnight incubation. PEGylated coverslips were placed on a chromium quartz photomask (Toppan Photomasks, Corbeil, France) using a vacuum holder. The mask-covered coverslips were then exposed to deep ultraviolet light (180 nm, UVO Cleaner, Jelight Company, Irvine, CA) for 5 min. The PDMS open chamber was assembled as described above. Neutravidin (0.2 mg/ml in 1 x HKEM [10 mM Hepes pH 7.5, 50 mM KCl, 5 mM MgCl2, 1 mM EGTA]) was perfused
in PDMS chamber and incubated for 15 min. The biotinylated microtubule seeds, which were prepared with 25% of fluorescent-dye-labelled tubulin and 75% biotinylated tubulin in presence of 0.5 mM of GMPCPP as previously described (Portran et al, 2013), were deposited on neutravidin-coated surface. Subsequently, 1 μM of streptavidin-WA in 1x HKEM was added into the PDMS chamber. After each step, the excess of unbound proteins was washed away using wash buffer. Microtubules and actin filaments were assembled according to the above protocol (see In vitro assays), except that 120 nM of Arp2/3 complex was used instead of 60 nM. To disassemble actin asters on the micropatterns, gelsolin (1.6 μM, gift from Robert Robinson laboratory, IMCB Singapore) was added into the reaction mixture at the last step of the experiment.
Imaging and analysis.
All on an inverted spinning disk confocal microscope (Nikon) with a EMCCD QuantEM (Photometrics) camera. Z-stack images (0.5 µm spacing) of fixed cells were acquired with a 60x oil immersion objective (NA 1.4). Live cell images were acquired using x100 oil immersion objective (NA 1.4) every second at the two planes (centrosome and cortex). Image processing was performed with Fiji (ImageJ) software. Centrosome-associated F-actin was quantified as previously described (Obino et al, 2016). Briefly, after selecting manually the centrosome plane, we performed a background subtraction (rolling ball 50 px) on the z-projection (by calculation of pixel average intensity) of the three planes above and below the centrosome. The total fluorescence of centrosomal F-actin was measured in a 1.6-micrometers-wide disc centred on the centrosome and the total fluorescence of microtubule was measured in the entire cell.
The imaging of microtubules, actin filaments and centrosomes in the in vitro experiments was performed with a total internal reflection fluorescence (TIRF) microscope (Roper Scientific) equipped with an iLasPulsed system and an Evolve camera (EMCCD) using using 60x Nikon Apo TIRF oil-immersion objective lens (N.A=1.49). The microscope
microtubule growth. Multi-stage time-lapse movies were acquired using Metamorph software (version 7.7.5, Universal Imaging). Actin-nucleation activity was quantified by measuring the actin-fluorescence intensity integrated over a 20 μm diameter at the centre of the actin-aster and normalized with respect to initial background intensity. The number of microtubules was manually counted from fluorescence microscopy images. All the measurements were done using Adobe Photoshop CC and the corresponding graphs were produced using Kaleidagraph 4.0.
Statistics.
For the in vitro experiments (Figure 3, 4 and 5), statistical differences were identified using the unpaired t-test with Welch's correction and Kaleidagraph software. For the cellular studies (Figure 1, 2 and 6) statistical differences were computed using GraphPad Prism 7 Software. No statistical method was used to determine sample size. Kolmogorov–Smirnov test was used to assess normality of all data sets. The following tests were used to determine statistical significance: Figures 1B, 2B, 2F, 2 H, 3D, 4C, 6C (actin and microtubules) and 6E (actin and microtubules): Mann–Whitney test; Figures 3E, 3F, 4A, 5D, 6C (cell area) and 6E (cell area): Unpaired t test; Figures 1C, 2C and 2I: One sample t test (comparison to a theoretical mean of zero, where zero represents no difference between conditions); Figures 1D, 2D, 2H and 5E: Spearman correlation test. Bar graphs describe the mean ± standard deviation.
Acknowledgements
We thank Pablo Saez (Institut Curie, France) for providing the EB3-mCherry plasmid and Robert Robinson (IMCB, Singapore) for providing the purified gelsolin.
Author contributions
DI performed all experiments in reconstituted systems. DO performed all experiments in living cells except those related to EB3 dynamics, which were performed by JP. FF performed preliminary experiments in reconstituted systems. JG and CG were involved in experiments in reconstituted systems. A-ML-D, LB and MT designed the project, obtained the funding to support it and supervised the work. MT wrote the manuscript. All authors reviewed/edited the manuscript.
Funding
DI was supported by a fellowship from the Uehara memorial foundation (Japan). DO was supported by a fellowship from the Fondation pour la Recherche Médicale (FDT20150532056). Funding was obtained from the Association Nationale pour la Recherche (ANR-PoLyBex-12-BSV3-0014-001 to A-ML-D and ANR-Mitotube-12-BSV5-0004-01 to MT) and the European Research Council (ERC-Strapacemi-GA 243103 to A-ML-D and ERC-SpiCy 310472 to MT).
Conflict of interest
References
Achard V, Martiel J-L, Michelot A, Guérin C, Reymann A-C, Blanchoin L & Boujemaa-Paterski R (2010) A ‘primer’-based mechanism underlies branched actin filament network formation and motility. Curr. Biol. 20: 423–8 Available at: http://www.ncbi.nlm.nih.gov/pubmed/20188562 [Accessed July 23, 2011]
Akhmanova A & Steinmetz MO (2015) Control of microtubule organization and dynamics: two ends in the limelight. Nat. Rev. Mol. Cell Biol. 16: 711–726 Available at: http://www.nature.com/doifinder/10.1038/nrm4084
Andersen JS, Wilkinson CJ, Mayor T, Mortensen P, Nigg EA & Mann M (2003) Proteomic characterization of the human centrosome by protein correlation profiling. Nature 426: 570–4 Available at: http://www.ncbi.nlm.nih.gov/pubmed/14654843
Antoniades I, Stylianou P & Skourides P a (2014) Making the connection: ciliary adhesion complexes anchor basal bodies to the actin cytoskeleton. Dev. Cell 28: 70–80 Available at: http://www.ncbi.nlm.nih.gov/pubmed/24434137 [Accessed May 9, 2014]
Assis LHP, Silva-Junior RMP, Dolce LG, Alborghetti MR, Honorato R V., Nascimento AFZ, Melo-Hanchuk TD, Trindade DM, Tonoli CCC, Santos CT, Oliveira PSL, Larson RE, Kobarg J, Espreafico EM, Giuseppe PO & Murakami MT (2017) The molecular motor Myosin Va interacts with the cilia-centrosomal protein RPGRIP1L. Sci. Rep. 7: 43692 Available at: http://dx.doi.org/10.1038/srep43692
Au FKC, Jia Y, Jiang K, Grigoriev I, Hau BKT, Shen Y, Du S, Akhmanova A & Qi RZ (2017) GAS2L1 Is a Centriole-Associated Protein Required for Centrosome Dynamics and Disjunction. Dev. Cell 40: 81–94 Available at: http://dx.doi.org/10.1016/j.devcel.2016.11.019
Blanchoin L, Boujemaa-Paterski R, Sykes C & Plastino J (2014) Actin dynamics, architecture, and mechanics in cell motility. Physiol. Rev. 94: 235–63 Available at: http://www.ncbi.nlm.nih.gov/pubmed/24382887 [Accessed July 11, 2014]
Bornens M (1977) Is the centriole bound to the nuclear membrane? Nature 270: 80–2 Available at: http://www.ncbi.nlm.nih.gov/pubmed/927525 [Accessed January 28, 2015] Bornens M & Moudjou M (1999) Studying the composition and function of centrosomes in
vertebrates. Methods Cell Biol. 61: 13–34
Bouchet BP, Gough RE, Ammon Y-C, van de Willige D, Post H, Jacquemet G, Altelaar AFM, Heck AJR, Goult BT & Akhmanova A (2016) Talin-KANK1 interaction controls the recruitment of cortical microtubule stabilizing complexes to focal adhesions. Elife 5:
Available at: http://biorxiv.org/lookup/doi/10.1101/055210
Brangwynne CP, MacKintosh FC, Kumar S, Geisse N a, Talbot J, Mahadevan L, Parker KK, Ingber DE & Weitz D a (2006) Microtubules can bear enhanced compressive loads in living cells because of lateral reinforcement. J. Cell Biol. 173: 733–41 Available at: http://www.pubmedcentral.nih.gov/articlerender.fcgi?artid=2063890&tool=pmcentrez&r endertype=abstract [Accessed June 11, 2011]
Bretou M, Kumari A, Malbec O, Moreau HD, Obino D, Pierobon P, Randrian V, Sáez PJ & Lennon-Duménil AM (2016) Dynamics of the membrane–cytoskeleton interface in MHC class II-restricted antigen presentation. Immunol. Rev. 272: 39–51
Burakov A V & Nadezhdina ES (2013) Association of nucleus and centrosome: magnet or
velcro? Cell Biol. Int. 37: 95–104 Available at:
http://www.ncbi.nlm.nih.gov/pubmed/23319360 [Accessed January 12, 2015]
Burke TA, Christensen JR, Barone E, Suarez C, Sirotkin V & Kovar DR (2014) Homeostatic Actin Cytoskeleton Networks Are Regulated by Assembly Factor Competition for
Monomers. Curr. Biol. 24: 579–585 Available at:
http://dx.doi.org/10.1016/j.cub.2014.01.072
Burnette DT, Schaefer AW, Ji L, Danuser G & Forscher P (2007) Filopodial actin bundles are not necessary for microtubule advance into the peripheral domain of Aplysia neuronal growth cones. Nat. Cell Biol. 9: 1360–1369
Burute M, Prioux M, Blin G, Truchet S, Letort G, Tseng Q, Bessy T, Lowell S, Young J, Filhol O & Théry M (2017) Polarity Reversal by Centrosome Repositioning Primes Cell Scattering during Epithelial-to-Mesenchymal Transition. Dev. Cell 40: 168–184 Available at: http://linkinghub.elsevier.com/retrieve/pii/S1534580716308681
Byron A, Askari J a., Humphries JD, Jacquemet G, Koper EJ, Warwood S, Choi CK, Stroud MJ, Chen CS, Knight D & Humphries MJ (2015) A proteomic approach reveals integrin activation state-dependent control of microtubule cortical targeting. Nat. Commun. 6: 6135 Available at: http://www.nature.com/doifinder/10.1038/ncomms7135 [Accessed January 22, 2015]
Carrasco YR, Fleire SJ, Cameron T, Dustin ML & Batista FD (2004) LFA-1/ICAM-1 interaction lowers the threshold of B cell activation by facilitating B cell adhesion and synapse formation. Immunity 20: 589–599
Chodagam S, Royou A, Whitfield W, Karess R & Raff JW (2005) The centrosomal protein CP190 regulates myosin function during early Drosophila development. Curr. Biol. 15:
December 9, 2013]
Coles CH & Bradke F (2015) Coordinating Neuronal Actin–Microtubule Dynamics. Curr.
Biol. 25: R677–R691 Available at:
http://linkinghub.elsevier.com/retrieve/pii/S0960982215007149
Colin A, Singaravelu P, Théry M, Blanchoin L & Gueroui Z (2018) Actin-Network Architecture Regulates Microtubule Dynamics. Curr. Biol. 0: 1–10 Available at: https://linkinghub.elsevier.com/retrieve/pii/S0960982218308194
Dogterom M & Koenderink GH (2018) Actin–microtubule crosstalk in cell biology. Nat. Rev.
Mol. Cell Biol. Available at: http://www.nature.com/articles/s41580-018-0067-1
Elie A, Prezel E, Guérin C, Denarier E, Ramirez-Rios S, Serre L, Andrieux A, Fourest-Lieuvin A, Blanchoin L & Arnal I (2015) Tau co-organizes dynamic microtubule and
actin networks. Sci. Rep. 5: 9964 Available at:
http://www.nature.com/doifinder/10.1038/srep09964
Etienne-Manneville S (2013) Microtubules in cell migration. Annu. Rev. Cell Dev. Biol. 29: 471–99 Available at: http://www.ncbi.nlm.nih.gov/pubmed/23875648 [Accessed April 30, 2014]
Fakhri N, Wessel AD, Willms C, Pasquali M, Klopfenstein DR, MacKintosh FC & Schmidt CF (2014) High-resolution mapping of intracellular fluctuations using carbon nanotubes.
Science (80-. ). 344: 1031–1035 Available at: http://www.sciencemag.org/cgi/doi/10.1126/science.1250170
Farina F, Gaillard J, Guérin C, Couté Y, Sillibourne J, Blanchoin L & Théry M (2016) The centrosome is an actin-organizing centre. Nat. Cell Biol. 18: 65–75
de Forges H, Bouissou A & Perez F (2012) Interplay between microtubule dynamics and intracellular organization. Int. J. Biochem. Cell Biol. 44: 266–274 Available at: http://linkinghub.elsevier.com/retrieve/pii/S1357272511003074
Gogendeau D, Guichard P & Tassin AM (2015) Purification of centrosomes from mammalian cell lines Elsevier Available at: http://dx.doi.org/10.1016/bs.mcb.2015.03.004
Gundersen GG, Gomes ER & Wen Y (2004) Cortical control of microtubule stability and polarization. Curr. Opin. Cell Biol. 16: 106–12 Available at: http://www.ncbi.nlm.nih.gov/pubmed/15037313 [Accessed July 25, 2011]
Gupton SL, Salmon WC & Waterman-Storer CM (2002) Converging populations of f-actin promote breakage of associated microtubules to spatially regulate microtubule turnover in migrating cells. Curr. Biol. 12: 1891–9 Available at: http://www.ncbi.nlm.nih.gov/pubmed/12445381
Huber F, Boire A, López MP & Koenderink GH (2015) Cytoskeletal crosstalk: when three different personalities team up. Curr. Opin. Cell Biol.
Hutchins BI & Wray S (2014) Capture of microtubule plus-ends at the actin cortex promotes axophilic neuronal migration by enhancing microtubule tension in the leading process.
Front. Cell. Neurosci. 8: 1–8 Available at: http://journal.frontiersin.org/article/10.3389/fncel.2014.00400/abstract
Hyman A, Drechsel D, Kellogg D, Salser S, Sawin K, Steffen P, Wordeman L & Mitchison TJ (1991) Preparation of modified tubulins. Methods Enzymol. 196: 478–85 Available at: http://www.ncbi.nlm.nih.gov/pubmed/18085221
Katrukha EA, Mikhaylova M, van Brakel HX, van Bergen en Henegouwen PM, Akhmanova A, Hoogenraad CC & Kapitein LC (2017) Probing cytoskeletal modulation of passive and active intracellular dynamics using nanobody-functionalized quantum dots. Nat.
Commun. 8: 14772 Available at:
http://www.nature.com/doifinder/10.1038/ncomms14772
Kaverina I, Rottner K & Small JV (1998) Targeting, capture, and stabilization of microtubules at early focal adhesions. J. Cell Biol. 142: 181–190
Letort G, Nedelec F, Blanchoin L & Théry M (2016) Centrosome centering and decentering by microtubule network rearrangement. Mol. Biol. Cell 27: 2833–2843 Available at: http://www.molbiolcell.org/content/early/2016/07/18/mbc.E16-06-0395.abstract
López MP, Huber F, Grigoriev I, Steinmetz MO, Akhmanova A, Koenderink GH & Dogterom M (2014) Actin-microtubule coordination at growing microtubule ends. Nat.
Commun. 5: 4778 Available at: http://www.ncbi.nlm.nih.gov/pubmed/25159196
[Accessed August 28, 2014]
Mahuzier A, Shihavuddin A, Fournier C, Lansade P, Faucourt M, Menezes N, Meunier A, Garfa-Traoré M, Carlier M-F, Voituriez R, Genovesio A, Spassky N & Delgehyr N (2018) Ependymal cilia beating induces an actin network to protect centrioles against shear stress. Nat. Commun. 9: 2279–94 Available at: http://dx.doi.org/10.1038/s41467-018-04676-w
Michelot A, Berro J, Guérin C, Boujemaa-Paterski R, Staiger CJ, Martiel J-L & Blanchoin L (2007) Actin-filament stochastic dynamics mediated by ADF/cofilin. Curr. Biol. 17: 825–33 Available at: http://www.ncbi.nlm.nih.gov/pubmed/17493813 [Accessed September 5, 2011]
http://www.ncbi.nlm.nih.gov/pubmed/22021191 [Accessed March 13, 2012]
Mohan R & John A (2015) Microtubule-associated proteins as direct crosslinkers of actin filaments and microtubules. IUBMB Life 67: 395–403
Moudjou M & Bornens M (1998) Method of centrosome isolation from cultured animal cells. In Cell Biology: A laboratory Handbook, Celis J (ed) pp 111–119. Academic Press Obino D, Farina F, Malbec O, Sàez PJ, Maurin M, Gaillard J, Dingli F, Loew D, Gautreau A,
Yuseff M-I, Blanchoin L, Théry M & Lennon-Duménil A-M (2016) Actin nucleation at the centrosome controls lymphocyte polarity. Nat. Commun. 7: 10969 Available at: http://www.nature.com/doifinder/10.1038/ncomms10969
Pan J, You Y, Huang T & Brody SL (2007) RhoA-mediated apical actin enrichment is required for ciliogenesis and promoted by Foxj1. J. Cell Sci. 120: 1868–76 Available at: http://www.ncbi.nlm.nih.gov/pubmed/17488776 [Accessed August 3, 2011]
Piel M, Meyer P, Khodjakov A, Rieder CL & Bornens M (2000) The Respective Contributions of the Mother and Daughter Centrioles to Centrosome Activity and Behavior in Vertebrate Cells 7. Cell 149: 317–329
Pitaval A, Senger F, Letort G, Gidrol X, Sillibourne J & THERY M (2016) Microtubule stabilization drives centrosome migration to initiate primary ciliogenesis. bioRxiv: 1–46 Portran D, Gaillard J, Vantard M & Théry M (2013) Quantification of MAP and molecular
motor activities on geometrically controlled microtubule networks. Cytoskeleton
(Hoboken). 70: 12–23 Available at: http://www.ncbi.nlm.nih.gov/pubmed/23027541
[Accessed October 23, 2014]
Reymann A, Martiel J, Cambier T, Blanchoin L, Boujemaa-Paterski R & Théry M (2010) Nucleation geometry governs ordered actin networks structures. Nat. Mater. 9: 827–832 Robison P, Caporizzo MA, Ahmadzadeh H, Bogush AI, Chen CY, Margulies KB, Shenoy
VB & Prosser BL (2016) Detyrosinated microtubules buckle and bear load in contracting cardiomyocytes. Science (80-. ). 352: aaf0659-aaf0659 Available at: http://www.sciencemag.org/cgi/doi/10.1126/science.aaf0659
Rodriguez OC, Schaefer AW, Mandato CA, Forscher P, Bement WM & Waterman-storer CM (2003) Conserved microtubule – actin interactions in cell movement and morphogenesis.
Nat. Cell Biol. 5: 599–609
Roostalu J & Surrey T (2017) Microtubule nucleation: beyond the template. Nat. Publ. Gr. Available at: http://dx.doi.org/10.1038/nrm.2017.75
Sanchez AD & Feldman JL (2016) Microtubule-organizing centers: from the centrosome to non-centrosomal sites. Curr. Opin. Cell Biol.: 1–9 Available at:
http://linkinghub.elsevier.com/retrieve/pii/S0955067416301521
Shelanski M (1973) Chemistry of the filaments and tubules of brain. J. Histochem.
Cytochamistry 21: 529–539
Stevenson VA, Kramer J, Kuhn J & Theurkauf WE (2001) Centrosomes and the Scrambled protein coordinate microtubule-independent actin reorganization. Nat. Cell Biol. 3: 68– 75
Suarez C, Carroll RT, Burke TA, Christensen JR, Bestul AJ, Sees JA, James ML, Sirotkin V & Kovar DR (2014) Profilin Regulates F-Actin Network Homeostasis by Favoring Formin over Arp2/3 Complex. Dev. Cell 32: 43–53 Available at: http://linkinghub.elsevier.com/retrieve/pii/S1534580714006935 [Accessed December 29, 2014]
Suarez C & Kovar DR (2016) Internetwork competition for monomers governs actin cytoskeleton organization. Nat. Publ. Gr. Available at: http://dx.doi.org/10.1038/nrm.2016.106
Théry M, Racine V, Piel M, Pépin A, Dimitrov A, Chen Y, Sibarita J-B & Bornens M (2006) Anisotropy of cell adhesive microenvironment governs cell internal organization and orientation of polarity. Proc. Natl. Acad. Sci. U. S. A. 103: 19771–6 Available at: http://www.pubmedcentral.nih.gov/articlerender.fcgi?artid=1750916&tool=pmcentrez&r endertype=abstract [Accessed August 28, 2011]
Uzbekov R, Kireyev I & Prigent C (2002) Centrosome separation : respective role of microtubules and actin filaments. 94: 275–288
Walentek P, Quigley IK, Sun DI, Sajjan UK, Kintner C & Harland RM (2016) Ciliary transcription factors and miRNAs precisely regulate Cp110 levels required for ciliary adhesions and ciliogenesis. Elife 5: 1–24
Wang W, Chen L, Ding Y, Jin J & Liao K (2008) Centrosome separation driven by actin-microfilaments during mitosis is mediated by centrosome-associated tyrosine-phosphorylated cortactin. J. Cell Sci. 121: 1334–43 Available at: http://www.ncbi.nlm.nih.gov/pubmed/18388321 [Accessed September 2, 2011]
Wieczorek M, Bechstedt S, Chaaban S & Brouhard GJ (2015) Microtubule-associated proteins control the kinetics of microtubule nucleation. Nat. Cell Biol. Available at: http://www.nature.com/doifinder/10.1038/ncb3188
Wu C-T, Chen H-Y & Tang TK (2018) Myosin-Va is required for preciliary vesicle transportation to the mother centriole during ciliogenesis. Nat. Cell Biol. Available at:
Yuseff MI, Reversat A, Lankar D, Diaz J, Fanget I, Pierobon P, Randrian V, Larochette N, Vascotto F, Desdouets C, Jauffred B, Bellaiche Y, Gasman S, Darchen F, Desnos C & Lennon-Duménil AM (2011) Polarized Secretion of Lysosomes at the B Cell Synapse Couples Antigen Extraction to Processing and Presentation. Immunity 35: 361–374 Zhou FQ, Waterman-Storer CM & Cohan CS (2002) Focal loss of actin bundles causes
Figure legends
Figure 1: Cytoskeleton remodelling in B lymphocytes upon antigen stimulation.
A- IIA1.6 B lymphoma cells were stimulated with BCR-ligand- (IgM) or BCR-ligand+
(IgG) beads for 60 min, fixed and stained for and F-actin (top) and -tubulin (bottom). Scale bar: 3 µm.
B- Histograms show the quantifications of the polymerized tubulin and filamentous
F-actin at the centrosome (dashed outline on the image, values correspond to the fraction of fluorescence in a 2-micron-wide area around the centrosome relative to the total fluorescence in the cell) and the total amount of polymerized fluorescent tubulin (bottom right, values were normalized with respect to the mean of control condition). Measurements were pooled from 3 independent experiments; IgM (BCR-ligand-): n= 88; IgG (BCR-ligand+): n= 93. Error bars correspond to standard deviations. Scale bars: 2 µm (top) and 3 µm (bottom).
C- Percentage differences of centrosomal F-actin and centrosomal microtubule
fluorescence intensities in cells stimulated with BCR-ligand+ beads with respect to cells stimulated with BCR-ligand- beads. Errors bars represent standard deviations.
D- The graph shows the variations of the total amount of tubulin per cell with respect to
the content of actin at the centrosome in an XY representation of individual measurements. The two lines correspond to linear regressions of the two sets of data relative to cells stimulated with BCR-ligand+ (activated cells) or BCR-ligand- (resting cells) beads.
Figure 2: The impact of modulating centrosomal actin on microtubules in B lymphocytes.
A- IIA1.6 B lymphoma cells were treated 45 min with indicated inhibitors (CK666 at 25
µM, SMIFH2 at 25µM) or DMSO as control prior to being fixed and stained for -tubulin (left column) and F-actin (right column). Scale bar: 3 µm.
B- Histograms show the quantifications of the amount of polymerized fluorescent tubulin
(right, values were normalized with respect to the mean of control condition) and filamentous actin at the centrosome (left, values correspond to the fraction of fluorescence in a 2-micron-wide area around the centrosome relative to the total
DMSO: n= 91, CK666: n= 82, SMIFH2: n= 74, latrunculinA: n= 96. Error bars correspond to standard deviations.
C- Percentage differences of centrosomal F-actin and microtubule fluorescence intensities
in cells treated with cytoskeleton inhibitors in comparison with the respective densities in cells treated with DMSO. Errors bars represent standard deviations.
D- The graph shows the same measurements than in panel B in an XY representation of
individual measurements. The three lines correspond to linear regressions of the three sets of data relative to cells stimulated with each actin drug.
E- IIA1.6 B lymphoma cells were transfected to transiently express centrin1-GFP (red)
and EB3-mCherry (green) and video-recorded at the contact site with the glass coverslip (left) and at the centrosome (right). Scale bar: 3 µm.
F- The duration of EB3-positive comets presence in the bottom plane was measured in
DMSO and CK666 treated cells (left). The number of EB3-positive comets exiting the a 2-µm wide centrosomal area was also compared between the two conditions (right). G- IIA1.6 B lymphoma cells were transfected to transiently express centrin1-VCA-GFP
(bottom) or centrin1-GFP (top) as control prior to be fixed and stained for -tubulin (left column) and F-actin (middle column). The GFP signal of centrin1 or centrin1-VCA is shown in the right column to illustrate the proper centrosome targeting. Scale bar: 3 µm.
H- Histograms show the quantifications of the amount of polymerized fluorescent tubulin
(right) and filamentous actin at the centrosome (left). Values correspond to the fraction of fluorescence in a 2-micron-wide area around the centrosome relative to the total fluorescence in the cell. Measurements were pooled from 3 independent experiments; centrin1-GFP: n= 88, centrin1-VCA-GFP: n= 87. Errors bars represent standard deviations.
I- Percentage differences of F-actin and microtubule fluorescence intensities at the
centrosome were compared in cells transfected either with centrin1-VCA-GFP or with centrin1-GFP. Errors bars represent standard deviations.
J- The graph shows the variations of the total amount of tubulin per cell with respect to
the content of actin at the centrosome. The two lines correspond to linear regressions of the two sets of data relative to cells transfected with centrin1-VCA-GFP or centrin1-GFP.
Figure 3: Assembly of microtubules and actin filaments on isolated centrosomes.
A- Two sets of representative images showing fluorescent microtubules and actin
filaments assembled from isolated centrosomes. Centrosomes were isolated from Jurkat cells expressing centrin1-GFP. Upper and lower lines show actin filaments and microtubules radiating from two distinct centrosomes with low (top) and high (bottom) densities of actin filaments. Scale bars: 10 μm.
B- The graph shows the number of microtubules per centrosome relative to the density of
actin filaments. Inset shows actin filaments at the centrosome with a FIRE look-up table and a 20 µm-wide circle in which actin fluorescence intensity is measured. Measurements were pooled from 5 independent experiments; n= 50.
C- Microtubules (top line) and actin filaments (bottom line) assembly from isolated
centrosomes in the presence of increasing concentration of monomeric actin (from left to right). Scale bar: 20 μm.
D- The graph shows the number of microtubules per centrosome in response to increasing
concentrations of monomeric actin. Data were pooled from 2 independent experiments; 0 µM: n= 21; 0.3 µM: n= 17; 0.5 µM: n= 17; 1.0 µM: n= 17. Data information: ****:P<0.001 Mann-Whitney test.
E- The image shows the density of actin filaments at the centrosome color-coded with the
FIRE look-up table and the definition of central, peripheral and distal regions corresponding to decreasing concentrations of actin filaments. Scale bar: 20 μm. The graph shows the measurements of microtubule growth rate in each region.
F- The graphs show the various intensities of centrosome immuno-staining with
antibodies against gamma-tubulin on the same coverslip depending on the presence/absence of actin filaments (left) or on the amount of actin filaments (right).
Figure 4: Blockage of microtubule growth by actin filaments on isolated centrosomes.
A- Schematic illustration of the first dynamic assay: sequential addition of tubulin
followed by tubulin and actin on isolated centrosomes.
B- Representative images showing microtubules (top line) and the merged images of
actin and microtubules (bottom line) for the two steps of the assay; in the presence of tubulin only (left column) and in the presence of tubulin and actin (right column). Scale bar: 10 µm.
(first condition), or not (second condition), to grow actin filaments. Data were collected from a single experiment; asters without actin filaments: n= 29; asters with actin filaments: n= 13.
D- Schematic illustration of the second dynamic assay: tubulin is added to measure
centrosome nucleation capacity and washed out. Then actin is added followed by actin and tubulin.
E- Representative images showing microtubules (top line) and the merged images of
actin and microtubule (bottom line) during the three steps of the assay; in the presence of tubulin only (left column), in the absence of tubulin and presence of actin (middle column) and in the presence of tubulin and actin (right column). Scale bar:10 µm.
F- Quantification of the differences in the number of microtubules per centrosome
between the first and last steps of the experiment described above (panels D and E) on centrosomes capable (first condition), or not (second condition), to grow actin filaments. Data were pooled from 2 independent experiments; asters without actin filaments: n= 24; asters with actin filaments: n= 13. Data information: ****:P<0.001 Student t-test.
Figure 5: Reconstitution of the interplay between actin and microtubules on micropatterns.
A- Schematic illustration of the micropatterning method to graft microtubules seeds
(green) via neutravidin (yellow) and actin-nucleation-promoting complexes (orange) on 8-micron-wide discoidal micropatterns. A glass coverslip (deep blue) coated with polyethyleneglycol (PEG) (light blue) was placed in contact with a transparency mask and exposed to deep UV light. The exposed coverslip was then immersed with neutravidin to fix biotinylated microtubule seeds (green) on exposed regions. Streptavidin-WA was immobilized on microtubule seeds via their interaction with biotin. Tubulin dimers and actin monomers were then added to allow filaments elongation.
B- Representative images of microtubules (top) and actin filaments (bottom) growth from
micropatterns. Scale bars: 20 μm.
C- Schematic illustration of the assay on micropatterned substrate. Tubulin was first
added alone to measure the nucleation capacity of each micropattern, and then washed out. Later on, actin was added followed by actin and tubulin. Finally, actin was rinsed out and gelsolin was added to fully disassemble actin filaments. Representative images
showing microtubules (top line) and the merged images of actin and microtubules (bottom line) during the four steps of the assay; in the presence of tubulin only, in the absence of tubulin and presence of actin, in the presence of tubulin and actin, and finally in the presence of tubulin and gelsolin but in the absence of actin filaments (from left to right). Scale bar: 10 μm.
D- Quantification of the number of microtubules per micropattern in the presence of
tubulin only (left), actin and tubulin (middle) and tubulin only after actin filaments disassembly (right). Data were pooled from 2 independent experiments; n= 133. Data information: ****:P<0.001 Student t-test.
E- The graph shows the same measurements as in panel E in an XY representation of
individual measurements. It illustrates the differences in the number of microtubules per micropattern between the first to the second step (tubulin only versus actin and tubulin together) with respect to the density of actin filaments per micropattern.
Figure 6: Modulation of microtubule growth by cell spreading and centrosomal actin. A- Schematic illustration of our model according to which cell spreading sequesters
monomeric actin to the cortex and thereby enables the centrosome to grow more microtubules. Drawings show top (top line) and side views (bottom line) of cells with increased spreading from left to right. Actin filaments are in green, microtubules in red.
B- RPE1 cells stably expressing centrin1-GFP were plated for 3 h on coverslips coated
with different ratios (100:0; 50:50 or 1:99) of fibronectin and PLL-PEG prior to fixation and staining for F-actin (top line and magnified views around centrosome below. Scale bars: 10 µm and 2 µm, respectively) and -tubulin (bottom line. Scale bar: 10 µm).
C- IIA1.6 B lymphoma cells were plated for 60 min on poly-L-lysine, fibronectin or
ICAM-1 coated cover slides prior to be fixed and stained for F-actin (top line) and -tubulin (bottom line). Scale bar: 3 µm.
D- Quantification of the area occupied by RPE1 cells on the substrate (top left), F-actin
content at the centrosome (top right) polymerized tubulin at the centrosome (bottom left) and in the entire cell (bottom right) for the three conditions of cell adhesion described in B. Measurements came from 3 independent experiments with more than
E- Quantification of the area occupied by B lymphoma cells on the substrate (top left), F-actin content at the centrosome (top right) polymerized tubulin at the centrosome (bottom left) and in the entire cell (bottom right) for the three conditions of cell adhesion described in D. Measurements came from 3 independent experiments with more than 80 analyzed cells in each. Errors bars represent standard deviations.
Expanded View Figure legends
Figure EV1 – Correlation analysis between centrosomal or cortical actin networks and microtubule content.
A- Histograms show the quantifications of the amount of filamentous F-actin at the cortex of B lymphoma cells. Measurements were pooled from 3 independent experiments; IgM (BCR-ligand-): n= 88; IgG (BCR-ligand+): n= 93. Error bars correspond to standard deviations.
B- Graph shows the variations of the fluorescence intensities of cortical F-actin (green) or centrosomal F-actin (red) with respect to the total amount of polymerized tubulin (values were normalized with respect to the mean values of all measured cells). The two lines correspond to linear regressions of the two sets of data. The Speaman correlation test indicates the correlation coefficient r and the p value of the significance of the correlation. Only centrosomal actin appeared correlated to the total content of polymerized tubulin.
C- The graph shows the variations of the total amount of tubulin per cell with respect to the content of cortical actin in an XY representation of individual measurements. The two lines correspond to linear regressions of the two sets of data relative to cells stimulated with BCR-ligand+ (activated cells) or BCR-ligand- (resting cells) beads. In none of the two cases the total amount of polymerized tubulin appeared correlated to the propotion of cortical actin filaments.
Figure EV2 – Variations of total and local actin and tubulin content in cells expressing centrin1-VCA.
Histograms show the quantifications of the amount filamentous actin in the entire cell (top left), at the cell cortex (top middle) and at the centrosome (top left) as well as the amount of polymerized fluorescent tubulin in the entire cell (bottom left) and at the centrosome (bottom right). Values at the centrosome correspond to the fraction of fluorescence in a 2-micron-wide area around the centrosome relative to the total fluorescence in the cell. Measurements were pooled from 3 independent experiments; centrin1-GFP: n= 88, centrin1-VCA-GFP: n= 87. Errors bars represent standard deviations.