HAL Id: hal-02878216
https://hal-pse.archives-ouvertes.fr/hal-02878216
Preprint submitted on 22 Jun 2020HAL is a multi-disciplinary open access archive for the deposit and dissemination of sci-entific research documents, whether they are pub-lished or not. The documents may come from teaching and research institutions in France or abroad, or from public or private research centers.
L’archive ouverte pluridisciplinaire HAL, est destinée au dépôt et à la diffusion de documents scientifiques de niveau recherche, publiés ou non, émanant des établissements d’enseignement et de recherche français ou étrangers, des laboratoires publics ou privés.
Wealth in Spain, 1900-2014: A Country of Two Lands
Miguel Artola Blanco, Luis Estévez Bauluz, Clara Martinez-Toledano
To cite this version:
Miguel Artola Blanco, Luis Estévez Bauluz, Clara Martinez-Toledano. Wealth in Spain, 1900-2014: A Country of Two Lands. 2018. �hal-02878216�
World Inequality Lab Working papers n°2018/5
"Wealth in Spain, 1900-2014: A Country of Two Lands"
Miguel Artola Blanco, Luis Estévez Bauluz, Clara Martínez-Toledano
Keywords : Wealth; Spain; Wealth-income ratios; Historical balance sheets;
Housing; Net foreign assets, Economic development
Wealth in Spain, 1900-2014:
A Country of Two Lands
∗
Miguel Artola Blanco
†, Universidad Carlos III
Luis E. Bauluz
‡, Paris School of Economics
Clara Martínez-Toledano
§, Paris School of Economics
February 2018
Abstract
This study reconstructs Spain’s national wealth from 1900 to 2014. We compare the market value and book value definitions. We then present a new asset-specific decomposition of the long-run movements in the value of wealth into a volume effect (through saving) and a price effect (capital gains or losses). We also investigate the role of offshore assets using administrative records. Our results show that the national wealth-to income ratio followed a J-shaped evolution over the last century, contrary to the U-shaped trend observed in other rich economies. Spain’s wealth accumulation also differs in that both agricultural and urban land represented a larger share of national wealth in the early twentieth and twenty-first centuries, respectively. These findings are largely explained by capital gains coming from the housing sector, which account for 45% of the real growth of national wealth over the 1950-2010 period. When offshore assets are considered, Spain’s international indebtedness reduced by approximately one quarter since the 2000s. Overall, this study highlights the importance of capital gains, housing, and offshore assets as key elements in the long-term accumulation of wealth. Keywords: Wealth-income ratios, Historical balance sheets, Housing, Net foreign assets, Economic development. JEL Classification: D3, E2, F3.
∗
We thank Facundo Alvaredo, Carlos Barciela, Eva Benages, Thomas Blanchet, Olympia Bover, Juan Carmona, Francisco Comín, Vicent Cucarella, Stefan Houpt, Elena Martínez, Jorge Martínez, Enrique Martínez-García, Pedro Pablo Ortúñez, Leandro Prados de la Escosura, Thomas Piketty, Daniel Walden-ström, and Gabriel Zucman for their helpful comments, as well as participants at the 2016 meeting of the Spanish Economic History Association and seminars at Paris School of Economics, London School of Economics, European University Institute, 16th Trento Summer School, and University of Zaragoza. We acknowledge financial support from INET, ESRC-DFID (grant ES/I033114/1), and the European Research Council (grant 340831). Luis E. Bauluz acknowledges financial support from Fundación Ramón Areces and Clara Martínez-Toledano acknowledges financial support from Fundación Ramón Areces and Bank of Spain at different stages of the project.
† martola@ing.uc3m.es ‡ luisebauluz@gmail.com § c.martinez-toledano@psemail.eu
1
Introduction
Wealth is gaining increasing attention from both the academic community and pub-lic opinion. Wild swings in asset prices, the significance of cross-border positions within the Euro area and the global increase in inequalities–to name just three recent significant economic trends–point to the importance of studying wealth aggregates. Thus, construct-ing and strengthenconstruct-ing national wealth statistics based on sectoral balance sheets has been the object of increasing attention from various institutions (Financial Stability Board and International Monetary Fund (2009), p8). In this sense, Spain is a country that clearly deserves internationally scholarly attention. Since entering the Eurozone in the late 1990s, the Spanish economy underwent a large housing bubble followed by an equally huge bust. The country also experienced a sharp deterioration in its net foreign asset position and a more recent rise in public indebtedness. Although academics and the media have been quick to analyze this process, the truth is that many studies are limited by the lack of a complete set of national balance sheets. Additionally, the absence of long-run series makes it more difficult to determine the historical significance of recent developments.
This study tracks the historical evolution of Spanish national wealth since the be-ginning of the twentieth century. By analyzing the Spanish case, we can address the main methodological problems that the international literature on wealth faces. More specifi-cally, we recognize the difficulties of reconciling estimates of national wealth through the market value definition (i.e., the aggregate of the personal and public sectors’ net worth) with the book value approach (the stock of domestic non-financial assets plus the net foreign position). For the market value approach, we provide a complete and detailed balance sheet for the private sector and government since 1900 following a census method using the asset and liabilities classification of modern national accounts. For the book value approach, we compute national wealth by estimating domestically produced assets through the perpetual inventory method, to which we add non-produced assets using a
census approach plus the net foreign position. One of the advantages of using this last definition is that it allows us to decompose housing wealth into buildings and underlying land, which is key to understanding the underlying forces driving up the value of dwellings in the last decades. To our knowledge, this is the first study comparing the evolution of both measures of national wealth for a period covering more than a century.
A second area in which we provide further methodological insights concerns the dif-ficult task of estimating net foreign position due to the growing influence of tax havens. For this purpose, we present the first estimate on offshore assets held by Spanish residents using Swiss and Spanish administrative data. Finally, we decompose the accumulation of national wealth into a volume effect (through savings) and a price effect (capital gain-s/losses), but we go beyond previous studies and differentiate between national wealth accumulation in housing and non-housing (other types of capital and foreign wealth). We thus disentangle the key drivers of the long-run accumulation of wealth.
The findings from this study can be summarized as follows. First, both the market and book value national wealth to income ratios of Spain stood for most of its history in a relatively close range–between 400 and 500%–until the housing boom of the early 2000s led to an unprecedented rise to almost 800% in 2007. In this manner, Spain’s national wealth to income ratio was the highest of all countries with available records in the early twenty-first century, mostly due to the huge housing bubble. Spain’s singularity is reinforced by having followed a J-shaped evolution in its national wealth-to-income ratio during the twentieth century that differs from the U-shaped trends observed in other developed countries. Nonetheless, this J-shaped pattern is mainly the result of public wealth, since personal wealth is closer to a U-shaped trend.
The second main result arising from this study points that the shift from high agri-cultural land value to high urban value, which happened in other advanced countries, was particularly fast in Spain. Agricultural land value was exceptionally large in the early twen-tieth century, and urban land value became exceptionally large in the early twenty-first
century. Third, we find that the magnitude of offshore assets is non-negligible, reducing the rise in the international indebtedness in Spain by approximately one quarter since the 2000s. Finally, we present evidence that, in Spain, contrary to other rich countries, cap-ital gains based on a sustained increase in the relative price of assets was a fundamental determinant of wealth accumulation during the very long term, but especially since the 1950s. Our results point to housing as the most important driver, accounting for 85% of total capital gains over the 1950-2010 period.
The rest of the paper proceeds as follows. Section II discusses previous research on other countries and Spain. In Section III, we briefly introduce the key concepts, methods, and sources employed. Section IV presents the most important long-term trends in the evolution of wealth aggregates. In Section V, we compare our series with previous studies on other countries. Finally, Section VI concludes. Appendix A and B provide all figures and tables, respectively, at the end of the paper. The paper has a companion methodological data appendix ("Spain Wealth Appendix") and the complete set of results is provided in an Excel file ("Spain Wealth Database").
2
Literature Review
The study of wealth based on the national accounts framework is a relatively new phenomenon. The 1993 U.N. System of National Accounts (SNA) first introduced an international set of guidelines to compute national wealth through an estimation of sectoral balance sheets, which include all assets and liabilities1Since then, statistical offices in most advanced economies and a few developing countries have produced comprehensive wealth estimates. Progress is still uneven, with some countries providing a very complete and long set of national balance sheets, while others offering only partial results.
This slow development occurred despite research on wealth gaining an increasing
1The SNA-1993 (Commission of the European Communities and Inter-Secretariat Working Group on National Accounts(1993)), was subsequently revised in the SNA-2008 (United Nations et al. 2009). The European Union adapted these accounting standards by creating ESA-1995 (European Union(1996)) and ESA-2010 (European Union(2013)).
interest among scholars and the public. One major stimulus has come through the study of the evolution, composition, and distributional patterns of household wealth. Davies et al.(2011) estimated household wealth for 39 economies for 2000, using sectoral balance sheets and survey data, which was extended to 2000-2016 using the Global Wealth Report series edited by Shorrocks et al.(2015). The other major impetus in wealth research has come through the work of Piketty and co-authors (Piketty (2014); Piketty and Zucman (2014)). Piketty and Zucman (2014) presented a new study on the long-term dynamics of the wealth-to-income ratios for a set of advance countries adopting the modern SNA guidelines with previous contemporary estimates. Their key finding is that the relationship between wealth and income has not been stable over time. On the contrary, wealth-to-income ratios followed a strong U-shaped evolution over the twentieth century, most prominently in Europe.
Together, these results have had a strong impact on how we understand the economic transformation of advanced countries, and incentivized researchers to reconstruct the dy-namics of national wealth in other countries taking a long-term perspective. At the time of writing, we are aware of the reconstruction of the Swedish national wealth since 1810 (Waldenström (2016)), an analysis of South Africa since 1975 (Orthofer (2015)), a study on the national wealth of Greece (Charalampidis (2016)), and a study of China’s wealth Piketty et al. (2016). In addition, this new literature on wealth has attracted important attention to the concept of national wealth and on the assets driving up wealth-income ratios in the most recent decades. On the one hand, some scholars argue about the dif-ferent evolution of national wealth measured from a market or book value perspective (McGrattan et al.(2015)). This aspect, also highlighted byPiketty(2014), relates directly to understanding the dynamics of Tobin’s Q (Tobin (1969)), but also to the discrepancies arising from using different methodologies to compute wealth. On the other hand, de-compositions into different assets show that housing is the main driver of the recent rise in wealth (Piketty(2014), Table II), thereby deserving specific attention (Rognlie(2014),
Bonnet et al. (2014), Grossman and Steger (2017)). In particular, land appears as the main determinant of rising wealth-income ratios (Stiglitz (2016)), due most likely to the fast appreciation in urban land prices in rich countries over the last decades (Knoll et al. (2017)). From this perspective, the recent evolution of wealth-income ratios is connected to a large academic literature dealing with the increase in housing prices (Mankiw and Weil (1989),Favara and Imbs (2015), Saiz(2010),Glaeser et al. (2005),Gyourko et al. (2013)) and, in particular, with the pioneering study by Davis and Heathcote (2007), where the authors decomposed the historical value of dwellings in the US into two components: land and structure.
International scholars analyzing wealth normally point to Spain as a missing case (Goldsmith(1985), Piketty and Zucman (2014)), although in truth, there are some exist-ing relevant studies. First, some tentative estimates were made at the beginnexist-ing of the twentieth century (for example, Barthe (1917), Banco Urquijo(1924), Vandellós (1925)), although asVelarde Fuertes(1968) already pointed out, these results are plagued by impor-tant inaccuracies and generally lacked methodological rigor. Second, when Spain started to develop its national accounts, a group of researchers at the Universidad de Deusto (1968) conducted an impressive wealth census for 1965 that covered all non-financial assets (agri-cultural land, livestock, housing, business assets, consumer durables, etc.) in great depth. Each asset class was studied by a group of scholars, who used various calculation proce-dures, such as the perpetual inventory method, multiplying wealth quantities by market prices or updating production costs by considering capital depreciation and changes in asset prices. Goldsmith (1970) correctly argued that it would have been preferable to use a more precise and uniform method, although all researchers have since agreed that the University of Deusto’s estimates are broadly reliable (Carreras et al. (2005), p1317).
Since the 1980s, the literature on Spain has grown impressively. On the one hand, a set of academics have developed new series for the capital stock based on the modern procedures of the perpetual inventory method, which accumulates investment flows to
compute the value of all produced assets. The first studies following a long-term approach were conducted by Myró (1983) and Cubel Montesinos and Palafox (1997), which have been recently complemented by a more precise analysis by Prados de la Escosura and Rosés (2010). Similarly, researchers of the Ministry of Finance and the IVIE made a very detailed estimation of the capital stock since 1964 (Dabán Sánchez et al. (2002), Mas Ivars et al. (2015)), while Mas Ivars et al. (2015)’s study of public capital starts in 1900. Although these works provide an invaluable point of reference, none actually refers to the wealth of the country, as non-produced assets (i.e., land and subsoil assets) are excluded by definition. Additionally, these studies do not consider foreign wealth.
The other major development occurred in the mid-1980s after the Bank of Spain started to develop a modern system of financial accounts that records all financial assets and liabilities. This set of results later incentivized the development of some complementary sources on wealth aggregates, such as various estimates of the value of residential buildings and the creation of the Survey of Household Finances in 2002. Using these records,Naredo et al.(2008) built the first comprehensive balance sheet for the different institutional sectors in Spain from 1995 to 2007. However, as we detail in the following section, some assets– most importantly, dwellings–are substantially overvalued. Our study aims to provide more precise estimates and to extend the series to the beginning of the twentieth century.
3
Concepts, methodology, and empirical estimate
In this study, we use the concepts of national income and wealth from the inter-national system accounts (SNA 2008, ESA 2010). Wealth is calculated by providing, for a particular point in time, a balance sheet that records the value of assets economically owned and liabilities owed by an institutional unit or group of units at prevailing market prices. For a given resident sector i (i.e., personal, corporate, or government sectors), wealth (or net worth) is the sum of non-financial assets plus financial assets, less liabilities:
Wi= AN Fi + AFi − Li.
At the country level, national wealth can be defined by two related but different measures. The first follows what Piketty and Zucman (2014) call the "market value of wealth," which sums personal and government net wealth: WNM = WP + WG. In this
definition, corporate capital is mostly captured by the market value of equity holdings owned by households and the government. This approach differs from SNA standards, referred to by Piketty and Zucman as the "book value of wealth," which is the sum of the non-financial assets of all domestic sectors and all resident sectors plus net foreign wealth: WNB= AN FP + AN FC + AN FG + N F W . Given that net foreign wealth is the sum of financial assets net of the liabilities of the three resident sectors: N F W = AFP−LP+AFC−LC+AFG−
LG, then the difference between both definitions can be traced to the corporate sector. The
distinction between the two definitions is corporate wealth (or residual corporate wealth), which is the difference between corporations’ book value of equity and its market value. Specifically, adding corporate wealth to the market value of national wealth matches the book value definition: WNB= WNM+ WC. Hence, both definitions converge when corporate
wealth is zero, or, similarly, when Tobin’s Q (Tobin 1969) equals one.
Conceptually, it is not clear which of the two measures is preferable because both have their merits. From a distributional perspective, the "market value" approach is certainly convenient given that corporate market value is reflected in the equity holdings of households and the government. A more delicate aspect, however, refers to measuring domestic non-financial assets if corporate wealth diverges from zero. In particular, the market value definition of national wealth measures corporate non-financial assets by the market value of their equity plus their net-non-equity liabilities (the difference between equity liabilities and financial assets). We can show this by defining domestic non-financial assets as the difference of market value national wealth with net foreign assets, and then solving for corporate fixed assets:
AN FP + AN FC + AN FG = WNM − N F W AN FC = WNM − N F W − AN FP − AN FG
AN FC = LC − AFC
(1)
Hence, if theoretical reasons exist for a Tobin’s Q different from one, for example, because corporations’ non-financial assets follow a different trajectory than equity markets, then the book value approach would track the evolution of a country’s wealth more accu-rately. Empirically, determining which measure of national wealth is more accurate has a fundamental problem. Concretely, some discrepancies in the measurement of corporate fixed assets or, equivalently, the measurement of corporate wealth, are the result of using different methods and sources to compute both definitions. Thus, from this perspective, determining which definition is more precise requires that we balance the advantages and disadvantages of the measurement in the two approaches.
From a methodological perspective, wealth stocks and its subcomponents can be measured using different approaches. Generally, SNA advises computing wealth based on observed quantities and market prices (a census-like method), and to use alternative approaches when this method is not viable. In this study, we stick to this guideline and compute most wealth aggregates on this basis. All our estimates for financial assets and liabilities, as well as for agricultural land and housing wealth, follow the census approach. Alternatively, we apply the perpetual inventory method and the capitalization technique to measure the remaining wealth aggregates.
This study reconstructs national wealth in the most complete and comprehensive manner by using three different perspectives. First, we compute market value national wealth for 1900-2014 by calculating household and government wealth. For both sectors, we estimate financial wealth–financial claims net of liabilities–to which we add non-financial assets. Households’ non-financial assets are decomposed into three categories: housing (which includes the value of both the structure and the underlying land), agricultural
land, and unincorporated business assets different from agricultural land. Similarly, for the government sector, we decompose non-financial assets into produced assets (buildings, buildings and constructions, machinery and equipment), land underlying public buildings, and forestland owned by local authorities.
Secondly, we compute the book value of national wealth for 1900-2014 by aggre-gating all types of non-financial assets in the Spanish economy, to which we add the net foreign wealth. The estimate is done regardless of the sector owning them, and we decom-pose these assets into the following groups: Housing, non-residential buildings, buildings and constructions, machinery and equipment, transport equipment, and natural resources (agricultural land and sub-soil assets). For both residential and non-residential buildings, we differentiate between the value of the building and the underlying land. Finally, from 1995 onwards, we also calculate the book value of national wealth using a second definition that computes the balance sheet of corporations, both financial and non-financial entities, and adding their net wealth to the market value definition of national wealth.
As a general rule, our estimation procedure starts by accounting for the total value of a given asset in Spain (i.e., equity), which we then distribute into the different sectors owning it. For the most recent period of 1970 onwards, this approach is simple because most of the information that we employ already follows this decomposition. For the historical period, however, we need to determine the sector owning a particular asset, something that would be easier for those assets predominantly owned by a single sector (i.e., household-owned dwellings).
Finally, in addition to building sectoral balance sheets and different measures of national wealth, we also present a decomposition of the accumulation of national wealth into a volume effect (through saving) and a relative price effect (through capital gains or losses) in both multiplicative and additive forms. We do this by following the methodology proposed by Piketty and Zucman(2014) in the appendix of their paper, which relates the accumulation of national saving to the evolution of national wealth and finds the capital
gains component as a residual.
On the one hand, the multiplicative decomposition between two given years (t and t + 1) can be specified as follows:
Wt+1= (Wt+ St)(1 + qt), (2)
where Wt and Wt+1 are national wealth at times t and t + 1, respectively; St is the net-of-depreciation national saving over year t; and (1 + qt) is the residual component that
captures increases in the relative price of wealth with respect to consumption goods. To track the evolution of the wealth-to-income ratio (β), we then divide the previous equation by Yt+1 and obtain: βt+1= βt (1 + qt)(1 + gwt) 1 + gt , (3) where 1 + gt= Yt+1 Yt , 1 + gwt = 1 + st
βt and st stands for the net-of-depreciation saving rate
of Yt in year t.
In addition, we go one step beyond, and conduct this decomposition for housing and non-housing wealth. To do this, we start from the definition of national wealth as the sum of domestic non-financial assets plus net foreign wealth: WN = AN F + N F W , which
we further decompose into housing and non-housing wealth: WN = WH + WN H. In this
expression, housing wealth is the market value of dwellings, while non-housing wealth is the sum of other types of capital and net foreign wealth. Similarly, we decompose national savings into domestic investment (net of depreciation) and foreign savings: SN = I + SF, which then we decompose into housing investment and non-housing national savings:
SN = IH + SN H. Consequently, each component of national savings is mapped to its
corresponding component in national wealth. We run equation (3) separately for each of these two components of national wealth:
βi,t+1= βi,t
(1 + qi,t)(1 + gwi,t)
1 + gi,t
, (4)
where i stands for housing or non-housing national wealth.2
On the other hand, the additive decomposition between two given years (t and t + 1), can be specified as follows:
Wt+1= Wt+ St,t+1+ KGt,t+1, (5)
where Wt and Wt+1 are national wealth at times t and t + 1, respectively; St,t+1 is the
total savings flow between years t and t + 1; and KGt,t+1is the total capital gains or losses
between years t and t + 1. To track the evolution of the wealth-to-income ratio (β), we then divide the previous equation by Yt+1 and obtain:
βt+1= βini+ βsav+ βkg (6)
where βini = Wt
Yt+1 is the component coming from initial wealth, and βsav =
St,t+1
Yt+1 and
βkg = KGYt+1t,t+1 are the components coming from savings flows and capital gains or losses,
respectively.
Furthermore, in line with the multiplicative form, we go one step beyond and carry this decomposition for housing, other types of capital, and foreign wealth.3 The additive decomposition has the advantage of allowing us to disentangle the fraction of savings and capital gains that each component represents in the total, which is very relevant in explaining the accumulation of national wealth in Spain over time. Thus, we run equation (6) separately for each of these three components of national wealth:
2
Ideally, we would have liked to further decompose non-housing wealth into other types of capital and net foreign wealth. However, the multiplicative decomposition of wealth accumulation is based on the geometric averages of growth rates, which are only meaningful when wealth stocks take positive values. This is not the case for net foreign wealth in Spain.
3
Note that in this case, we do not have the limitations mentioned for the multiplicative decomposition and can split non-housing wealth between other types of capital and foreign wealth.
βi,t+1= βi,ini+ βi,sav+ βi,kg (7)
where i stands for housing, other types of capital, or foreign wealth.
While the results from this study use the market value definition of national wealth, in the appendix, we present the same analysis under the book value definition and the results are quite similar.
3.1 Non-financial assets
When computing non-financial assets, we follow a different approach for produced assets (buildings, machinery, and equipment) from that for non-produced assets (land and other natural resources). Agricultural land and housing, which clearly constitute the two most important asset components in the long run, are estimated through the census method, which multiplies the observed quantities (land areas or housing stock) by representative unit prices. In this basic procedure, both wealth aggregates include the value of the underlying land and produced assets (cultivated crops and dwellings, respectively). Our housing wealth series is somewhat lower than that obtained byNaredo et al. (2008). Instead of using the housing wealth series from the Bank of Spain, we combine and adjust the different available sources on housing prices (Bank of Spain, IVIE, and the Ministry of Public Works) to produce a more precise estimate.
In a second step, and following ESA standards (European Union (2013), p76), we estimate the stock of all produced assets in Spain based on the perpetual inventory method. This method requires an initial value for the stock of an asset, the service life of this asset type, together with investment flows and investment prices. Taking the change in the capital stock between two given years (t and t + 1) as an example, this method starts from an initial capital stock of t (Ct), to which we add investment flow in t + 1 (It+1), and
the depreciation rate of existing capital, we can express the perpetual inventory method in the following form: Ct+1 = Ct+ It+1− δ(Ct+It+12 ).
In practice, we implement the perpetual inventory method for 1850-2014 using data on investment flows and investment prices for four groups of assets: dwellings, other con-structions, machinery and equipment, and transport equipment. However, we only provide results from 1901 onwards, the period for which we can also estimate non-produced assets. We are not the first to use this type of approach to reconstruct produced assets in Spain, and we benefited greatly from previous analyses. Most notably, Prados de la Escosura and Rosés (2010) estimate the stock of produced assets for the same four asset categories for 1850-2000, while Mas Ivars et al.(2000) and the group of researchers at the IVIE institute (Mas et al.(2005),Cucarella Tormo and Mas Ivars(2009),Mas Ivars et al. (2015)) decompose this stock into 17 categories from 1964 onwards. However, we compute our own estimate for two reasons: first, to incorporate the latest recommendations from theOECD(2009) on the use of geometric patterns of depreciation (which differ from Roses and Prados de la Escosura’s approach), and second, to include the most recent data on Spain’s historical national accounts from Prados de la Escosura(2016a), which revised its previous series (Prados de la Escosura (2003)) with a new interpolation method. As a robustness check, we present the series of produced assets using the same depreciation pat-tern as Prados de la Escosura and Rosés(2010) in the methodological appendix. Overall, both approaches follow a similar trend, but the levels are about 25% lower in our bench-mark series. Nonetheless, when computing the total book value of national wealth, both approaches show very close levels.
The only assets that we cannot calculate by either the census-like estimate or the perpetual inventory method are subsoil assets. Historically, their importance for the Span-ish case has been very limited compared to other countries. Oil and natural gas reserves have been almost nonexistent (Tortella et al. (2003), Díaz Fernández (2014)), and only mining and quarries have had some minor contribution to Spain’s total production.
fortunately, no data exist for the volume of these reserves, so we multiply the value added from the mining and quarry industries by a factor of six. The implicit assumption is that one third of this value is the return on subsoil assets, with the remaining two thirds being the return on labor and produced capital, and that the return on these assets is constant at the 5.5% level (or one third divided by six). This procedure is highly conjectural, but given that the value-added from these industries has been below 2% of Spain’s GDP, any inaccuracy should have an almost negligible effect on our national wealth series.
The third step is to estimate (or disentangle) the value of the land below the build-ings. Following OECD and Eurostat (2015) recommendations, we start by decomposing our census-like estimate of housing using the residual approach. This is the same procedure followed by Davis and Heathcote (2007) to decompose the value of housing in the US for 1930-2000. Through this method, we calculate the value of land by deducting dwellings from the total value of the housing stock. Next, we compute the value of land underlying non-residential buildings, for which we count using an estimate of its structure obtained from the perpetual inventory method. We do this based on recent cadastral records of the total value of residential and non-residential buildings, which allows us to impute the relative weight of land in non-residential buildings with respect to residential ones.
In a fourth step, we determine the ownership by different institutional sectors on the stock of non-financial assets. Since the historical data on investment flows employed to estimate Spain’s produced assets are not decomposed by institutional sector, we start by imputing households’ share over the two most important assets of agricultural land and housing directly based on administrative records. We then calculate the unincorporated business assets owned by the household sector, taking as a starting point the results of the Survey of Household Finances (Banco de España 2002-2014), and then upgrading the declared values to account for undervaluation and top-coding. We extend the results until the early 1980s by assuming a similar evolution as the assets of non-financial corporations (Banco de España 1982-2014). For the public sector, we useMas Ivars et al.(2015)’s series
on government produced assets, and add the value of the underlying land and forests. In principle, all other non-financial assets are attributed to the corporate sector as a residual, although, as noted previously, after 1995, we can also reconstruct the market value of non-financial assets owned by Spanish corporations using data from the Central Balance Sheet Data Office of the Bank of Spain.
3.2 Financial assets
Providing consistent series on the net financial wealth for the public, personal, and foreign sectors since the early twentieth century was done using different sources. For all three sectors, reconstructing financial assets and liabilities from 1970 to the present is mostly a straightforward exercise based on the reported figures in the Financial Accounts of the Bank of Spain. Our main adjustment, as we detail below, is by providing the first complete estimate of offshore wealth.
Reconstructing the financial position for the rest of the twentieth century is a far more complex process given the lack of consistent estimates. Our calculations for the personal sector are based on a two-fold operation. First, we calculate the aggregate market value of each asset type, something that is simpler for claims (currency, deposits, loans, etc.) assessed at their nominal value than for other assets (bonds and shares) that are valued at the prevailing market prices. The second step involves computing households’ share by deducting the holdings of other institutional sectors (mostly corporations or the public sector) using a wide variety of auxiliary accounts (financial yearbooks, balance sheets of banking and insurance companies, government accounts, etc.).
To derive offshore wealth, we mainly use data from Zucman (2013, 2014) for 1999-2014 and the unique information recorded since 2012 by tax authorities on the assets held abroad by Spanish residents, classified by asset type (real estate, stocks, investment funds, deposits, etc.) and country of location. We then extrapolate the series backwards in time using the total value of offshore wealth, which flourished during the 1991 tax amnesty,
and also by including the estimates on financial assets held in offshore havens provided by Zucman (2015). Nonetheless, due to the uncertainties related to these calculations, we do not include offshore assets in our benchmark series and only present them when decomposing total financial assets and the net foreign asset position.
Overall, our results on households’ financial position benefited greatly from the im-mense research by previous scholars and to the relative high quality of some Spanish historical sources. For example, two outstanding examples of very detailed sources that are normally unavailable in other countries are the statistics on corporate capital and the aggregate balance sheet of the banking sector published since the early 1920s. Addition-ally, Spain’s relative underdevelopment, and the fact that the country became increasingly detached from the world economy since the First World War made our calculations sim-pler. In many ways, it is easier to estimate household financial wealth in the past than in the present since the ownership structure is simpler, with less financial intermediation and cross-border positions.
Nonetheless, various problems should be noted. While the volume levels for each financial asset are generally well-covered, the depth and representativeness of market prices are below the desired level in some cases. One of the clearest cases occurs with households’ equity holdings, which includes shares traded through stock markets and those that are not. Quoted shares can be valued at their prevailing market prices using the available sources gathered by historians on the Madrid Stock Exchange, but for non-listed firms, the standard procedure for historical periods is to apply the same ratio between the paid-up capital and the observable share price for listed companies. Thus, the number and relative performance of quoted corporations versus non-listed companies indirectly affects our calculations. In the future, more research could be done in this area.
A second set of problems deals with establishing households’ ownership over each asset class. In most cases, we make our calculations by quantifying the amount of an asset held by other institutional sectors and then assigning the residual to individuals. In
general, these computations are more accurate for some assets (e.g., public debt), given the great variety and detail of the original sources, than for other assets (i.e., credits and loans). If scholars provide more accurate estimates on any field in the future, our figures would be revised. Nonetheless, it should be noted that any change can have a secondary effect on the ownership ratio of other assets and liabilities, and thus it is possible to argue that the general trends are broadly reliable.
Estimates for the government sector before 1970 are much easier to produce. We proxy public net financial wealth by computing in the asset side of all state-owned equity holdings (e.g., the public railway company RENFE) and deducting as liabilities the market value of public debt. We are aware that these later results do not consider all financial assets and liabilities because they exclude, for example, cash holdings and institutional loans. Nonetheless, it seems clear that as one goes further back in time, the two most relevant changes in the government’s financial position occur either from an increased role of the State in the corporate sector or due to an adjustment in the public debt stock.
Computing Spain’s net foreign wealth prior to 1970 cannot be done through the census-like method given that sources on the stock of foreign assets and liabilities are very scarce, and so we accumulate the current account balance and add the variation in foreign exchange reserves. This is a relatively widespread procedure since a surplus in the current account makes a country a net creditor to the rest of the world (and vice versa). However, the main drawback of this method is that it does not capture the relative change in assets prices owned by both residents and non-residents. In practical terms, our series are based on the results provided byPrados de la Escosura(2010) for 1850 to 1913. We then extend this same methodology for the following period, but adjusted with only the census-like estimate provided by the Bank of Spain on the net foreign assets for 1932 to 1934. Later, from 1935 onwards, we follow a similar approach and make a final adjustment to match the results with the net foreign asset position reported for 1970.
4
Results
This section presents the most important long-term trends in the evolution of wealth aggregates. As many scholars have done, we report most results as a share of national income. In this way, stocks are more easily interpretable in real terms and relative to the total income of Spanish residents.
4.1 Personal wealth
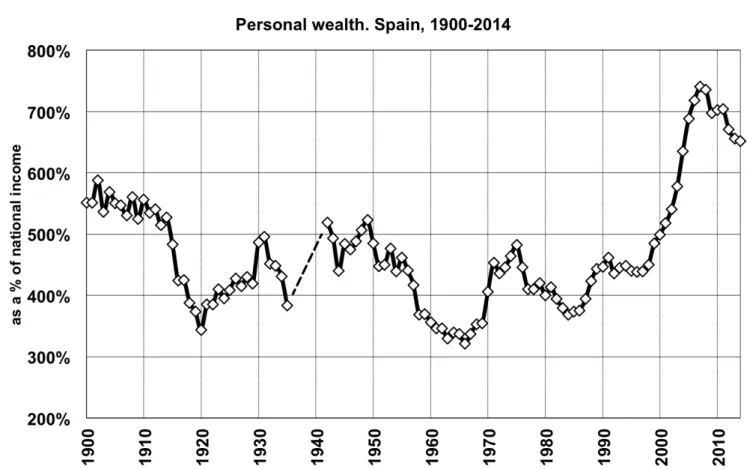
FigureA.1presents the ratio between personal wealth to national income since 1900. The results indicate that, for most of the sample period, the wealth of Spanish households usually stood between three and five times national income, although the recent economic boom led this ratio to record levels of nearly 700%. The main turning points of this uneven process of wealth growth and decline are easy to spot. The personal wealth-to-income ratio stood at a relatively high level (around 5.5 times the national wealth-to-income) in the period before 1914, but economic growth fueled by Spanish neutrality during the First World War, combined with a short period of high inflation, led to a significant decline in the relative importance of wealth. From 1920 to 1935, the oscillations in net worth largely reflected the general evolution of the economy and the performance of asset prices. Wealth grew significantly during the twenties, but households suffered a significant shock in their balance sheets during the tumultuous 1930s. Then, the ratio between personal wealth to national income increased sharply after the Civil War. This paradox occurs because from 1935 to 1940, Spanish real national income fell precipitously (c. 16%), but wealth remained almost constant, as destruction was compensated for by the rise in land prices.
However, in a short time, the personal wealth to income ratio declined steadily and remained at their lowest levels in the late 1950s and 1960s. Thus, in a period of rapid industrialization, income and wealth grew mostly at the same pace, and it was only in the late 1960s and early 1970s, when there was a short upswing in asset prices, that they rapidly reverted with the economic crisis of the late 1970s. Finally, from the mid-1980s,
and especially during the housing boom after the turn of the century, personal wealth started to grow dramatically until it reached an unprecedented level (741%) in 2007. In 2014, the most recent year with available data, the personal wealth to national income ratio stood at 651%, a level similar to that in 2004 (652%).
The analysis of the personal wealth composition provides several key factors to ex-plain this evolution (Figure A.2). Overall, one of the most surprising facts is that non-financial assets, in particular, agricultural and housing land, have always represented the bulk of households’ assets. In aggregate, real assets constituted 74% of gross assets in 1900 and 80% in 2014. Behind this seeming continuity is a profound transformation. In the first decades of the century, the composition of Spanish personal wealth followed the conditions of an underdeveloped economy, as agricultural land and farm capital (livestock and machinery) were the main assets that individuals owned. Until the 1950s, the most important changes in the ratio of wealth to national income occurred as a by-product of the change in the relative share of agriculture in the economy and due to the evolution of land prices. However, the irreversible decline of agriculture that finally occurred in Spain from the mid-1950s onwards was matched, in a very short time, by successive real estate boom cycles that made housing the main component of private wealth. As FigureA.2shows, it is not the replacement cost of dwellings but the land underlying them that mostly determined the evolution of housing in the post-war decades. From this perspective, the evolution of Spanish household wealth over the twentieth century can be described as the transition from agricultural to residential land.
The significant weight of real assets should not conceal the equally remarkable trans-formation in the composition of households’ financial assets (Figure A.3). Until the Civil War, debt securities were the most important claim, with a share that fluctuated around 40 to 60% of gross financial assets. This fact attests not only to the prominence of public debt and railway debentures in relation to equity shares in capital markets (Hoyo Aparicio (2007)), but also implicitly to the investment preferences of wealthy families.
ering that wealth (particularly financial assets) was heavily concentrated (Alvaredo and Artola Blanco (2017)), and given that the banking system was largely underdeveloped and lacked any form of deposit insurance, it seemed normal for rich households to lend directly to the government or corporations. Unsurprisingly, the high inflation since 1936 constituted a major wealth shock, as the value of most fixed income securities was rapidly wiped out.
From the 1960s onwards, the composition of personal financial wealth in Spain started to resemble the conditions of a developed country. Banking deposits became the most widespread tool for channeling households’ savings and stock market fluctuations started to have a sizable impact on the net worth of families. Nonetheless, two noticeable trends are worth pointing out. First, in Spain, pension assets have had an almost residual weight until the present day. In short, the rise of an unfunded social security system since late Francoism, combined with an everlasting housing boom, has undoubtedly influenced how households accumulated and invested wealth. Second, after the end of Franco’s regime in 1978, Spain experienced a process of Financialization, which led to an exponential rise in offshore assets. In 2012, offshore assets amounted to 195 billion Euros, that is, 23% of both national income and net personal financial wealth. Interestingly, this estimate is higher than the 8% obtained by Zucman (2013) for all world countries. Hence, offshore assets constitute a non-negligible part of the portfolio of households in Spain and must be considered when analyzing the long-run evolution of wealth. This rise in offshore assets, together with the increase in the value of dwellings and financial assets, have pushed personal wealth concentration upwards since the late 1990s (Martínez-Toledano(2017)).
Figure A.4 shows the share of household liabilities as a percentage of national in-come. By any standard, private indebtedness stood at very low levels during the first half of the twentieth century (i.e., below 20% of national income), something that seems at odds with the fact that household balance sheets were relatively strong, and therefore individuals could have increased their leverage for investment purposes. However, as many
contemporaries and historians already pointed out (Carmona and Simpson (2003)), the main private asset at that time (agricultural land) was scarcely used as collateral to obtain a loan, given the associated high transaction costs. Thus, the development of household credit was closely connected with the real estate cycle. Loan activity took off in the mid-1960s, experienced a mild reduction with the late 1970s crisis, and then resumed a vigorous growth path until the 2010 peak.
4.2 Public wealth
Most scholars are normally interested in the state’s liabilities given that public debt can have a sizable impact on taxation and investment. However, properly assessing the government’s balance sheet also requires that we include all non-financial and financial assets. Additionally, following SNA and ESA guidelines, financial assets are to be valued at market prices, and thus liabilities are reduced if public debt trades at a discount to its nominal value. This particularity, combined with the fact that the government can rapidly increase its debt and have a negative net worth position for a long period of time, marks a clear distinction with respect to private agents.
FigureA.5 presents the liabilities and net worth of the government as a percentage of national income. Both measures tend to follow similar trends, indicating that changes in the debt stock were the main driving force behind the evolution of government wealth. At the start of the twentieth century, public debt stood at very high levels due to the dire state of Treasury finances, and, in particular, to chronic deficits, the loss of the last remnants of the colonial empire (Cuba and the Philippines became independent in 1898), and creditors’ demands for high interest rates following various default events (Comín (2012)). Public liabilities gradually decreased thereafter, favored by a reduction in the debt burden through tax increases and inflation during the First World War. Later, during Franco’s dictatorship (1939-1975), the government balance sheet improved sharply, mostly driven by the irresistible decline in the debt burden caused by financial repression and
inflation (Comín (2015)). The last decades were marked by a two-fold increase in public debt, first during the 1980s and early 1990s, and second after the recent economic crisis. Public liabilities in relation to national income (134%) currently stand at their highest point since the late nineteenth century.
FigureA.6shows the evolution of government assets by differentiating between non-produced (land) and non-produced assets (infrastructure, buildings, etc.), plus financial claims (equity, loans, cash, etc.). For a long-term analysis, it seems convenient to analyze each category separately. Agricultural and forestland may now seem purely anecdotal for public finances, but they truly constituted one of the most important assets during the first half of the twentieth century. The subsequent fall in the share of publicly owned land has largely reflected the relative decline of the primary sector, although it is worth remembering that even now the government owns approximately one quarter of all agricultural land in Spain. Public capital has clearly been the most important government asset in the long term. As Mas Ivars et al. (2015) explain, public investment stayed at low levels during the first half of the twentieth century, and, if one excludes the immediate post-war years, the public capital stock relative to national income experienced a slight decline during this period. Afterwards, the growth in infrastructure spending and the rise of the welfare state since the 1970s propelled a sustained rise in the ratio of public capital to national income. State-owned financial assets were negligible before the Civil War, but equity holdings started to grow rapidly from 1940 onwards, driven by Franco’s decision to nationalize some key industries (railways and telecommunications) and promote new industrial enterprises (Carreras et al.(2000)). Privatization of government-owned companies in the 1990s paved the way for a retreat from economic intervention, but even now, the state owns equity holdings in some very profitable industries.
4.3 National wealth
To the best of our knowledge, this is the first study presenting results on national wealth from both book value and market value perspectives, and covering a period of over a century. Specifically, national wealth is measured as the aggregate of personal and public net worth, the market value definition, or as the stock of domestic non-financial assets plus the net foreign position, the book value approach. We also provide a variant metric of the book value approach by computing non-financial assets from corporate balance sheets. Overall, all three series show a very close evolution over this long period (Figure A.7). The national wealth to income ratio stood in a relatively close range during the twentieth century, between 400 and 500%, until the real estate boom of the early 2000s led to an unprecedented rise to almost 800% in 2007.
In Spain, this close resemblance can be explained by the composition and ownership trends in the stock of domestic non-financial assets. As Figure A.8shows, from a balance sheet perspective, the major transformation in Spain over the twentieth century involved the transition from an agrarian-based economy towards one driven by real estate. In particular, land, both agricultural and that underlying buildings, has been key in explaining the evolution of national wealth. On the contrary, other produced assets–infrastructure, equipment, and machinery–constitute a small residual, both in the present and in the past. Furthermore, as these two main assets (agricultural land and housing) were predominantly owned by households, differences in the measurement of national wealth from a book value or market value perspective, due to the mismeasurement of government or corporate assets, remains a relatively minor issue.
Nonetheless, the discrepancies between both metrics of national wealth shed light on the major methodological challenges that scholars face. One is related to the difficulties of calculating the net foreign wealth and its indirect impact on national wealth when added to the stock of non-financial assets. The results concerning Spain’s net foreign asset position (Figure A.9) show that it was broadly balanced during most of the period, but with the
noticeable exception of the initial and ending periods (1850-1913 and 1990s-2015), when the country was heavily dependent on foreign finance. The country’s high indebtedness during the late nineteenth century is especially remarkable given that although Spain still held some colonies (Cuba, Puerto Rico, and the Philippines), it depended heavily on foreigners to finance both the increasing public debt and the first wave of capital investment (railways and mining). Overall, although we are confident that our methods and sources provide the main trends in a correct manner, we should point out that computing net foreign wealth before 1970 through the accumulation of current account flows cannot fully account for the changes in the market value of foreign assets and liabilities. Also, as FigureA.9shows, our calculations for households’ assets in tax havens can have a significant impact on Spain’s international position. Clearly, compiling better data on offshore assets could provide a clearer perspective on this matter in the future.
The other methodological concern related to the reconstruction of a national bal-ance sheet concerns the use of either the market or book value approach. In Spain, the results show that the level and trends are similar, thereby suggesting that the book value estimate through the perpetual inventory method correctly approximates the evolution of non-financial assets. In addition, these findings are consistent with the narrative of Spain’s economic performance over this period. In the early 1970s, corporate equities boomed to unprecedented levels, turning corporate wealth negative, while in the late 1970s and through the 1980s, corporations experienced a prolonged period of low equity valuations due to the political uncertainty driven by the transition from Franco’s dictatorship to democracy and a sharp economic crisis. From this perspective, Tobin’s Q values differ due to the asymmetric evolution of equity and non-equity markets, and not only due to methodological differences in the measurement of corporate non-financial assets.
Nevertheless, a note of caution is needed before extending our findings to other countries. Although we follow the latest recommendations on the use of the perpetual inventory method (OECD(2009)), these are not yet harmonized at the international level
by the SNA, implying that important methodological differences persist in the valuation of fixed assets across countries. In addition, and more importantly, this study benefits from the outstanding reconstruction of Spain’s historical national accounts by Prados de la Escosura (2016a) for 1850-2014. In particular, Prados de la Escosura proposes an inter-polation method for splicing historical national accounts to overcome the problems of the conventional retropolation approach, which overstates the level of investment and of other components of GDP in the past, and underestimates their growth over time (Prados de la Escosura (2016b)). Thus, the perpetual inventory method with retropolated investment series employed in studies of most countries artificially inflates the initial stock of fixed assets, showing a flatter later development. Certainly, measuring corporate wealth is a delicate and complex matter that deserves further research.
In addition, we investigate whether the long-term accumulation of national wealth was determined by new savings (volume effect) or by changes in the relative price of wealth with respect to income (capital gains effect). Table B.1 shows the results for different periods relevant for an international comparison. We present this analysis for the market value national wealth series, the results of which are practically identical to those of the book value results given their close resemblance over the long run. From 1900 to 2010, the annual growth of national wealth was 3.1%. In turn, we can decompose this trend into a volume effect of 1.6% and a capital gains effect (net of war destruction) of 1.5%. In other words, the fact that 51% of the total growth in national wealth in the very long-term comes through savings confirms the conventional wisdom on the matter. However, that capital gains accounted for the remaining 49% is a factor that has not been sufficiently studied.
When dividing this era into two main sub-periods (1900-1950 and 1950-2010), it seems evident that capital gains had an opposite impact. From 1900 to 1950, national wealth grew very modestly in real terms (1%), resulting in a slight increase in the wealth to-income ratio from 508% to 536%. The savings-induced effect accounted for 0.8% of the real wealth accumulation, while capital gains accounted for 0.1%. On the contrary,
the 1950-2010 years were characterized by a strong increase in the wealth-to-income ratios boosted by capital gains. National income grew at a remarkable rate (4.2%) during this period, but was outpaced by an even stronger growth in national wealth (4.8%). As opposed to previous decades, capital gains had a positive role in national wealth accumulation in these years, accounting for 55% of the growth.
To provide a more in-depth analysis, we divide national wealth between housing and non-housing national wealth, and then calculate the savings rate and capital gains for both sub-sectors (Table B.1). The results show some remarkable trends. During the 1950-2010 period, the annual growth rate of housing wealth (6.3%) was significantly larger than that for the rest of the economy (3.2%). Hence, investment forces only cannot explain this sharp divergence. Wealth growth in the housing sector induced through savings (2.4%) was similar to the rate observed in the non-housing sector (2%). The major difference thus relates to the growing importance of capital gains in housing wealth, which explain 61% of wealth accumulation in this sub-sector since 1950. Furthermore, when dividing this era into two periods (1950-1980, 1980-2010), capital gains played an increasing role in the housing stock. The rise in real house prices constituted 52% of the wealth accumulation from 1950 to 1980, but then surged to 73% with the most recent boom.
Table B.2 summarizes these trends relative to the long-term evolution of wealth in Spain. As noted previously, the most outstanding fact relates to the important role of capital gains, which in turn can be explained by changes in the prices of farmland and housing. Initially, the capital losses (-1%) in other types of capital from 1900 to 1950 were driven by the falling value in agricultural land, particularly during the First World War years. Later, from 1950 to 2010, Spain experienced a period of rapid growth and industrialization, which came together with higher rates of saving and, consequently a new wave of investment. However, in this new context, asset price variations in the housing market played a fundamental role in the rising value of national wealth, to the point that rising housing prices explain 85% of the capital gains observed since 1950. No matter which
metric is chosen, housing has become the most important driver of Spain’s balance sheet.
5
International Comparison
In this section, we put our results for Spain in an international perspective. We mostly focus on long-term dynamics and compare our results to those for other countries published by Piketty and Zucman (2014) and Waldenström (2017). Overall, our findings for Spain coincide in broad terms with the general trends in other countries, but some notable differences are worth pointing out. One of the most striking results from Piketty and Zucman (2014) is that European economies followed a marked U-shaped evolution in their wealth-to-income ratios over the twentieth century. In "New world" countries (Canada and the US), on the contrary, the trend is much smoother (fluctuating around 3 to 5 times the national income), but still shows a similar U-shaped pattern.
As Figure A.11 shows, Spain is significantly different. It started from lower values than core European countries (5 to 5.5 times the national income as opposed to 6 to 7 times in these countries), and then followed a significant decrease during the World War I years. Contrary to other countries, Spain’s national wealth fluctuated for the rest of the century at relatively high values, between 4 and 5 times the national income; only from the late 1990s did wealth-to-income ratios start a fast-growing trend, which concluded in a striking increase during the 2000s. From this perspective, a J-shaped curve may represent better the broad evolution of Spain since 1900 than a U-shaped figure.
The smoother evolution and the higher levels of Spain’s wealth over the twentieth century make it closer to "New world" countries than to other European economies. How-ever, some very different factors explain this seemingly similar evolution. In Spain, the long-term dynamics of national wealth were mostly dictated by the evolution of two real assets, agricultural land and housing, which represented an almost constant 60 to 70% of the total non-financial assets. On the contrary, in other countries, the influence of "pure"
productive assets (i.e., machinery, buildings and construction, and equipment) played a larger role.
FiguresA.12andA.13depict the evolution of agricultural land and housing as a per-centage of national income, respectively. The first shows how the share of agricultural land in Spain ultimately followed a similar long-term decline as in other European economies, but with some delay, which was exacerbated by the partial re-ruralization in the 1940s. This evolution is consistent with the latecomer dimension of Spain, with agriculture playing a large role well into the twentieth century. The second figure shows that housing wealth had a relatively similar weight as in other economies during the first half of the century, but rose much faster since the 1960s, attaining the highest share among countries with available data at present. Indeed, the evolution of these two assets determined the high values of Spain in the central decades of the twentieth century, a period in which these ra-tios reached their lowest levels in other advanced economies. Overall, these results indicate that land has played a much stronger role in the evolution of wealth in Spain compared to other advanced countries, since both agricultural and housing wealth are largely driven by this non-produced element.
Finally, in TableB.3we compare the decomposition of national wealth accumulation between the volume and capital gains effect during three periods (1900-2010, 1900-1950, and 1950-2010) and for countries with available data (France, the UK, Germany, Sweden, and the US). In the longest period (1900-2010), volume effects were the dominant force in total wealth accumulation for all countries. Spain’s case is very different, because capital gains explain 49% of the total accumulation of wealth in real terms over this period.
However, it seems preferable to take 1950 as a cut-off point given that most wealth-to-income ratios approached their lowest levels in this year. During the first half of the twentieth century, national wealth-to-income ratios were dominated by a price effect in core-European countries, as capital losses accounted for almost all of the decrease in the wealth-to-income ratios. On the contrary, savings explained a large part in the evolution of
national wealth in the US because this country did not suffer an external shock. The trend in Spain during these years is similar to that in core-European countries, as capital gains negatively impacted wealth accumulation, even if the absolute change in wealth-to-income was not as pronounced.
From 1950 to 2010, Spain shows the most remarkable differences. Savings explain a large part of wealth accumulation in France, Germany, Sweden, and the US, while capital gains are only a key driver of the accumulation of national wealth in the UK. Spain stands out at this respect because capital gains account for 55% of the total accumulation of national wealth. Some concerns can be raised when choosing 2010 as the end of the analysis, given that the housing bubble was in the first stages of a severe correction. An alternative decomposition for 1950-2014, which captures the fall in housing prices since the 2007 peak, yields very similar trends for Spain. The capital gains component is 52% of wealth accumulation. In both methods, the results confirm that capital gains had an important role in wealth accumulation in Spain during 1950-2014, with increasing asset prices having a much larger role than in other countries. As we argued, this is due to the extraordinary evolution of housing wealth in Spain with respect to other countries over the last decades.
6
Conclusion
This study reconstructs Spain’s national balance sheet since the beginning of the twentieth century to the present, under both the market value and book value definitions. We also present a new asset-specific decomposition of long-run movements in the value of wealth into a volume effect (through saving) and a price effect (capital gains or losses). Furthermore, we provide a new long-run series of Spain’s net foreign asset position that considers the growing importance of offshore assets.
Overall, the national wealth to income ratio followed a J-shaped curve during the
twentieth century, which differs from the U-shaped evolution that characterizes core-European economies. Another peculiarity of Spain is that agricultural land and housing have always represented the most important components of national and personal sector balance sheets. Contrary to other developed economies, price variations in these two assets played a significant role in shaping wealth accumulation, and can thus explain why capital gains constituted a fundamental driver in wealth accumulation in Spain in the very long term. The rise in asset prices became more important during 1950-2010, especially due to housing wealth, which accounts for 83% of total capital gains.
Our analysis points to three areas in which research on wealth can be developed in the future. First, we argue for the decisive importance of housing and agricultural land as the key drivers of Spanish national wealth, a fact that probably extends to other southern European economies and to most developing countries. From this perspective, further research is needed to understand the role of capital gains in the rise of national wealth of Spain (i.e., an annual growth rate of 1.5%) for 1900-2010, while this same factor played a negligible role in most other countries (with rates close to zero). Two potential explanations could be mismeasured investment and/or pure valuation effects in the agricultural and housing sectors (i.e., due to demographic changes, agglomeration effects, high taste for home ownership, or openness to capital markets following European integration, to name just a few candidates). Given that these assets are complex given that they combine a produced element (dwellings, crops, or improvements) with a non-produced one (land), it seems highly advisable to collect more specific information (statistics on prices, land quality, surveys, etc.) on a regular basis.
Second, the relatively similar results from the book and market value definitions of Spanish national wealth should not conceal that important methodological problems remain. More efforts and conceptual clarification are needed to determine whether dis-crepancies between these approaches can be traced to the estimate of fixed assets through the perpetual inventory method, or truly to the existence of a mismatch between corporate
assets at market and book value.
Third, as we argued, offshore assets can change the foreign asset position of a country significantly. Until now, the information available is quite poor and scholars must make some strong assumptions to provide consistent estimates. Hence, further cooperation be-tween national central banks, statistical offices, and tax agencies could provide the basis for a substantial improvement in the available data.
References
Alvaredo, F. and Artola Blanco, M. (2017). Wealth Concentration in Spain, 1900-2010. Local versus Global Forces. Working Paper, Paris School of Economics.
Banco Urquijo (1924). La Riqueza y el progreso de España. Banco Urquijo.
Barthe, A. (1917). Essai d’évaluation de la richesse de l’Espagne. Journal de la Societe de Statistique de Paris, 58:157–161.
Bonnet, O., Bono, P.-H., Chapelle, G., Wasmer, E., et al. (2014). Does housing capital contribute to inequality? a comment on Thomas Piketty’s Capital in the 21st Century. Working Paper, Sciences Po Paris.
Carmona, J. and Simpson, J. (2003). El laberinto de la agricultura española: instituciones, contratos y organización entre 1850 y 1936. Prensas Universitarias de Zaragoza.
Carreras, A., Prados de la Escosura, L., and Rosés, J. R. (2005). Renta y riqueza. In Carreras, A. and Tafunell, X., editors, Estadísticas históricas de España: siglo XIX-XX, pages 1297–1376. Fundacion BBVA.
Carreras, A., Tafunell, X., and Torres, E. (2000). The Rise and Decline of Spanish State-Owned Firms. In Toninelli, P. A., editor, The Rise and Fall of State-State-Owned Enterprise in the Western World, Comparative Perspectives in Business History, pages 208–236. Cambridge University Press.
Charalampidis, N. (2016). The National Wealth-Income Ratio in Greece, 1974-2013. Re-view of Income and Wealth.
Comín, F. (2012). Default, rescheduling and inflation: public debt crises in Spain during the 19th and 20th centuries. Revista de Historia Económica (New Series), 30(03):353– 390.
Comín, F. C. (2015). La deuda pública: el bálsamo financiero del régimen de Franco (1939-1975). Revista de Historia Industrial, pages 173–210.
Commission of the European Communities and Inter-Secretariat Working Group on Na-tional Accounts (1993). System of NaNa-tional Accounts 1993. InternaNa-tional Monetary Fund.
Cubel Montesinos, A. and Palafox, J. (1997). El stock de capital de la economía española, 1900-1958. Revista de historia industrial, pages 113–146.
Cucarella Tormo, V. and Mas Ivars, M. (2009). Series históricas de capital público en España y su distribución territorial (1900-2005). Fundacion BBVA.
Dabán Sánchez, T., Escribá Pérez, F. J., Murgui García, M. J., and Díaz, A. (2002). La base de datos BD.MORES. Revista de economía aplicada, 10(30):165–186.
Davies, J. B., Sandström, S., Shorrocks, A., and Wolff, E. N. (2011). The Level and Distribution of Global Household Wealth. The Economic Journal, 121(551):223–254.
Davis, M. A. and Heathcote, J. (2007). The price and quantity of residential land in the United States. Journal of Monetary Economics, 54(8):2595–2620.
Díaz, A. and Franjo, L. (2016). Capital goods, measured TFP and growth: The case of Spain. European Economic Review, 83:19–39.
Díaz Fernández, J. L. (2014). Los hidrocarburos en España: Cincuenta años de historia. Economía industrial, pages 103–115.
European Union (1996). European system of accounts. ESA 1995. Office for Official Pub-lications of the European Communities.
European Union (2013). European system of accounts. ESA 2010. Publications Office of the European Union.