HAL Id: cea-02265011
https://hal-cea.archives-ouvertes.fr/cea-02265011
Submitted on 8 Aug 2019
HAL is a multi-disciplinary open access
archive for the deposit and dissemination of
sci-entific research documents, whether they are
pub-lished or not. The documents may come from
teaching and research institutions in France or
abroad, or from public or private research centers.
L’archive ouverte pluridisciplinaire HAL, est
destinée au dépôt et à la diffusion de documents
scientifiques de niveau recherche, publiés ou non,
émanant des établissements d’enseignement et de
recherche français ou étrangers, des laboratoires
publics ou privés.
Massive star cluster formation and evolution in tidal
dwarf galaxies
Jérémy Fensch, Pierre-Alain Duc, Médéric Boquien, Debra M. Elmegreen,
Bruce G. Elmegreen, Frédéric Bournaud, Elias Brinks, Richard de Grijs,
Federico Lelli, Florent Renaud, et al.
To cite this version:
Jérémy Fensch, Pierre-Alain Duc, Médéric Boquien, Debra M. Elmegreen, Bruce G. Elmegreen, et al..
Massive star cluster formation and evolution in tidal dwarf galaxies. Astronomy and Astrophysics
-A&A, EDP Sciences, 2019, 628, pp.A60. �10.1051/0004-6361/201834403�. �cea-02265011�
A&A 628, A60 (2019) https://doi.org/10.1051/0004-6361/201834403 c ESO 2019
Astronomy
&
Astrophysics
Massive star cluster formation and evolution in tidal dwarf
galaxies
?
Jérémy Fensch
1,2, Pierre-Alain Duc
3,2, Médéric Boquien
4, Debra M. Elmegreen
5, Bruce G. Elmegreen
6,
Frédéric Bournaud
2, Elias Brinks
7, Richard de Grijs
8,9,10, Federico Lelli
1,
Florent Renaud
11, and Peter M. Weilbacher
121 European Southern Observatory, Karl-Schwarzschild-Str. 2, 85748 Garching, Germany
e-mail: [email protected], [email protected]
2 AIM, CEA, CNRS, Université Paris-Saclay, Université Paris Diderot, Sorbonne Paris Cité, 91191 Gif-sur-Yvette, France 3 Université de Strasbourg, CNRS, Observatoire astronomique de Strasbourg, UMR 7550, 67000 Strasbourg, France 4 Centro de Astronomía (CITEVA), Universidad de Antofagasta, Avenida Angamos 601, Antofagasta, Chile 5 Vassar College, Dept. of Physics and Astronomy, Poughkeepsie, NY, USA
6 IBM Research Division, T.J. Watson Research Center, 1101 Kitchawan Road, Yorktown Heights, NY 10598, USA 7 Centre for Astrophysics Research, School of Physics, Astronomy and Mathematics, University of Hertfordshire, Hatfield,
Herts AL10 9AB, UK
8 Department of Physics and Astronomy, Macquarie University, Balaclava Road, Sydney,
NSW 2109, Australia
9 Research Centre for Astronomy, Astrophysics and Astrophotonics, Macquarie University, Balaclava Road, Sydney,
NSW 2109, Australia
10 International Space Science Institute–Beijing, 1 Nanertiao, Zhongguancun, Hai Dian District, Beijing 100190, PR China 11 Lund Observatory, Department of Astronomy and Theoretical Physics, Box 43, 22100 Lund, Sweden
12 Leibniz-Institut für Astrophysik (AIP), An der Sternwarte 16, 14482 Potsdam, Germany
Received 8 October 2018/ Accepted 6 June 2019
ABSTRACT
Context. The formation of globular clusters remains an open debate. Dwarf starburst galaxies are efficient at forming young massive clusters with similar masses as globular clusters and may hold the key to understanding their formation.
Aims. We study star cluster formation in a tidal debris, including the vicinity of three tidal dwarf galaxies, in a massive gas-dominated collisional ring around NGC 5291. These dwarfs have physical parameters that differ significantly from local starbursting dwarfs. They are gas rich, highly turbulent, their gas metallicity is already enriched up to half solar values, and they are expected to be free of dark matter. The aim is to study massive star cluster formation in this as yet unexplored type of environment.
Methods. We used imaging from the Hubble Space Telescope using broadband filters that cover the wavelength range from the near-ultraviolet to the near-infrared. We determined the masses and ages of the cluster candidates by using the spectral energy distribution-fitting code CIGALE. We considered age-extinction degeneracy effects on the estimation of the physical parameters.
Results. We find that the tidal dwarf galaxies in the ring of NGC 5291 are forming star clusters with an average efficiency of ∼40%, which is similar to blue compact dwarf galaxies. We also find massive star clusters for which the photometry suggests that they were formed at the very birth of the tidal dwarf galaxies. These clusters have survived for several hundred million years. Therefore our study shows that extended tidal dwarf galaxies and compact clusters may be formed simultaneously. In the specific case observed here, the young star clusters are not massive enough to survive for a Hubble time. However, it may be speculated that similar objects at higher redshift, with a higher star formation rate, might form some of the long-lived globular clusters.
Key words. galaxies: dwarf – galaxies: irregular – galaxies: star clusters: general – galaxies: stellar content – galaxies: star formation – galaxies: interactions
1. Introduction
Globular clusters (GCs) are among the oldest stellar structures in the Universe. Their formation redshift is estimated to be around z = 2 − 6 based on their stellar population, but their forma-tion channels are still debated (see reviews byForbes et al. 2018;
Renaud 2018). In particular, the formation environment must be able to host very dense and massive gas clouds to allow the formation of these bound stellar clusters. Based on theoretical
? Photometry data are only available at the CDS via anonymous ftp
tocdsarc.u-strasbg.fr(130.79.128.5) or viahttp://cdsarc. u-strasbg.fr/viz-bin/qcat?J/A+A/628/A60
grounds, it has for instance been proposed that galaxy mergers at high redshift could be an important formation channel of current metal-rich GC populations (Ashman & Zepf 1992;Li & Gnedin 2014;Kim et al. 2018). Giant gas clumps in high-redshift gas-dominated galaxies could also host a favorable environment for GC formation (Shapiro et al. 2010;Kruijssen 2015). The metal-poor part of the GC populations is proposed to be formed in the high-redshift highly turbulent gas-rich dwarf galaxies, such as the little blue dots seen at redshifts 0.5−4 in the Hubble Frontier Fields (Elmegreen & Elmegreen 2017), which would be accreted, with their GC populations, onto more massive galaxies (Côté et al. 1998;Elmegreen et al. 2012a;Tonini 2013;
Renaud et al. 2017). Unfortunately, current instrumentation can-not probe the physical conditions of the GC birth environment at high redshifts, except for exceptional cases of strong grav-itational lenses (Vanzella et al. 2017a,b; Bouwens et al. 2017). Observational studies of star cluster formation have thus so far mainly focused on favorable environments for massive star clus-ter formation in the Local Universe.
Local dwarf galaxies are particularly interesting for the prob-lem of GC formation. In starbursting dwarfs, young massive star clusters (YMCs) with masses above 105M
and radii around
3 pc are typically found, which is in the mass and size range of GCs (see, e.g.,de Grijs et al. 2013;Hunter et al. 2016, and ref-erences therein). Furthermore, in local starbursting dwarf galax-ies, such as the blue compact dwarf galaxies (BCDGs), up to 50% of their current star formation rate (SFR) can occur in YMCs (see, e.g., Adamo et al. 2011). Finally, old evolved dwarf galaxies typically have a very large number of old GCs per unit luminosity, also called specific frequency(SN) defined
as the number of GCs per unit -15 absolute magnitude in the V-band (MV): SN= NGC× 100.4(MV+15). It is much larger for old
evolved dwarfs than for late-type galaxies and similar to mas-sive early-type galaxies (see, e.g., Lotz et al. 2004; Peng et al. 2008;Georgiev et al. 2010). Although the formation conditions of present-day YMCs and old GCs are most certainly signifi-cantly different, these observations suggest that dwarf galaxies provide a favorable environment for both the formation and the survival of massive star clusters.
To extend the parameter space of dwarf galaxy environ-ments, we present a study of massive star cluster formation and survival in dwarf galaxies that differ significantly from typ-ical starbursting galaxies: tidal dwarf galaxies (TDGs). These galaxies are formed from gas and stars originating from the out-skirts of a massive galaxy after a galaxy-galaxy interaction (see review byDuc et al. 1999). Because of this particular mode of formation, they are typically young and gas-dominated and are expected to be free of dark matter (DM). Most importantly, their gas content is pre-enriched in metals and may already have a metallicity of one-third to half solar. Thus, they deviate from the luminosity-metallicity diagram and have a significantly higher metallicity than starbursting dwarfs for a similar luminosity (see, e.g.,Weilbacher et al. 2003). Previous studies of the formation of tidal tails have shown that star clusters and TDGs may be able to form together in some cases (Knierman et al. 2003;Mullan et al. 2011). Possible examples of tidal dwarfs at redshifts of 0.5−1 were presented byElmegreen et al.(2007a). It should be noted that the merger frequency was much higher at high redshift so that their contribution to the GC and TDG formation may have been larger. However, mergers at high redshift seem to be much less efficient at triggering an enhancement of star forma-tion (Rodighiero et al. 2011;Perret et al. 2014;Lofthouse et al. 2017), probably because of their high gas fraction (Fensch et al. 2017). The formation of GCs and TDG in high-redshift galaxies still needs to be investigated.
The system studied in this paper is composed of young galaxies formed in collisional rather than in tidal debris. Even though they are thus not formally of tidal origin, they are also found in the halo of a more massive galaxy and share the same physical properties as bona fide TDGs. We therefore use the term TDGs for these galaxies as well. They are located in a huge HI ring (MHI> 1011M , Duc & Mirabel 1998) that was
expelled from the massive galaxy NGC 5291 (NED distance: 63.5 Mpc assuming the following cosmological parameters: h= 73,Ωm= 0.27, ΩΛ= 0.73, distance modulus of 34.0 mag), most
probably after an encounter with a bullet galaxy around 360 Myr
ago (Bournaud et al. 2007). This ring hosts four gravitationally bound objects with masses as high as 2 × 10⁹M
(Lelli et al.
2015), which is in the range of dwarf galaxies. These TDGs have a gas to stellar mass fraction of ∼50% (Bournaud et al. 2007; Lelli et al. 2015) and their spectral energy distribution (SED) is consistent with no stellar population older than 1 Gyr (Boquien et al. 2009). Their material has been pre-enriched inside the host galaxy: they typically show half-solar metallic-ity (Duc & Mirabel 1998;Fensch et al. 2016).
This unique system has an extensive wavelength coverage: 21 cm HI line observations with the Very Large Array (VLA;
Bournaud et al. 2007), molecular gas (Braine et al. 2001; Lelli et al., in prep.), far-infrared with Herschel (Boquien et al., in prep.), mid-infrared (IR) with Spitzer (Boquien et al. 2007), Hα with Fabry-Perot interferometry on the ESO 3.2m (Bournaud et al. 2004) and optical Integral Field Unit with the Multi Unit Spectroscopic Explorer (MUSE; Fensch et al. 2016) and far-and near-ultraviolet (UV) with the Galaxy Evolution Explorer (GALEX;Boquien et al. 2007). Radio and optical spectroscopy have shown the kinematical decoupling of the TDGs from the ring and their complex internal dynamics. MUSE has probed the variation in ionization processes throughout the most mas-sive TDG of this system. However, none of the previously used instruments had the spatial resolution to investigate the TDG substructures and star cluster population.
In this paper we present optical and near-IR imaging data from the Hubble Space Telescope (HST) that cover three of these TDGs. The pixel size in the optical is 0.0400, which corresponds
to 12 pc at the distance of NGC 5291 and is small enough to allow us to distinguish the expected YMCs that formed inside the dwarfs. We obtained broadband imaging covering a wave-length range from the near-UV to the near-IR. This allows us to derive the mass and age distributions of these TDG star cluster populations and study their formation and survival up to several hundred megayears in this particular environment.
We present the data acquisition and reduction in Sect. 2. The star cluster selection and photometry measurements are pre-sented in Sect. 3. The derivation of their physical parameters (masses and ages) is described in Sect.4. We discuss the cluster formation efficiency and cluster evolution in Sect. 5 and con-clude the paper in Sect.6.
2. Observation and data reduction
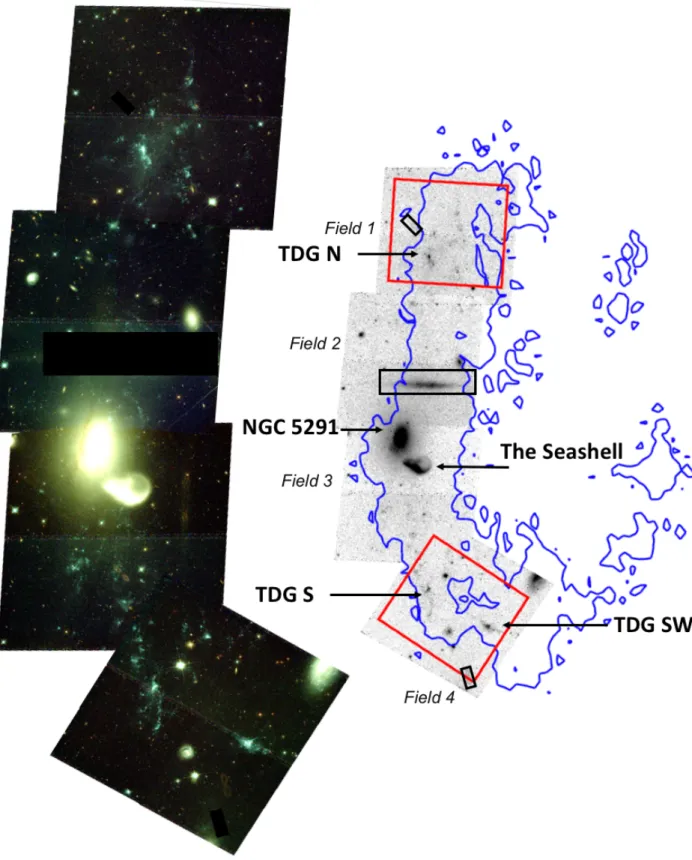
The collisional ring around NGC 5291 was observed with the WFC3 instrument on board the HST (Project ID 14727, PI: Duc). The location of the field of view and the collisional ring are shown in Fig. 1. We obtained photometry in the F336W, F475W, F606W, F814W, and F160W bands. As we discuss in Sect. 4, this set of filters was chosen for its ability to separate color effects from metallicity, age, and extinction in young star clusters (Anders et al. 2004). The respective exposure times are given in Table1. We used the product of the regular MultiDrizzle reduction pipeline (Koekemoer 2002). The pixel size is 0.0400for
F336W, F475W, F606W, and F814W. The pixel size is 0.1200for F160W. At the distance of NGC 5291, this corresponds to 12 pc and 36 pc, respectively.
Only fields 1 and 4 were observed in the F336W and F160W bands. The field of view of the F160W data is slightly differ-ent and is shown in the right part of Fig.1. The massive galaxy NGC 5291 and its companion (the Seashell galaxy, Duc et al. 1999) is visible in the top part of field 3, the TDG N in field 1, and the TDGs S and SW in field 4.
J. Fensch et al.: Star clusters in TDGs
Fig. 1.Left: composite-color HST image of the system using the F475W (blue), F606W (green), and F814W (red) filters. North is up and east is to the left. Each field of view is 49.55 kpc × 53.34 kpc. Three regions contaminated by strong artifacts were masked. They are shown with black rectangles in the right image. Right: F475W image. The blue contour encircles regions where the HI column density is higher than 1020
NHIcm−2(VLA data,Bournaud et al. 2007). The two F160W-band fields of view are shown by the red rectangles. The central galaxy NGC 5291,
the Seashell, and the three TDGs (N, S, and SW) are indicated by black arrows.
The right-hand side image shows instrument artifacts: a bright saturation shape in field 2 and the presence of figure eight-shaped reflection effects in fields 1 and 4. Furthermore, a small stripe of higher noise is visible in the middle of each field of
view: this is the location of the gap between the two UVIS CCDs of the camera, where we only have one exposure, and thus no cosmic ray removal. We allowed for any orientation to maxi-mize the chance of observability. Unfortunately, the gap fell on
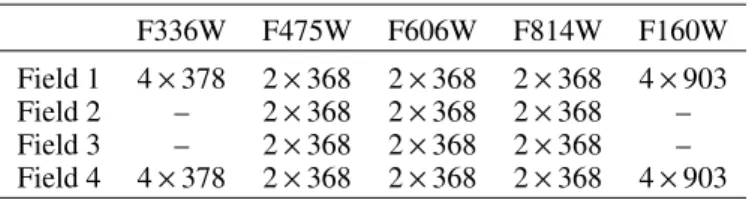
Table 1. Exposure times for each field and filters in the following format: number of exposures times the time in second for a single exposure. F336W F475W F606W F814W F160W Field 1 4 × 378 2 × 368 2 × 368 2 × 368 4 × 903 Field 2 – 2 × 368 2 × 368 2 × 368 – Field 3 – 2 × 368 2 × 368 2 × 368 – Field 4 4 × 378 2 × 368 2 × 368 2 × 368 4 × 903
both TDGs of field 4. Only fields 1 and 4 are considered in the remainder of the paper. Fields 2 and 3 will be the subject of a companion paper (Fensch et al., in prep.).
We used the HST image header keyword PHOTFNU to con-vert image units into Jansky. All magnitude values are given according to the AB system in the following, unless specified otherwise.
3. Cluster selection and photometry
We extracted the star cluster candidates using SExtractor (Bertin & Arnouts 1996) in the optical bands (F475W, F606W, and F814W). The images were convolved through a Mexican hat-type filter1 with a width of two pixels to enhance the con-trast with respect to the diffuse stellar light, and the detection threshold was set to 1.25σ for at least three adjacent pixels.
We only have two exposures for each of the three opti-cal bands (F475W, F606W, and F814W), therefore the standard pipeline cannot remove cosmic rays that are coincident on the two exposures. We proceeded to apply a first cosmic-ray sub-traction by matching the location of the sources on these three filters. Only sources detected on at least both the F606W and either F475W and/or F814W images were considered for sub-sequent analysis. We also rejected 13 sources that were part of the Gaia DR2 (Gaia Collaboration 2018) catalog with a nonzero parallax and proper motion, which are likely foreground stars. After this step, we have 826 detections. This catalog of detec-tions was then applied on the five bands to extract the photome-try of the detected clusters.
The crowdedness of the sources in the TDGs prevented us from using a standard aperture photometry method. Instead, we used point spread function (PSF) fitting using GALFIT (Peng et al. 2002,2010). We first removed the background light using the sigma-clipping method implemented in SExtractor. In order to remove the diffuse stellar light in the TDGs, we chose a tight mesh of 6 × 6 pixels, further smoothed with a 3 × 3 pixel kernel. The photometry was computed using PSF-fitting with GALFIT, using the PSF of the brightest unsaturated star avail-able in the field. To avoid blending issues, we restricted the location of the peak of the PSF to vary by less than 0.0800
com-pared to the center of the detection in the F606W band. Some extracted sources appeared extended and were not well fit in the F336W, F475W, F606W, and F814W bands. They were identi-fied by a high pixel value dispersion in the residual image. The pixel size in these bands is 12 pc. In the early evolutionary stages of YMCs (1−10 Myr), the ionized gas surrounding the cluster may have a radius of around 20 pc, with a dependence on age (see, e.g., Whitmore et al. 2011). We therefore expect to have barely resolved star clusters in these bands. For 40 sources out
1 We used the filters provided in the SExtractor repository of
astromatic.iap.fr.
of the 826 detected sources, we performed Sérsic photometry for proper subtraction. To avoid unrealistic fits, we constrained the half-light radius to be smaller than 3 pixels and a Sérsic index below 5. For consistency, we also fit the data without these con-straints, and the resulting values changed only by less than half a standard deviation. These sources were not resolved in the F160W image, which has a coarser resolution, therefore we con-tinued using PSF models for these sources. To ensure that the background subtraction method did not remove flux from either our point-like or extended sources, we verified the consistency within the error bars between the GALFIT method and an aper-ture photometry method for isolated sources. We used a 6-pixel radius and background estimation from the median background of eight other same-size apertures located around the source with an offset from the source of −13, 0, +13 pixels for both the ver-tical and horizontal directions. Some sources were too faint for the GALFIT subtraction to converge. For these we used aperture photometry and considered this value an upper limit to the flux.
The error on the flux is obtained by combination of the Pois-sonian noise from the source and the removed background, the to-pixel root mean square of the background, the pixel-to-pixel root mean square of the residuals, the systematic flux-dependent GALFIT flux uncertainty, and the read noise from WFC3.
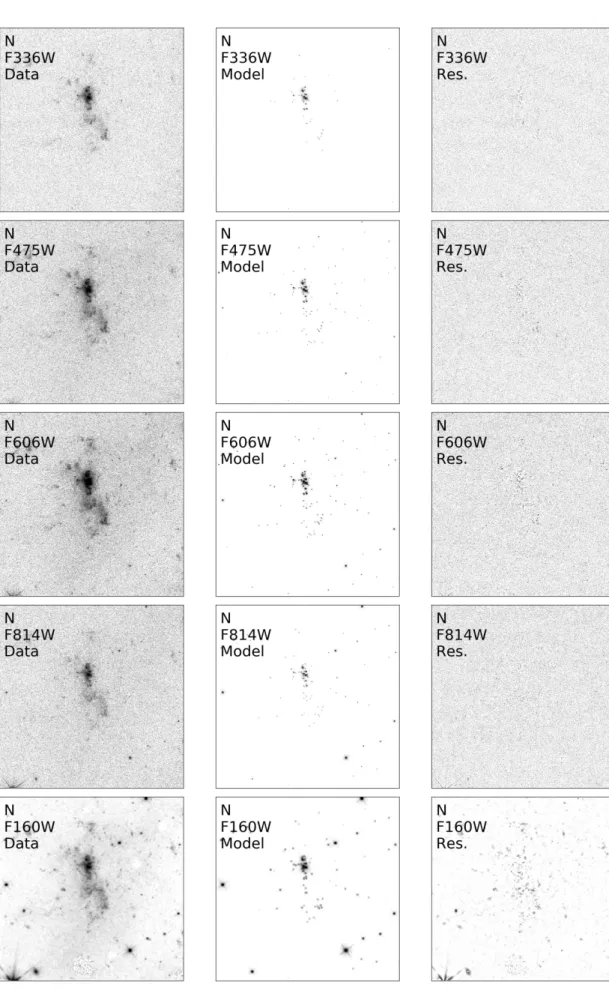
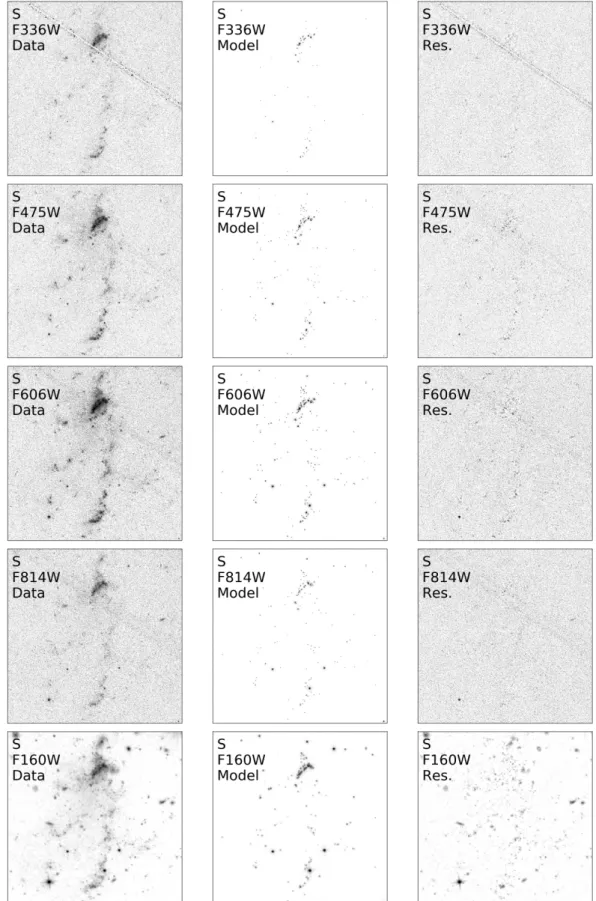
A comparison of the original image and the residual after background and source subtraction is shown in Fig. 2 for the three TDGs. In this figure some small extended stellar features remain on the location of star formation complexes. These fea-tures were not considered as detections by SExtractor because of their elongated shape through the Mexican hat filter. They were also not accounted for by the background subtraction because they are smaller than the background mesh. In our subsequent analysis we restrict ourselves to sources with a signal-to-noise ratio higher than three in at least four bands, which leaves us with 439 cluster candidates.
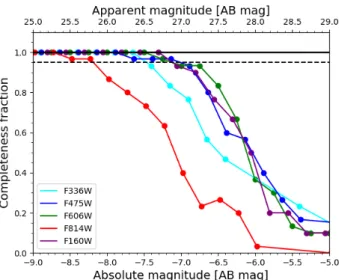
The completeness of our star cluster candidate extraction was computed by simulating point-like sources in the image using GALFIT and testing their detection and correct flux measure-ment using the same analysis as described above. A simulated source was considered recovered if detected by SExtractor and if its flux was recovered within 0.3 mag by GALFIT, as we accept a minimum signal-to-noise ratio down to 3 in a given filter. The completeness curves are shown in Fig.3. The 95% completeness limit is considered in the following.
4. Deriving cluster physical properties
4.1. SED fitting procedure
The set of filters we used was chosen for its ability to recover ages and extinction for young star clusters using SED fitting procedures (Anders et al. 2004). In this work, we used the SED fitting code CIGALE2 (Burgarella et al. 2005;Noll et al. 2009;
Giovannoli et al. 2011; Boquien et al. 2019). This code first computes a grid of flux models for a given input of discrete parameters from the stellar models ofBruzual & Charlot(2003), normalized to a fixed mass. In a second step, the code performs a χ2analysis between the source and the flux grid, including a normalization to obtain the mass corresponding to the fit.
We chose the following range of parameters:
Star formation history. We used theChabrier(2003) initial stellar mass function with lower and upper mass limits of 0.1
J. Fensch et al.: Star clusters in TDGs
Fig. 2.Data, model, and residual images for the TDG N. The two other TDGs are shown in AppendixA. For each filter we show the data in the left column, the cluster model in the middle column, and the background-subtracted residuals in the right column. From top to bottom: F336W, F475W, F606W, F814W, and F160W. We used the L.A. Cosmics algorithm (van Dokkum 2001) to remove the cosmic rays. North is up and east is to the left. The field of view covers 14.4 kpc × 14.4 kpc.
Fig. 3.Completeness curve of the star cluster detection algorithm for each filter. The horizontal dashed line at 0.95 shows the 95% complete-ness limit.
and 100 M , respectively. We modeled our clusters as a single
quasi-instantaneous burst of star formation with an exponential decay with a timescale of 0.1 Myr. To quantify the senstivity of the results on this parameter, we also modeled the star forma-tion burst with a timescale of 1 Myr. The small variaforma-tions in the resulting values are quantified in the following and do not affect our conclusions.
Age. To account for both very young star clusters and GCs, we used models from 1 Myr to 12 Gyr. We used an adaptive spac-ing to account for the rapid change in the spectra at young ages. In particular, we used one model per megayear from 1 to 20 Myr and one model per 5 Myr from 20 to 50 Myr. The weights of the fits depend on the age grid spacing, in order to have a flat age prior.
Metallicity. The metallicity of the ring is approximately con-stant at around half solar metallicity (Duc & Mirabel 1998;
Fensch et al. 2016). We therefore fixed the metallicity to Z = 0.008 to avoid degeneracies with age and extinction. The effect of changing the metallicity prior is discussed in the following sections.
Extinction. We used the Large Magellanic Cloud (LMC) extinction curve from Gordon et al. (2003) because it is most suitable for our half-solar metallicity. The extinction obtained from MUSE from the Balmer decrement and the LMC extinction curve gave extinction values of about AV= 0.6±0.2 mag
through-out the northern TDG on a spatial scale of 180 pc × 180 pc (Fensch et al. 2016). The NASA infrared science archive ser-vice3indicates a Milky Way extinction value in the line of sight
of NGC 5291 of about 0.15 mag. In order to stay conservative, we allowed for extinction ranging from AV= 0−2 mag.
Furthermore, we allowed the ionization parameter log U to vary between −4 and −2 with 0.5 dex steps, according to the range determined from emission line ratios with MUSE (see Fig. 10 inFensch et al. 2016). Finally, we allowed for a fraction of escaping Lyman continuum photons between 0% and 20% (dwarfs with strong outflows have a fraction of escaping Lyman continuum photons around 15%; see, e.g.,Bik et al. 2015). We assumed a gas density of 100 cm−3(Fensch et al. 2016).
3 https://irsa.ipac.caltech.edu/applications/DUST/
4.2. Physical parameters and degeneracies
We are interested in recovering good estimates of the ages and masses of the clusters. However, for our set of filters, there is a degeneracy between extinction and age, which is illustrated in Fig. 4. In the top panels we show see two models that fit the data well, with very different ages and extinction values. The cumulative probability density function shown in the bot-tom left panel shows two characteristic values for the age, and its rise is quite extended. The origin of this wide distribution is an age-extinction degeneracy: in the bottom right panel we show that both young and attenuated models and old and unattenuated models can reproduce our photometry for this particular cluster. Even though their metallicity is known, this degeneracy prevents us from deriving precise ages for all clusters.
To quantify this effect, we used a proxy for the width of the age probability distribution function (PDF) rage= F0.95/F0.05,
where Fxis the age for which the cumulative age PDF reaches
x. The extent between F0.95 and F0.05 is shown in the bottom
left panel of Fig.4. The particular cluster candidate shown in Fig.4has rage= 58. We note that emission-line information, such
as Hα emission mapping at the scale of the size of a star clus-ter (10−20 pc), would help break this degeneracy: ionized gas would classify a given cluster as unambigously young (see, e.g.,
de Grijs et al. 2013). However, we cannot distinguish the star clusters on the emission-line maps we have obtained with MUSE and Fabry-Perot interferometry (see Sect.1).
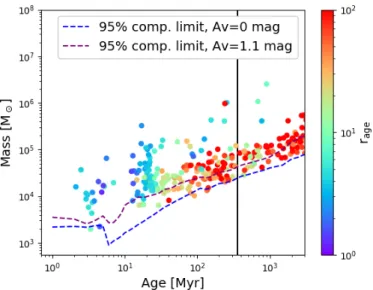
Figure5shows the retrieved masses and ages for the cluster candidates, where the width of their age PDF is color-coded. We note an increase in ragewith age, which is due to the slower
spec-tral evolution with age, and also a significant number sources for which rage> 50, which might be subject to degeneracies. In this
study we are not interested in old GCs. We therefore only con-sider clusters with retrieved age below 3 Gyr in Fig. 5. Older clusters, for which the fixed half-solar metallicity prior is not adapted for mass and age determination will be presented in a companion paper, along with the study of fields 2 and 3 (Fensch et al., in prep.).
Figure 5 also shows the completeness limit as obtained in Sect.3. These curves were obtained from the flux models com-puted by CIGALE. For each age, the curves show the minimum mass for which a cluster would have a 95% probability to be detected with a signal-to-noise ratio (S/N) above 3 in at least four bands. We show the completeness curves for two assumed extinctions, AV= 0 and 1.1 mag. This latter value was the
max-imum extinction obtained using the Balmer decrement from the field of the northern TDG in Fensch et al. (2016). Based on this figure, we assume that our sample is complete for clusters younger than 30 Myr above a mass of 1.5 × 10⁴M .
4.3. Young cluster mass function
In the following we explore the properties of the young clusters. In order to have a sufficient number of detections, we chose to consider only clusters younger than 30 Myr.
Because of the degeneracy effect, no complete sample can be compiled. Young and strongly attenuated clusters could in principle masquerade as old and unattenuated clusters. To define our sample, we used the shape of the age PDF. In particular, we write
P[age < X]= Z X
0
PDF(t) dt, (1)
with X in megayears, the probability that the cluster candidate is younger than X Myr.
J. Fensch et al.: Star clusters in TDGs
Fig. 4.Top left: example of the best fit for one cluster candidate. The retrieved physical parameters and the reduced χ2are given at the top of the
plot. Top right: best fit for the same cluster candidate when AV= 0 mag is imposed. Bottom left: cumulative age PDF for the cluster. The star shows
the best-fitting age. The blue dot shows the output value of CIGALE. Bottom right: normalized likelihood distribution for age and extinction for the given cluster candidate.
Fig. 5.Estimated mass-age distribution for the cluster candidates. The color indicates the width of the age PDF, as defined in the text. The two dashed lines indicates the 95% completeness limit in the age-mass plane, assuming a given extinction. The black line shows the estimated time of the interaction that created this system (see text).
In the following, we define our young cluster sample by adopting P[age < 40] > 0.5 and the modal value of the age PDF that is enclosed in [1 Myr, 30 Myr].
We used 40 Myr as the upper bound for the PDF integral because a limit of 30 Myr rejected clusters with ages between 20 and 30 Myr, for which a large portion of their PDFs extends beyond 30 Myr. We then chose a higher upper bound for the inte-gral calculation, and used the condition on the mode of the PDF to ensure that the highest likelihood was still reached within the [0,30] Myr interval. To quantify this effect, we used this sam-ple selection in association with the spectral models created by CIGALE with input ages between 20 and 40 Myr. Only 28% of the clusters with an input age in the range [20,30] Myr were included in our sample when we used 30 Myr as upper bound, while this fraction rose to 71% for 40 Myr as upper bound. The contamination fraction, that is, the fraction of models assigned to the sample that have ages in (30,40] Myr, is 0% in the first case and 6% in the second case. A limit of 40 Myr instead of 30 Myr in the definition of our sample therefore better represents the clusters that are genuinely younger than 30 Myr.
We discuss in Appendix B two other sample selections: a secure sample, defined by P[age < 40] > 0.9, and an inclusive sample defined by P[age < 40] > 0.1. The exact same analysis was performed on these two samples for comparison purposes.
Fig. 6. CMFs for the young cluster sample described in the text. The power-law fit is determined for bins with masses higher than 1.5 × 10⁴M
, shown by the black vertical line. The legend shows the
slope and uncertainty of the corresponding fit.
Because the first selection is very restrictive and the other includes clusters that are too old, this additional analysis gives an idea of the strict boundaries within which our result may vary.
Figure 6 shows the cluster mass function (CMF) for our young cluster sample. A power-law fit to the diagram for bins more massive than 1.5 × 10⁴M gives a slope of −1.16 ±
0.19 for the evolution of d log MdN with M. This gives dMdN =
dN
Md log M ∝ M
α, with α = −2.16 ± 0.19. The values obtained
for the lower metallicity prior (Z = 0.004) and for the 1 Myr timescale are consistent within the one-sigma uncertainty. The obtained mass distribution is consistent with a mass distribu-tion decreasing with a power slope of α ∼ −2, as many other studies of young star cluster formation have shown (see, e.g.,
Portegies Zwart et al. 2010). This suggests that the formation of star clusters in the gas ring and TDGs occurs in a similar fashion to that of the other studied environments. This can be interpreted as a legacy of the hierarchical collapse of gas clouds (see, e.g.,
Elmegreen & Efremov 1997).
4.4. Star cluster formation efficiency in the TDGs
The cluster formation efficiency (CFE) of galaxies can be char-acterized by CFRSFR, where CFR is the cluster formation rate (in M yr−1). It has been argued that galaxies follow a power-law
relation with positive index in the CFE and the SFR surface density (ΣSFR) plane (Larsen & Richtler 2000;Billett et al. 2002;
Goddard et al. 2010). A similar relation was derived on theo-retical grounds by Kruijssen (2012). However, Chandar et al.
(2017) claimed that the former empirical relation was driven by an underestimation of the CFR of both the LMC and the Small Magellanic Cloud (SMC) due to an inconsistent age range selection. In contrast, they found a constant value of the CFE of 24% ± 9%, independent ofΣSFR.
In order to compute the CFE for our system, we constructed our young cluster samples based on the same definition as above,
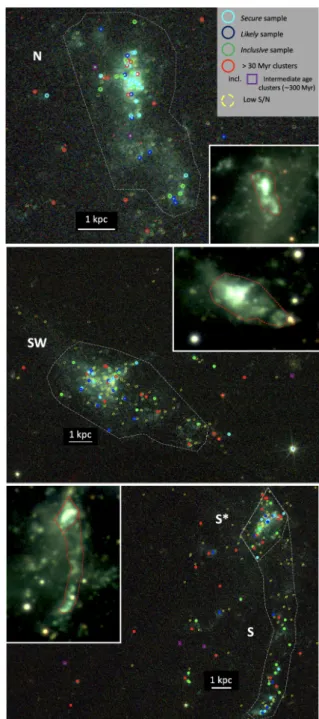
Fig. 7.True-color image of the three TDGs: NGC 5291N (top panel), NGC 5291SW (middle panel), and NGC 5291S (bottom panel). The definitions of the young sample, degenerate clusters, and the sample older than 30 Myr are given in the text. The intermediate clusters are part of the sample older than 30 Myr and are discussed in Sect.4.6. We also show detected clusters that do not have S /N > 3 in at least four bands as the low S/N sample. The dashed white contours show the area considered to computeΣSFR. Bottom panel: two contours that
are explained in the text. The inset shows a VRI image from FORS (Fensch et al. 2016), with the same contours. Only clusters inside the white contours are considered for the computation of the CFE.
but for each of the three TDGs. In order to limit the effects of degeneracies, we used as a minimum value for the fitting prior AV > 0.3 mag, which is justified by the extinction maps obtained
with MUSE by Fensch et al. (2016). We show the location of our young cluster sample in the three TDGs in Fig.7. We also show the detections that are degenerate and securely old (see definition in Sect.4.3). We also considered a smaller star cluster subsample for the S dwarf, shown in Fig.7, which we call S*
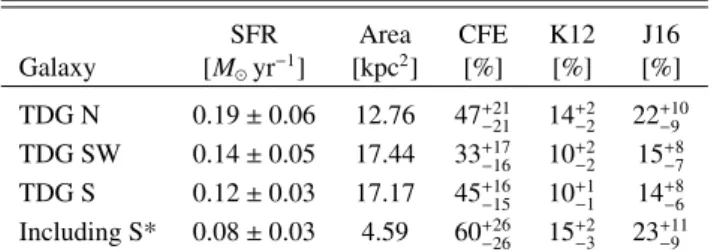
J. Fensch et al.: Star clusters in TDGs Table 2. SFR, area, and CFE for the TDGs.
SFR Area CFE K12 J16 Galaxy [M yr−1] [kpc2] [%] [%] [%] TDG N 0.19 ± 0.06 12.76 47+21−21 14+2−2 22+10−9 TDG SW 0.14 ± 0.05 17.44 33+17−16 10+2−2 15+8−7 TDG S 0.12 ± 0.03 17.17 45+16−15 10+1−1 14+8−6 Including S* 0.08 ± 0.03 4.59 60+26−26 15+2−3 23+11−9 Notes. The last two columns show the expectation of the CFE from theKruijssen(2012) andJohnson et al.(2016) models for the measured SFR surface density, labeled K12 and J16.
Fig. 8.Distribution of our TDGs in the CFE-ΣSFRplane. For the TDG
NGC 5291S we show two points, the full TDG (with lower CFE and ΣSFR) and only S*. The dataset ofGoddard et al.(2010) is shown in
black. The sample ofChandar et al.(2017) and their fit to their data is shown in purple. For the SMC and the LMC we only show the values computed by the latter reference (see text). In red are shown the BCDGs ofAdamo et al.(2011). The continuous blue line shows the prediction of the model byKruijssen(2012) (see text). The gray band shows a modified version of this model using theBigiel et al. (2008) relation (Johnson et al. 2016).
in the following. This is motivated by the elongated shape of this TDG, which suggests that TDG 5291S might be composed of two distinct objects, despite the apparent coherent HI rotation (Lelli et al. 2015).
Following previous studies on the CFE (see, e.g.,
Goddard et al. 2010; Adamo et al. 2011), we used the CMF to infer the total mass in clusters down to 102M
by forcing a
canonical power-law shape dMdN ∝ Mα, with α= −2 fit to the his-togram. This fixed index of −2 was also used in the studies we refer to in this section, and is also supported by the shape of the CMF covering the full cluster sample (see Fig. 6). The SFR was obtained from the Hα (Boquien et al. 2007), which used a Salpeter(1955) IMF, whereas our mass estimates were obtained using aChabrier(2003) IMF. We therefore multiplied the SFR obtained using the Hα by Boquien et al. (2007) by a factor 0.70 to account for the different flux ratio of SFR to Hα obtained for the two IMFs (see, e.g.,Kennicutt et al. 2009). We also corrected the SFR for the mean extinction measured in
Table 3. Significance, in standard deviations, of the offset of the data points compared to the three relations:Kruijssen(2012),Johnson et al. (2016), andChandar et al.(2017), K12, J16, and C17.
Galaxy K12 J16 C17 TDG N 1.6 1.1 1.0 TDG SW 1.3 1.0 0.5 TDG S 2.2 1.7 1.1 Including S* 1.7 1.3 1.3 TDG N+SW+S 3.8 3.1 2.5 TDG N+SW+S* 3.5 2.8 2.6
TDG N, AV= 0.6 mag (Fensch et al. 2016). The obtained values
of the CFE are summarized in Table 2. The lower metallicity prior (Z= 0.004) gives consistent results within the one-sigma uncertainty and changes the CFE values by less than 10%. The 1 Myr star formation timescale changes the CFE values by less than 3%.
To compare the TDGs with other star cluster forming galax-ies, we place these values in the CFE-ΣSFR plane in Fig. 8.
The TDGs are located in the same regime as the BCDGs, with CFE above 45% for TDG N and TDG S. They are located systematically above the empirical Chandar et al. (2017) rela-tion, but are consistent within 0.5 to 1.3σ.
In Fig.8 we show the current model and empirical predic-tions. The blue curve shows the model4 by Kruijssen (2012,
K12 in the following) for a gas velocity dispersion of 30 km s−1. We also show the version of the model calibrated with the
Bigiel et al. (2008) relation between the SFR and the gas den-sity (Johnson et al. 2016, J16). In purple we show the univer-sal value of 24% suggested byChandar et al.(2017, C17). The computed CFEs are systematically above these three relations. The significance of this deviation for the TDGs and the full sys-tem is measured with random draws of relation and data values, assuming Gaussian distributions. For the combined TDGs, this is equivalent to multiplying the probabilities that the CFE of each TDG has to be compatible with the relation. The significances are given in Table3. While the measurement of each TDGs dif-fers by less than 2.1σ of each relation, the combination of the TDG N, SW, and S is above these relations by 3.8σ for K12, 3σ for J16, and 2.5σ for C17. These numbers slightly change when S* is used instead of S in the sample. Our sample of TDGs is then significantly above the current model and empirical relations.
We used an age range [1−30] Myr, which is broader than that typically used in these studies ([1−10] Myr). We chose this range because there were not enough clusters younger than 10 Myr to properly measure the CFE. We did not correct for the mass evolution or destruction that may have happened, in particular cluster disruption by gas removal (infant mortality,
Boutloukos & Lamers 2003;Whitmore et al. 2007), which has a timescale of 10−40 Myr (Kroupa & Boily 2002;Fall et al. 2005;
Goodwin & Bastian 2006). This means that we are missing clus-ters that have been disrupted and mass that has been lost from the detected clusters. The fact that we did not correct for this effect suggests that we might be underestimating the CFE of our TDGs (see discussion in C17). Finally, we note that at the distance of NGC 5291, the data are contaminated by young star associ-ations that are unbound and did not have time to dissolve (see, e.g.,Messa et al. 2018). This unresolved process might lead to an overestimation of the computed CFE.
4 Model accessible at: https://wwwmpa.mpa-garching.mpg.de/
Fig. 9.Brightest cluster MV–SFR relation for different galaxy samples.
The NGC 5291S data point with the lowest SFR shows the value for S* only. The black line shows the fit of theLarsen(2002) sample. The dashed green line shows the maximum MV expected for a given SFR
if all the star formation occurs in clusters with a dMdN ∝ M−2power law
(Bastian 2008).
As explained in Sect.4.2, we also performed the same analy-sis on two different cluster samples with more restrictive or more relaxed age constraints. The analysis is presented in AppendixB. In particular, we introduce the secure sample, which only con-tains clusters that are almost not affected by degeneracies and have a narrow age PDF, thus underestimating the genuine sam-ple of clusters younger than 30 Myr. For this samsam-ple, the samsam-ple of TDGs (N, SW, S) is above the relations by 2.8σ for K12, 1.8σ for J16 and 1σ for C17. The fact that the CFE of the full sample is above the model relations of K12 by 2.8σ confirms that this mismatch is robust against the age selection procedure. How-ever, the CFE of the full sample of TDGs is only 1.8σ from the J16 relation and is consistent with the C17 relation within 1σ. The combination of the CFEs of the TDGs are thus not statisti-cally significantly above these two relations when this restricted sample alone is considered.
Finally, we combined bands with different PSF. We added the F160W as it provides a good filter combination to reduce degeneracies (Anders et al. 2004). However, the coarser spatial resolution of the F160W might lead to an overestimation of the photometry in this band (see, e.g.,Bastian et al. 2014, but with aperture photometry). This effect is discussed in Sect.5.1. 4.5. Brightest cluster – SFR relation
Larsen(2002) found a positive correlation between the V-band absolute magnitude (MV) of the brightest cluster versus the SFR
of the host, which was interpreted as a size-of-sample effect: the higher the SFR, the more clusters and thus the more likely high-mass clusters would be found. The location of the three TDGs and other cluster-forming systems in the MV–SFR plane
is shown in Fig.9. Our three TDGs are located within the intrin-sic scatter of the relation ofLarsen(2002). This suggests that the magnitude of the brightest cluster is a good tracer of the SFR for these systems, similar to what has generally been observed for star-forming galaxies.
Fig. 10.Masses and ages of our conservative sample of intermediate-age star clusters. The x-axis error bar shows the width between the first and last decile of the age PDF. The y-axis error bar shows the stan-dard deviation for the mass estimate. The vertical black line shows the formation time of the ring structure, ∼360 Myr, as determined by Bournaud et al.(2007).
Table 4. CFE values for the three TDGs, without the F160W band (sec-ond column) and significance in standard deviations of the offset of the data with respect to the models (three last columns).
Galaxy CFE [%] K12 J16 C17 TDG N 37+15−15 1.5 0.8 0.7 TDG SW 26+11−10 1.4 0.8 0.1 TDG S 33+14−14 1.6 1.2 0.5 including S* 46+25−25 1.2 0.8 0.8 TDG N+SW+S – 3.5 2.6 1.9 TDG N+SW+S* – 3.3 2.4 2.0
4.6. Presence of intermediate-age clusters
It is interesting to study whether the peculiar environment of NGC 5291 may allow for the survival of clusters over timescales of '100 Myr.Bournaud et al.(2007) estimated that the interac-tion that triggered the formainterac-tion of the ring occurred around 360 Myr ago. We showed in Sect. 4.2 and Fig. 5 that an age cannot be estimated with high precision. In Fig.5we show that some cluster candidates with an estimated age between 100 and 2000 Myr have a relatively low ragefor the inferred age, that is,
they are younger than 30 Myr. A high PDF is expected around these ages because the stellar spectrum does not change much in this part of the stellar evolution period. Some of these clusters might therefore have formed at the formation time of the ring and survived for several 100 Myr in this environment.
To construct a conservative sample of candidates with inter-mediate ages, we first selected clusters with P[50 < age < 2000] > 0.9. We chose an upper limit of 2000 Myr because the age PDFs can be quite extended for this age range (see Fig.5). We note that this selection does not change when we allow for an extended star formation history with an exponential decrease timescale of 1 or 5 Myr, compared with our fiducial value of 0.1 Myr, which was chosen to model a quasi-instantaneous burst. Moreover, we ensured that the photometry of these clus-ters is not consistent with them being old poor or metal-rich GCs from the GC system of NGC 5291. For this, we ran
J. Fensch et al.: Star clusters in TDGs
Fig. 11.Same legend as Fig.8. The analysis was made without consid-ering the F160W band.
CIGALE with a broader metallicity prior (Z can be 0.0004, 0.004, or 0.008, instead of only 0.008), and we ruled out clus-ters for which P[age > 2500] > 0.1. We ended up with seven clusters. Their ages and masses are shown in Fig.10. Their mass range is between 2 × 10⁴and 2 × 10⁵M
. Their location is shown
with purple squares in Fig.7. Three are located close to the TDG N, one is close to TDG SW, and three are close to TDG S.
Clusters with similar masses and ages have previously been observed in a number of dwarf galaxies (see, e.g.,
Larsen et al. 2004;de Grijs et al. 2013). However, their presence in NGC 5291 shows that massive star clusters can survive the very turbulent and gaseous environment of a tidal dwarf galaxy from its formation up to hundreds of million years.
5. Discussion
5.1. Effect of including the F160W band
In Sect.4.4we showed that two TDGs, N and S, have very high CFEs, with an average value of 42%. While it has been argued on theoretical grounds that star cluster formation should be more efficient in low-metallicity environments, all other factors being equal (Peebles 1984;Kimm et al. 2016), these metal-rich TDGs reach a similar CFE as metal-poor BCDGs.
As pointed out in Sect.4.4, the estimated masses could have been affected by an overestimation of the flux in the F160W band. We included the F160W filter to reduce the degenera-cies on the estimation of the age and mass of the clusters (Anders et al. 2004). However, this band has a coarser spatial resolution than the four others. The F160W band PSF has an FWHM of about 0.1800, while the four other bands have PSF
FWHMs of 0.0600. Some F160W flux measurements might have been contaminated by regions that are very close to the clusters and that are not included in the other bands, which might affect the derivation of the physical quantities (e.g.,Bastian et al. 2014, in the case of aperture photometry).
To test the effect of adding the F160W band, we removed it from the analysis for the measurement of the CFE. The CFEs we obtained are summarized in Table4. They are lower than those obtained with the five bands by typically 22%.
Fig. 12.Comparison between the mass estimation between the analysis including or excluding the F160W band. The blue points show clusters that are included as younger than 30 Myr only in the analysis without F160W. The red points show clusters that are included in this category only when the F160W band is included. The thick line shows the iden-tity function. The two dashed lines show the mass completeness limit.
In Fig.12we show the change in the mass estimation of the clusters that are considered as younger than 30 Myr and located in the TDGs. Of the clusters we that determined to be younger than 30 Myr, a few are estimated to be older than this limit when the F160W filter is excluded (five are higher than the com-pleteness limit) while others are estimated to be younger with the F160W band (eight above the limit). Moreover, while the estimated masses are very similar, there is a trend toward lower masses when the F160W band is excluded.
Figure11shows that even without the F160W band, the CFEs of the TDGs are systemically above the three relations from the literature. The significance of the discrepancies is computed in Table4. The full sample of TDGs (N, SW, and S) is 3.5σ and 2.6σ above the K12 and J16 relations, respectively, that is, with a cer-tainty higher than 99.5%. However, the offset with the C17 rela-tion is only 1.9σ. Thus, the exclusion of the F160W reduces the discrepancy between the data and the relations from the literature, which becomes statistically insignificant only for C17 (<2.5σ). This suggests that the discrepancy to the three relations from the literature is robust over the possible overestimation of the F160W band due to a coarser spatial resolution.
5.2. Origin of the high cluster formation efficiency
We showed in Sect.4.4that our sample of TDGs has high CFEs, above 30%, similar to what is observed for BCDGs. While it has been argued on theoretical grounds that star cluster forma-tion should be more efficient in low-metallicity environments, all other factors being equal (Peebles 1984;Kimm et al. 2016), these metal-rich TDGs reach a similar CFE as metal-poor BCDGs.
It is interesting to note that all galaxies from the literature whose CFE is higher than 20% are galaxies involved in an interaction of some sort, with the exception of the center of M 83 in the sample ofGoddard et al.(2010). It is also interesting to note that the late stages of mergers, while leading to similarΣSFR
as the early stages, trigger the formation of only a few clusters (Renaud et al. 2015), and therefore have a much lower CFE. We interpret this to mean that cluster formation is triggered by the onset of compressive turbulence that is triggered mainly during the early times of galaxy interaction.
Although the TDGs in NGC 5291 were not formed in bona fide merging galaxies, they are located in a gas-dominated envi-ronment and are probably not yet fully relaxed. It is thus possible that their dynamical state, in terms of compressive turbulence, is similar to that of interacting galaxies, possibly because of accre-tion from the gas ring (Fensch et al. 2016).
5.3. Evolution of the star cluster system
We showed in Sect. 4.6that some clusters could survive their birth environment for several 100 Myr. The fact that we could find some in the gaseous ring shows that we can expect the sur-vival of massive star clusters from the formation of the tidal dwarf galaxy to at least several 100 Myr.
The evolution of this specific star cluster system in the future is an open question. In the following, we consider that our clusters survived after gas expulsion and we do not consider their infant mortality rate, which is arises because the inter-nal feedback expels the gas and destabilizes the cluster. This rate has a timescale of 10−40 Myr (see Sect.4.3). We modeled the mass loss due to cluster evaporation during its relaxation as ∆M(t) = µevt, with µev the evaporation rate (Hénon 1961;
Fall & Zhang 2001;Jordán et al. 2007), which is given by µev= 345 M Gyr−1 ρ M pc−3 !1/2 , (2) where ρ= 3M/(8πR3
eff) is the half-mass density of the cluster.
M and Reff are its mass and half-mass radius. This is a likely
lower limit to the genuine evaporation rate of stellar clusters because it does not include the effects of stellar evolution, gas cloud encounters, and tidal effects from the host TDG.
The typical density of YMCs is 103M
pc−3(see review by
Portegies Zwart et al. 2010). For this density, we obtain µev ∼
104M
Gyr−1. Under this hypothesis, we may conclude that
most of the stellar clusters of our system will be destroyed in a few gigayears at most, at least by internal relaxation.
Now we consider a cluster with a mass of 2×10⁴M
. Reaching
the typical density of YMCs implies a typical half-mass radius of 1.3 pc. As one pixel corresponds to a physical size of 12 pc (36 pc for the F160W band) at the distance of NGC 5291, we cannot con-strain the size of our clusters. Most of our sources are well fit by a PSF, which means a half-mass radius securely below 6 pc. The few sources that are not well fit by a PSF (see Sect.3) have half-light radii that can reach up to 2.5 pixels. However, they could also be blended detections or extended nebular emission from the ion-ized outskirts of young clusters. For a mass of 2 × 10⁴M
and
a half-mass radius of 6 pc, we obtain µev ∼ 103M Gyr−1. The
timescale for the destruction, considering only the effects of relax-ation, is therefore a Hubble time for 2 × 10⁴M clusters. Under
this hypothesis it is possible that the most massive clusters of our sample (reaching typically 2 × 10⁵M ) can survive evaporation
from internal processes for several gigayears. However, the dis-ruption from tidal effects will be faster (Gieles et al. 2006).
Mass loss from stellar evolution (40% to 60% of the mass over 12 Gyr;Kruijssen & Lamers 2008;Sippel et al. 2012), from gas cloud encounters, and from tidal harassment still needs to be taken into account. The study of these two mass-loss processes goes beyond the scope of our paper. Given the very gaseous envi-ronment of these TDGs and the high gas turbulence, we may expect the latter two processes to be more efficient than in iso-lated and kinematically relaxed systems. At the same time, star clusters in such a gas-rich environment may continue to accrete gas from their surroundings (Pflamm-Altenburg & Kroupa 2009;
Naiman et al. 2011;Li et al. 2016).
Thus, if the YMCs of these TDGs are similar to YMCs observed in other environments in terms of density, we do not expect these dwarfs to form a system of massive star clusters that could last for a Hubble time. This conclusion is mitigated when we allow for a lower star density, which remains empiri-cally unconstrained given our spatial resolution.
5.4. Evolution of the TDGs
TheΛCDM paradigm predicts a different DM content for two classes of dwarf galaxies: TDGs, formed during interactions, which should be devoid of DM, and normal dwarf galaxies, such as the dwarf ellipticals (dE), dwarf irregulars, or BCDGs, formed inside a DM halo. This difference in DM would result in different kinematics and provide us with a new test for theΛCDM paradigm (see, e.g.,Kroupa et al. 2010). Even though the absence of DM in TDGs is predicted from numerical simulations (Bournaud & Duc 2006;Wetzstein et al. 2007;Bournaud et al. 2008), it is hard to prove because these are young and turbulent systems. Under the assumption of dynamical equilibrium, which is suggested by sim-ulations to occur in less than one orbital time (Bournaud & Duc 2006;Bournaud et al. 2007), HI kinematics are consistent with a purely baryonic content (Lelli et al. 2015). The kinematics of old TDGs need to be investigated. They are kinematically relaxed, and such an investigation might confirm such a purely baryonic con-tent. If this were the case, it would meant that TDGs need to be distinguished from dEs.
Tidal dwarf galaxies are known to be outliers in the luminosity-metallicity relation (e.g.,Duc et al. 2000;Weilbacher et al. 2003). However, for old gas-poor TDGs, it might be still very challen-ing to obtain the metallicity from the stellar population with cur-rent observing facilities. Moreover, as the metallicity of the host is a decreasing function of redshift, it might be argued that the deviation from the magnitude-metallicity relation will decrease, which will make it harder to separate old and same-age TDGs and dEs. Tidal dwarf galaxies are also known to be outliers in the size-mass relation for dwarf galaxies: they have unusually large effective radii for their mass (Duc et al. 2014).
A final means to distinguish these two categories could be to use their stellar cluster content (Dabringhausen & Kroupa 2013). Dwarf ellipticals are known to host a significant number of GCs compared to their mass, with specific frequencies reaching up to 100 (Peng et al. 2008; Georgiev et al. 2010). Our analysis showed that even quite massive star clusters may form in TDGs. Some may be able to survive for several gigayears and thus be visible in rather old TDGs, but they will likely evaporate within a Hubble time because their SFR is too low to form clusters that are massive enough to survive evaporation for several gigayears. For a Hubble time, the minimum mass would be around the turnover value for the GC mass function (GCMF), 2 × 10⁵M
(Fall & Zhang 2001;Jordán et al. 2007).
Moreover, because a TDG potential well does not trap a signif-icant amount of DM or old stars from the host, it might be argued that the capture of GCs from the host, which are kinematically coupled to either the DM halo or the bulge component (see review byBrodie & Strader 2006), is also unlikely. This will be verified for our system in a future paper that will focus on the old cluster population, as described in Sect.2. The accretion of old GCs onto TDGs also needs to be investigated by means of numerical simu-lations to understand the effect of varying the orbital parameters. However, the conditions at higher redshift are most likely dif-ferent because the host galaxy is likely to have a more substantial gas component (see, e.g.,Combes et al. 2013). The TDG forma-tion at high redshift has been studied very little, but simulaforma-tions
J. Fensch et al.: Star clusters in TDGs
byWetzstein et al.(2007) showed that more gas-rich disk galax-ies are more likely to form TDGs, andElmegreen et al.(2007b) found five young TDG candidates at z = 0.15 − 0.7 that have higher stellar masses than typical local TDGs (up to 5 × 10⁹M
).
As claimed by the latter, the higher velocity dispersion of both the gaseous and stellar components of higher redshift galaxies could lead to Jeans masses of up to 1010M
in tidal tails.
It might therefore be argued that at a given higher redshift, TDGs will have higher gas masses and higher SFRs. If star clus-ter formation at this cosmic epoch follows the empirical relation between the SFR of a galaxy and the magnitude of its bright-est star cluster, given that the stellar models we used predict an MV = −12.4 mag for a 10 Myr old cluster of 2 × 10⁵M , then an
SFR of 5−10 M yr−1would be sufficient to form some clusters
more massive than the peak of the GCMF, which would be able to survive cluster dissolution for a Hubble time.
Although our analysis shows that TDGs formed under the cur-rent conditions are not likely to keep a GC system, more investiga-tion is needed to understand whether TDGs that formed at higher redshifts would be able to harbor a GC system until the present epoch, and if they might be distinguished from other dwarfs using this criterion. Recently, two UDG candidates, DF2 and DF4, were found to share several of the properties expected for TDGs: a puta-tive lack of DM, a large effective radius, and the proximity of a massive galaxy (van Dokkum et al. 2018a), which led to specu-lation of a tidal origin. The DM of this galaxy is still the subject of intense debate in the community (see, e.g.,Martin et al. 2018;
Trujillo et al. 2019;Blakeslee & Cantiello 2018;Emsellem et al. 2019;Danieli et al. 2019). However, one unique feature is its large number of massive GCs (van Dokkum et al. 2018b).Fensch et al.
(2019) found that the metallicity of the stellar body of DF2 and its GCs could be consistent with DF2 being an old TDG. However, a massive TDG like those around NGC 5291 did not form such massive clusters.
5.5. Link to the formation of GCs in high-redshift galaxies A prevailing theory for the formation of the metal-rich popula-tion of GC around present-day massive galaxies is that they may have formed in the star-forming disk of the host galaxy at high redshift (Shapiro et al. 2010; Kruijssen 2012), when their mor-phology was dominated by 5 to 10 UV-bright giant clumps (mass ∼107−9M , radius ∼1−3 kpc,Cowie et al. 1996;Elmegreen et al.
2009). A resolved study of clustered star formation in these clumps is unfortunately not possible with current instrumenta-tion, except in some fortuitous cases of strong gravitational lens-ing (Cava et al. 2018). Thus local analogs are often used as labo-ratories to investigate the possible ISM and star cluster formation, such as the nearby BCDGs (Elmegreen et al. 2012b). In particu-lar, they have been shown to be very efficient at forming YMCs (Östlin et al. 2003; Adamo et al. 2010; Lagos et al. 2011, and Sect.4.4), although BCDGs are characterized by high gas frac-tions and turbulence (see, e.g.,Lelli et al. 2014), similar to what is expected for higher redshift galaxies. However they usually have low to very low metallicities (typically 0.2 Z ,Zhao et al.
2013), while the giant clumps at high redshift already reach mod-erate metallicity, between one-third and half solar (Erb et al. 2006;
Cresci et al. 2010;Zanella et al. 2015), which may have a strong effect on gas fragmentation (Krumholz & Dekel 2012). More-over, most of their stellar mass resides in an old stellar compo-nent (Loose et al. 1986;Papaderos et al. 1996), which means that these systems are dynamically old.
The TDGs are gas-rich, dynamically young, and have moder-ate metallicity. They are therefore probably better analogs to the
clumps of high-redshift galaxies. The high to very high CFEs (up to 50%) observed in the TDGs we presented in this study suggest that the physical conditions in high-redshift galaxies could be very favorable to the formation of star clusters. Moreover, if the empir-ical relation between the SFR of a galaxy and the magnitude of its brightest star cluster holds at these redshifts because giant clumps have SFRs of about 1−10 M yr−1(Guo et al. 2012), they might
be expected to produce star clusters more massive 2 × 10⁵M .
This is the likely threshold mass that would allow them to survive dissolution over a Hubble time (see previous subsection).
The molecular surface gas density of TDGs is much lower than that of high-redshift galaxies; it is lower by two orders of magnitude (Lisenfeld et al. 2016). Their depletion timescale is also higher by a factor of 10 (2 Gyr for TDGs,Braine et al. 2001, 0.2 Gyr for z ' 2 galaxies,Combes et al. 2013). Moreover, the tidal forces from the host are likely different, and are important for the formation of YMCs in colliding galaxies (Renaud et al. 2015) as well as for their survival (Baumgardt & Makino 2003;
Renaud et al. 2011). Numerical simulation work is therefore still needed to understand cluster formation in the giant clumps of high-redshift galaxies.
6. Conclusion
We investigated star cluster formation and evolution in three TGDs, whose physical properties differs from those of starburst-ing dwarfs. In particular, they are gas rich, highly turbulent, and their gas metallicity is already enriched to up to half solar.
The three TDGs are located in a huge collisional ring around NGC 5291. We observed this system with the HST using five broad bands from the near-UV to the near-IR. The photometry was extracted using PSF and Sérsic fitting, and we compared the obtained SED with stellar evolution models using the CIGALE code.
We find that star clusters are observed in TDGs, with masses of up to 105M
, with a mass distribution similar to those
observed in other star cluster-forming systems. After taking into account the effect of the extinction-age degeneracies, we stud-ied the star cluster formation efficiency in the TDGs. We showed that the three TDGs have high CFEs, above 30%, with an aver-age of 42%. This is comparable to BCDGs, but with a lower SFR surface density, a higher metallicity and without being bona fide merging systems. The full sample of TDGs is located 2.5 to 3.8σ above the relations from the literature. There may be uncertain-ties that are not yet recognized that still allow a constant CFE at this time (see, e.g., Chandar et al. 2017), and more data are needed for similar special galaxy types. Nevertheless, our results suggest that such a constant CFE relation would have a large scatter, and that there would be structure within this scatter that would be correlated with galaxy type and/or environment.
We next probed the existence of intermediate-age clusters, which could have formed during the early stages of the formation of the gaseous ring structure and may have survived for several 100 Myr. The fact that we could find some of them shows that cluster formation started early and we can expect the survival of young massive (above 104M ) star clusters from the formation
of their host dwarf to several 100 Myr. However, if they have a similar density to what is observed for YMCs in other known environments (BCDGs, mergers), they might be present for a few gigayears but would be destroyed in a Hubble time because of relaxation-driven dissolution effects. If TDGs that formed at high redshift have a higher SFR, we may expect them to form more massive clusters that would be able to survive cluster dissolution for a Hubble time.
Acknowledgements. MB acknowledges support of FONDECYT regular grant 1170618. Support for Program number HST-GO-14727 was provided by NASA through a grant from the Space Telescope Science Institute, which is operated by the Association of Universities for Research in Astronomy, Incorporated, under NASA contract NAS5-26555. DME acknowledges support from grant HST-GO-14727.002-A. B.G.E. acknowledges support from grant HST-GO-14727.004-A. EB acknowledges support from the UK Science and Technology Facilities Coun-cil [grant number ST/M001008/1]. FR acknowledges support from the Knut and Alice Wallenberg Foundation.
References
Adamo, A., Zackrisson, E., Östlin, G., & Hayes, M. 2010,ApJ, 725, 1620
Adamo, A., Östlin, G., & Zackrisson, E. 2011,MNRAS, 417, 1904
Anders, P., Bissantz, N., Fritze-v. Alvensleben, U., & de Grijs, R. 2004,MNRAS, 347, 196
Ashman, K. M., & Zepf, S. E. 1992,ApJ, 384, 50
Bastian, N. 2008,MNRAS, 390, 759
Bastian, N., Adamo, A., Schirmer, M., et al. 2014,MNRAS, 444, 3829
Baumgardt, H., & Makino, J. 2003,MNRAS, 340, 227
Bertin, E., & Arnouts, S. 1996,A&AS, 117, 393
Bigiel, F., Leroy, A., Walter, F., et al. 2008,AJ, 136, 2846
Bik, A., Östlin, G., Hayes, M., et al. 2015,A&A, 576, L13
Billett, O. H., Hunter, D. A., & Elmegreen, B. G. 2002,AJ, 123, 1454
Blakeslee, J. P., & Cantiello, M. 2018,Res. Notes Am. Astron. Soc., 2, 146
Boquien, M., Duc, P.-A., Braine, J., et al. 2007,A&A, 467, 93
Boquien, M., Duc, P.-A., Wu, Y., et al. 2009,AJ, 137, 4561
Boquien, M., Burgarella, D., Roehlly, Y., et al. 2019,A&A, 622, A103
Bournaud, F., & Duc, P.-A. 2006,A&A, 456, 481
Bournaud, F., Duc, P.-A., Amram, P., Combes, F., & Gach, J.-L. 2004,A&A, 425, 813
Bournaud, F., Duc, P.-A., Brinks, E., et al. 2007,Science, 316, 1166
Bournaud, F., Duc, P.-A., & Emsellem, E. 2008,MNRAS, 389, L8
Boutloukos, S. G., & Lamers, H. J. G. L. M. 2003,MNRAS, 338, 717
Bouwens, R. J., van Dokkum, P. G., Illingworth, G. D., et al. 2017, ArXiv e-prints [arXiv:1711.02090] unpublished
Braine, J., Duc, P.-A., Lisenfeld, U., et al. 2001,A&A, 378, 51
Brodie, J. P., & Strader, J. 2006,ARA&A, 44, 193
Bruzual, G., & Charlot, S. 2003,MNRAS, 344, 1000
Burgarella, D., Buat, V., & Iglesias-Páramo, J. 2005,MNRAS, 360, 1413
Cava, A., Schaerer, D., Richard, J., et al. 2018,Nat. Astron., 2, 76
Chabrier, G. 2003,ApJ, 586, L133
Chandar, R., Fall, S. M., Whitmore, B. C., & Mulia, A. J. 2017,ApJ, 849, 128
Combes, F., García-Burillo, S., Braine, J., et al. 2013,A&A, 550, A41
Côté, P., Marzke, R. O., & West, M. J. 1998,ApJ, 501, 554
Cowie, L. L., Songaila, A., Hu, E. M., & Cohen, J. G. 1996,AJ, 112, 839
Cresci, G., Mannucci, F., Maiolino, R., et al. 2010,Nature, 467, 811
Dabringhausen, J., & Kroupa, P. 2013,MNRAS, 429, 1858
Danieli, S., van Dokkum, P., Conroy, C., Abraham, R., & Romanowsky, A. J. 2019,ApJ, 874, L12
de Grijs, R., Anders, P., Zackrisson, E., & Östlin, G. 2013,MNRAS, 431, 2917
Duc, P.-A., & Mirabel, I. F. 1998,A&A, 333, 813
Duc, P. A., & Mirabel, I. F. 1999,IAU Symp., 186, 61
Duc, P.-A., Brinks, E., Springel, V., et al. 2000,AJ, 120, 1238
Duc, P.-A., Paudel, S., McDermid, R. M., et al. 2014,MNRAS, 440, 1458
Elmegreen, B. G., & Efremov, Y. N. 1997,ApJ, 480, 235
Elmegreen, D. M., & Elmegreen, B. G. 2017,ApJ, 851, L44
Elmegreen, D. M., Elmegreen, B. G., Ferguson, T., & Mullan, B. 2007a,ApJ, 663, 734
Elmegreen, D. M., Elmegreen, B. G., Ravindranath, S., & Coe, D. A. 2007b,
ApJ, 658, 763
Elmegreen, B. G., Elmegreen, D. M., Fernandez, M. X., & Lemonias, J. J. 2009,
ApJ, 692, 12
Elmegreen, B. G., Malhotra, S., & Rhoads, J. 2012a,ApJ, 757, 9
Elmegreen, B. G., Zhang, H.-X., & Hunter, D. A. 2012b,ApJ, 747, 105
Emsellem, E., van der Burg, R. F. J., Fensch, J., et al. 2019,A&A, 625, A76
Erb, D. K., Shapley, A. E., Pettini, M., et al. 2006,ApJ, 644, 813
Fall, S. M., & Zhang, Q. 2001,ApJ, 561, 751
Fall, S. M., Chandar, R., & Whitmore, B. C. 2005,ApJ, 631, L133
Fensch, J., Duc, P.-A., Weilbacher, P. M., Boquien, M., & Zackrisson, E. 2016,
A&A, 585, A79
Fensch, J., Renaud, F., Bournaud, F., et al. 2017,MNRAS, 465, 1934
Fensch, J., van der Burg, R. F. J., Jerabkova, T., et al. 2019,A&A, 625, A77
Forbes, D. A., Bastian, N., Gieles, M., et al. 2018,Proc. R. Soc. London Ser. A, 474, 20170616
Gaia Collaboration (Brown, A. G. A., et al.) 2018,A&A, 616, A1
Georgiev, I. Y., Puzia, T. H., Goudfrooij, P., & Hilker, M. 2010,MNRAS, 406, 1967
Gieles, M., Portegies Zwart, S. F., Baumgardt, H., et al. 2006,MNRAS, 371, 793
Giovannoli, E., Buat, V., Noll, S., Burgarella, D., & Magnelli, B. 2011,A&A, 525, A150
Goddard, Q. E., Bastian, N., & Kennicutt, R. C. 2010,MNRAS, 405, 857
Goodwin, S. P., & Bastian, N. 2006,MNRAS, 373, 752
Gordon, K. D., Clayton, G. C., Misselt, K. A., Landolt, A. U., & Wolff, M. J. 2003,ApJ, 594, 279
Guo, Y., Giavalisco, M., Ferguson, H. C., Cassata, P., & Koekemoer, A. M. 2012,
ApJ, 757, 120
Hénon, M. 1961,Annales d’Astrophysique, 24, 369
Hunter, D. A., Elmegreen, B. G., & Gehret, E. 2016,AJ, 151, 136
Johnson, L. C., Seth, A. C., Dalcanton, J. J., et al. 2016,ApJ, 827, 33
Jordán, A., McLaughlin, D. E., Côté, P., et al. 2007,ApJS, 171, 101
Kennicutt, Jr., R. C., Hao, C.-N., Calzetti, D., et al. 2009,ApJ, 703, 1672
Kim, J.-H., Ma, X., Grudi´c, M. Y., et al. 2018,MNRAS, 474, 4232
Kimm, T., Cen, R., Rosdahl, J., & Yi, S. K. 2016,ApJ, 823, 52
Knierman, K. A., Gallagher, S. C., Charlton, J. C., et al. 2003,AJ, 126, 1227
Koekemoer, A. M. 2002,HST Dither Handbook
Kroupa, P., & Boily, C. M. 2002,MNRAS, 336, 1188
Kroupa, P., Famaey, B., de Boer, K. S., et al. 2010,A&A, 523, A32
Kruijssen, J. M. D. 2012,MNRAS, 426, 3008
Kruijssen, J. M. D. 2015,MNRAS, 454, 1658
Kruijssen, J. M. D., & Lamers, H. J. G. L. M. 2008,A&A, 490, 151
Krumholz, M. R., & Dekel, A. 2012,ApJ, 753, 16
Lagos, P., Telles, E., Nigoche-Netro, A., & Carrasco, E. R. 2011,AJ, 142, 162
Larsen, S. S. 2002,AJ, 124, 1393
Larsen, S. S., & Richtler, T. 2000,A&A, 354, 836
Larsen, S. S., Brodie, J. P., & Hunter, D. A. 2004,AJ, 128, 2295
Lelli, F., Verheijen, M., & Fraternali, F. 2014,A&A, 566, A71
Lelli, F., Duc, P.-A., Brinks, E., et al. 2015,A&A, 584, A113
Li, H., & Gnedin, O. Y. 2014,ApJ, 796, 10
Li, C., de Grijs, R., Deng, L., et al. 2016,Nature, 529, 502
Lisenfeld, U., Braine, J., Duc, P. A., et al. 2016,A&A, 590, A92
Lofthouse, E. K., Kaviraj, S., Conselice, C. J., Mortlock, A., & Hartley, W. 2017,
MNRAS, 465, 2895
Loose, H. H., & Thuan, T. X. 1986, inStar-forming Dwarf Galaxies and Related Objects, eds. D. Kunth, T. X. Thuan, J. Tran Thanh Van, J. Lequeux, & J. Audouze, 73
Lotz, J. M., Miller, B. W., & Ferguson, H. C. 2004,ApJ, 613, 262
Martin, N. F., Collins, M. L. M., Longeard, N., & Tollerud, E. 2018,ApJ, 859, L5
Messa, M., Adamo, A., Calzetti, D., et al. 2018,MNRAS, 477, 1683
Mullan, B., Konstantopoulos, I. S., Kepley, A. A., et al. 2011,ApJ, 731, 93
Naiman, J. P., Ramirez-Ruiz, E., & Lin, D. N. C. 2011,ApJ, 735, 25
Noll, S., Burgarella, D., Giovannoli, E., et al. 2009,A&A, 507, 1793
Östlin, G., Zackrisson, E., Bergvall, N., & Rönnback, J. 2003,A&A, 408, 887
Papaderos, P., Loose, H.-H., Thuan, T. X., & Fricke, K. J. 1996,A&AS, 120, 207
Peebles, P. J. E. 1984,ApJ, 277, 470
Peng, C. Y., Ho, L. C., Impey, C. D., & Rix, H.-W. 2002,AJ, 124, 266
Peng, E. W., Jordán, A., Côté, P., et al. 2008,ApJ, 681, 197
Peng, C. Y., Ho, L. C., Impey, C. D., & Rix, H.-W. 2010,AJ, 139, 2097
Perret, V., Renaud, F., Epinat, B., et al. 2014,A&A, 562, A1
Pflamm-Altenburg, J., & Kroupa, P. 2009,MNRAS, 397, 488
Portegies Zwart, S. F., McMillan, S. L. W., & Gieles, M. 2010,ARA&A, 48, 431
Renaud, F. 2018,New A Rev., 81, 1
Renaud, F., Gieles, M., & Boily, C. M. 2011,MNRAS, 418, 759
Renaud, F., Bournaud, F., & Duc, P.-A. 2015,MNRAS, 446, 2038
Renaud, F., Agertz, O., & Gieles, M. 2017,MNRAS, 465, 3622
Rodighiero, G., Daddi, E., Baronchelli, I., et al. 2011,ApJ, 739, L40
Salpeter, E. E. 1955,ApJ, 121, 161
Shapiro, K. L., Genzel, R., & Förster Schreiber, N. M. 2010,MNRAS, 403, L36
Sippel, A. C., Hurley, J. R., Madrid, J. P., & Harris, W. E. 2012,MNRAS, 427, 167
Tonini, C. 2013,ApJ, 762, 39
Trujillo, I., Beasley, M. A., Borlaff, A., et al. 2019,MNRAS, 486, 1192
van Dokkum, P. G. 2001,PASP, 113, 1420
van Dokkum, P., Danieli, S., Cohen, Y., et al. 2018a,Nature, 555, 629
van Dokkum, P., Cohen, Y., Danieli, S., et al. 2018b,ApJ, 856, L30
Vanzella, E., Castellano, M., Meneghetti, M., et al. 2017a,ApJ, 842, 47
Vanzella, E., Calura, F., Meneghetti, M., et al. 2017b,MNRAS, 467, 4304
Weilbacher, P. M., Duc, P. A., & Fritze-v. Alvensleben, U. 2003,A&A, 397, 545
Wetzstein, M., Naab, T., & Burkert, A. 2007,MNRAS, 375, 805
Whitmore, B. C., Chandar, R., & Fall, S. M. 2007,AJ, 133, 1067
Whitmore, B. C., Chandar, R., Kim, H., et al. 2011,ApJ, 729, 78
Zanella, A., Daddi, E., Le Floc’h, E., et al. 2015,Nature, 521, 54