HAL Id: hal-00304176
https://hal.archives-ouvertes.fr/hal-00304176
Submitted on 22 May 2008HAL is a multi-disciplinary open access
archive for the deposit and dissemination of sci-entific research documents, whether they are pub-lished or not. The documents may come from teaching and research institutions in France or abroad, or from public or private research centers.
L’archive ouverte pluridisciplinaire HAL, est destinée au dépôt et à la diffusion de documents scientifiques de niveau recherche, publiés ou non, émanant des établissements d’enseignement et de recherche français ou étrangers, des laboratoires publics ou privés.
Do atmospheric aerosols form glasses?
B. Zobrist, C. Marcolli, D. A. Pedernera, T. Koop
To cite this version:
B. Zobrist, C. Marcolli, D. A. Pedernera, T. Koop. Do atmospheric aerosols form glasses?. Atmo-spheric Chemistry and Physics Discussions, European Geosciences Union, 2008, 8 (3), pp.9263-9321. �hal-00304176�
ACPD
8, 9263–9320, 2008 Do atmospheric aerosols form glasses? B. Zobrist et al. Title Page Abstract Introduction Conclusions References Tables Figures ◭ ◮ ◭ ◮ Back CloseFull Screen / Esc
Printer-friendly Version
Interactive Discussion
Atmos. Chem. Phys. Discuss., 8, 9263–9320, 2008 www.atmos-chem-phys-discuss.net/8/9263/2008/ © Author(s) 2008. This work is distributed under the Creative Commons Attribution 3.0 License.
Atmospheric Chemistry and Physics Discussions
Do atmospheric aerosols form glasses?
B. Zobrist1,2, C. Marcolli2, D. A. Pedernera1, and T. Koop1 1
Department of Chemistry, Bielefeld University, Bielefeld, Germany 2
Institute for Atmospheric and Climate Science, ETH Zurich, Zurich, Switzerland Received: 15 April 2008 – Accepted: 15 April 2008 – Published: 22 May 2008 Correspondence to: T. Koop ([email protected])
ACPD
8, 9263–9320, 2008 Do atmospheric aerosols form glasses? B. Zobrist et al. Title Page Abstract Introduction Conclusions References Tables Figures ◭ ◮ ◭ ◮ Back CloseFull Screen / Esc
Printer-friendly Version
Interactive Discussion Abstract
A new process is presented by which water-soluble organics might influence ice nucle-ation, ice growth, chemical reactions and water uptake of aerosols in the upper tropo-sphere: the formation of glassy aerosol particles. Glasses are disordered amorphous (non-crystalline) solids that form when a liquid is cooled without crystallization until the
5
viscosity increases exponentially and molecular diffusion practically ceases. The glass transition temperatures,Tg, homogeneous ice nucleation temperatures, Thom, and ice melting temperatures,Tm, of various aqueous inorganic, organic and multi-component solutions are investigated with a differential scanning calorimeter. The investigated so-lutes are: various polyols, glucose, raffinose, levoglucosan, an aromatic compound,
10
sulfuric acid, ammonium bisulphate and mixtures of dicarboxylic acids (M5), of dicar-boxylic acids and ammonium sulphate (M5AS), of two polyols, of glucose and ammo-nium nitrate, and of raffinose and M5AS. The results indicate that aqueous solutions of the investigated inorganic solutes showTg-values that are too low to be of atmospheric importance. In contrast, aqueous organic and multi-component solutions readily form
15
glasses at low but atmospherically relevant temperatures (≤230 K). To apply the labo-ratory data to the atmospheric situation, the measured phase transition temperatures were transformed from a concentration to a water activity scale by extrapolating wa-ter activities dewa-termined between 252 K and 313 K to lower temperatures. The ob-tained state diagrams reveal that the higher the molar mass of the aqueous organic
20
or multi-component solutes, the higherTgof their respective solutions at a given water activity. To a lesser extent,Tgalso depends on the hydrophilicity of the organic solutes. Therefore, aerosol particles containing larger and more hydrophobic organic molecules (&150 g mol−1) are more likely to form glasses at intermediate to high relative humidi-ties in the upper troposphere. Our results suggest that the water uptake of aerosols,
25
heterogeneous chemical reactions in aerosol particles, as well as ice nucleation and ice crystal growth can be significantly impeded or even completely inhibited in organic-enriched aerosols at upper tropospheric temperatures with implications for cirrus cloud
ACPD
8, 9263–9320, 2008 Do atmospheric aerosols form glasses? B. Zobrist et al. Title Page Abstract Introduction Conclusions References Tables Figures ◭ ◮ ◭ ◮ Back CloseFull Screen / Esc
Printer-friendly Version
Interactive Discussion
formation and upper tropospheric relative humidity.
1 Introduction
Depending on their concentration and composition, aerosols affect different atmo-spheric properties and processes, such as atmoatmo-spheric chemistry and Earth’s radia-tive budget. For example, the aerosol climate forcing can be divided into a direct and
5
an indirect aerosol effect (e.g., Hansen et al., 1998; Haywood and Boucher, 2000; Lohmann and Feichter, 2005). The direct aerosol effect is due to scattering and ab-sorption of sunlight by aerosols, and it depends on aerosol properties such as physical state, size, absorption cross section and chemical composition (e.g., Haywood and Boucher, 2000). Depending on ambient relative humidity, aerosol particles grow or
10
shrink by taking up or releasing water vapor thus enhancing or reducing the scatter-ing intensity of the aerosol (Carrico et al., 2003; Quinn et al., 2005; Baynard et al., 2006). Aerosols exert also an indirect effect by acting as cloud condensation nuclei for liquid clouds or as ice nuclei for ice clouds, thereby affecting the initial cloud par-ticle number concentration, cloud lifetime and albedo (Albrecht, 1989; Lohmann and
15
Feichter, 2005). According to the recent Intergovernmental Panel on Climate Change report (IPCC, 2007), the direct and indirect aerosol effects exert radiative forcings of –0.5 and –0.7 W m−2, respectively, but exhibit only a low to medium level of scientific understanding.
The atmospheric aerosol is a complex mixture of various inorganic and organic
com-20
ponents. The organic fraction can represent 50% or more of the total aerosol mass depending on geographical location and/or altitude (e.g., Novakov et al., 1997; Mid-dlebrook et al., 1998; Kanakidou et al., 2005; Murphy et al., 2006), but its composi-tion in terms of chemical structures of individual molecules remains unidentified to a large extent (Saxena and Hildemann, 1996; Kanakidou et al., 2005). The water
solu-25
ble organic fraction contributes substantially to the total organic aerosol and typically contains mono-, di- and polycarboxylic acids, polyols, dialkyl ketones, polyphenols,
aro-ACPD
8, 9263–9320, 2008 Do atmospheric aerosols form glasses? B. Zobrist et al. Title Page Abstract Introduction Conclusions References Tables Figures ◭ ◮ ◭ ◮ Back CloseFull Screen / Esc
Printer-friendly Version
Interactive Discussion
matic aldehydes and acids, sugars, anhydrosugars and other functional groups (Rogge et al., 1993; Kanakidou et al., 2005; Decesari et al., 2006).
Aerosol particles in the atmosphere may occur as solid or liquid particles or as a mixture of both depending on their composition and ambient conditions (e.g., Martin, 2000; Colberg et al., 2003; Marcolli et al., 2004). The organic fraction, however, tends
5
to remain liquid instead of crystallizing as the temperature is decreased and, thus, or-ganic aerosol particles may form highly viscous liquids (Marcolli et al., 2004). When the viscosity of such a liquid reaches a value in the order of 1012 Pa s, the molecular motion becomes so slow, that the sample vitrifies within timescales of seconds to min-utes at the glass transition temperatureTg(Debenedetti and Stillinger, 2001). Glasses
10
are amorphous substances that behave mechanically like solids (Debenedetti, 1996). The ability to form a glass depends strongly on the chemical and physical properties of a given substance and its mixing state (Angell, 1995, 2002). Glasses are ubiquitous in nature (Angell, 1995) and are widely applied in bioengineering (Langer and Vacanti, 1993), food technology (Slade and Levine, 1994), pharmaceutical industries (Kerˇc and
15
Srˇciˇc, 1995; Craig et al., 1999; Hancock and Zografi, 1997) or cryobiology (Pegg and Karow, 1987; Angell, 2002).
If aerosol particles were present as glasses, this would influence several physical and chemical processes in the atmosphere significantly: Water uptake from the gas phase would be drastically impeded or even completely inhibited in glassy aerosols,
20
thus reducing the direct aerosol effect. Similarly, glass formation would affect the ice nucleation efficiency of aerosols particles. Peter et al. (2006) recently suggested that a suppressed ice nucleation might be a possible explanation of the observed high supersaturations with respect to ice in recent field experiments (Jensen et al., 2005). Furthermore, if aged aerosols become more and more viscous due to polymerization
25
reactions (e.g., Kalberer et al., 2004; Denkenberger et al., 2007) they might turn more easily into glasses and further aerosol processing could be ceased.
In this study, the potential of atmospheric aerosols to form glasses will be explored by investigating the glass transition temperatures of atmospherically relevant aqueous
so-ACPD
8, 9263–9320, 2008 Do atmospheric aerosols form glasses? B. Zobrist et al. Title Page Abstract Introduction Conclusions References Tables Figures ◭ ◮ ◭ ◮ Back CloseFull Screen / Esc
Printer-friendly Version
Interactive Discussion
lutions. The paper is structured in the following way: Section 2 compares the thermody-namics of glass and crystallization/melting phase transitions. Section 3 exemplifies the use of differential scanning calorimetry to observe such phase transitions in aqueous solutions. Sections 4 and 5 compare the dependence of glass transition temperatures of aqueous solutions on their concentration and water activity. Sections 6 to 8 show
5
results of glass transition temperature measurements of various aqueous organic, in-organic and multi-component solutions of atmospheric relevance. Finally, in Sect. 9, the potential effects of glassy aerosols on atmospheric processes are discussed.
2 Physical background of glass transition
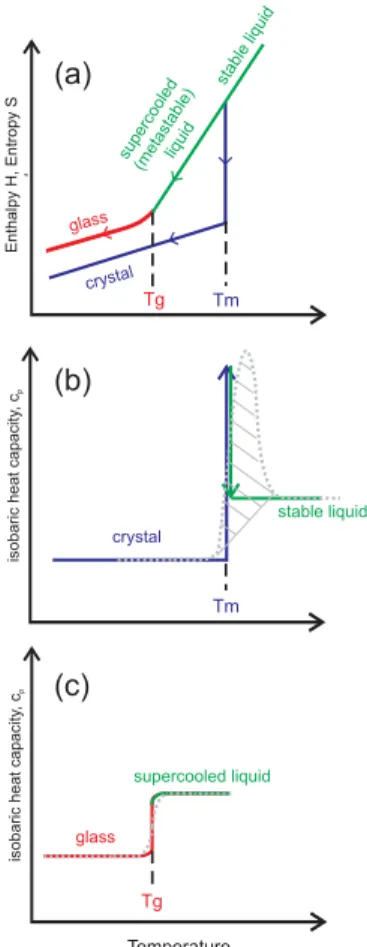
Figure 1a depicts schematically the enthalpyH and the entropy S change as a function
10
of temperature for a liquid-to-solid phase transition and a glass transition. Cooling a stable liquid results normally in a decrease in both H and S (green line). If
crystal-lization occurs without supercooling at the equilibrium melting point Tm (vertical blue line), this causes an abrupt decrease inH and S, which is indicative of a first-order
phase transition (Atkins, 1996). Cooling the crystal to even lower temperatures further
15
decreasesH and S in a continuous way (slanted blue line). Upon warming the system
follows the same path since both H and S are thermodynamic state functions. The
behavior described above is, however, an idealized case, because most liquids do not show a completely reversible behavior atTm; instead they usually exhibit supercooling belowTmas crystallization is kinetically hindered and requires a nucleation process. In
20
this case,H and S decrease continuously even below Tm (green line to the left ofTm). In such a supercooled (metastable) liquid nucleation can occur at any given moment, in which case H and S would drop abruptly to their crystal values at the nucleation
temperature. The viscosity of the liquid increases upon cooling, slowing down molec-ular motion, which in turn may inhibit nucleation and/or crystal growth. At even lower
25
temperatures, molecular motion becomes so slow that on the experimental timescale the molecules cannot equilibrate to the lowest energy state of the liquid (Debenedetti,
ACPD
8, 9263–9320, 2008 Do atmospheric aerosols form glasses? B. Zobrist et al. Title Page Abstract Introduction Conclusions References Tables Figures ◭ ◮ ◭ ◮ Back CloseFull Screen / Esc
Printer-friendly Version
Interactive Discussion
1996; Debenedetti and Stillinger, 2001). This kinetic phenomenon is called vitrification or glass formation and the corresponding temperature is termed the glass transition temperatureTg. BelowTg, the substance is a glass, i.e., a non-crystalline amorphous state that behaves mechanically like a solid (Debenedetti and Stillinger, 2001). Be-cause translational and reorientational degrees of freedom practically are frozen on experimental timescales belowTg,H and S in the glassy state decrease upon cooling
5
with a slope that is similar to that of the crystal (red line, Angell, 2008). The change in slope ofH and S at Tg is indicative of the glass transition. During the glass transition neither a release of latent enthalpy nor a discontinuous change in the ordering of the molecules occurs, thus, glass formation is not easily observed by many experimen-tal techniques. One standard technique that is very well suited for investigations of
10
both crystal nucleation and glass formation is Differential Scanning Calorimetry (DSC, Folmer and Franzen, 2003). This is, because the DSC technique is sensitive to the isobaric heat capacity of the sample, cp=(∂H/∂T )p, i.e., the slope of H in Fig. 1a.
Panels (b) and (c) of Fig. 1 show the temperature dependence ofcp for a first-order liquid-to-solid phase transition and a glass transition, respectively. Also included as the
15
dashed grey curves are the signals that are typically observed in DSC experiments for such phase transitions. Figure 1b shows that the crystal exhibits a smallercp value than the liquid. Within a limited temperature range around Tm one can assume cp of both phases to be approximately independent of temperature. Upon warming la-tent heat is absorbed by the crystal atTm without any increase in temperature, i.e.,H
20
changes instantaneously and, hence, cp nominally becomes infinite at Tm (indicated by the vertical blue and green arrows). However, because of the inherent thermal lag within the DSC apparatus, the DSC thermogram displays a broadened peak, with the integrated peak area of the grey dashed line amounting the total melting enthalpy of the sample. Figure 1c shows the behavior ofcpupon heating a glass. Here,cpchanges
25
from the smaller value of the glass to the higher value of the (supercooled) liquid atTg. The step-like DSC signal in panel (c) closely follows the change incp. In the following section, we will show several examples of DSC experiments in which crystallization
ACPD
8, 9263–9320, 2008 Do atmospheric aerosols form glasses? B. Zobrist et al. Title Page Abstract Introduction Conclusions References Tables Figures ◭ ◮ ◭ ◮ Back CloseFull Screen / Esc
Printer-friendly Version
Interactive Discussion
and melting processes as well as glass transitions occurred.
3 Competition between glass formation and ice crystallization in aqueous so-lutions
Glass formation is observed in many different systems such as minerals, metals,
poly-5
mers, and also in aqueous solutions (e.g., Angell, 1995; Debenedetti and Stillinger, 2001; Angell, 2002). Even pure water can vitrify, however, only when hyperquench-ing small water samples at extremely large coolhyperquench-ing rates of ∼105 K s−1 (Kohl et al., 2005). At moderate cooling rates (≤20 K min−1) ice nucleates readily in water and di-lute aqueous solutions before glass formation occurs. On the other hand, at very high
10
solute concentrations glass formation is observed frequently even when cooling rates are moderate. In the following section, the different processes that occur in aqueous solutions of varying solute concentration are discussed using aqueous glucose solu-tions as a model system.
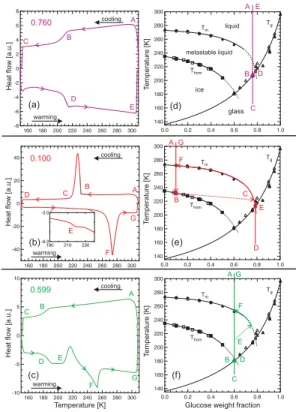
On the left-hand side of Fig. 2 three typical DSC thermograms are shown. The
exper-15
iments were performed with emulsified samples, i.e., small micrometer-sized aqueous droplets in an inert oil matrix (see Appendix A1 for experimental details). The small arrowheads in panels (a)–(c) show the course of the experimental runs. The capital letters indicate points that are of special interest (see discussion below). Panels (d)–(f) on the right-hand side depict the binary glucose/water state diagrams as a function of
20
the glucose weight fraction. In these panels, the black lines represent the ice melting point curve,Tm, the homogeneous ice nucleation curve,Thom, and the glass transition curve, Tg (All curves are based on experimental data points, given as symbols, from this and previous studies). Water is supersaturated in the area betweenTmand Thom, but can persist as a metastable liquid upon cooling because ice formation in that region
25
is kinetically hindered in small droplets. The colored lines and capital letters refer to the thermograms on the left-hand side, which we now discuss individually.
ACPD
8, 9263–9320, 2008 Do atmospheric aerosols form glasses? B. Zobrist et al. Title Page Abstract Introduction Conclusions References Tables Figures ◭ ◮ ◭ ◮ Back CloseFull Screen / Esc
Printer-friendly Version
Interactive Discussion
weight fraction,w2, of 0.760. The sample is cooled from initially 308 K (point A) down to 153 K (point C). At around 210 K a smooth S-shaped step is observed (point B). Reheating the sample from point C to point E again results in a smooth step in the heat flow signal at a similar temperature (point D). The pathway A–E is also overlayed onto the state diagram in panel (d) as the colored line. Throughout the entire experiment the concentration of the solution remains constant. From this analysis we see that
5
the colored line crosses theTg curve at ∼210 K, indicating that the observed steps in the thermograms are due to glass formation (point B) and the reverse glass-to-liquid transition (point D).
Figure 2b shows an experiment with a dilute glucose solution withw2=0.100. When the sample is cooled from 308 K (point A) to 153 K (point D), a large exothermic signal
10
appears at ∼230 K (point B), due to homogeneous ice nucleation and growth in the aqueous droplets. The solute is expelled from the growing ice crystals resulting in the formation of a highly concentrated glucose solution. This is indicated in panel (e) by the dotted arrow connecting points B and C. Upon further cooling, the concentration of the remaining solution follows theTmcurve, thereby further increasing in concentration,
15
until it vitrifies at the point E where theTm and Tg curves meet. The glass transition is not observable during the cooling cycle in panel (b) because it is hidden below the ice nucleation peak. Provided that the ice crystals cannot grow further in the glass the concentration of the glassy solution remains constant upon further cooling (vertical line towards point D in panel e). During the heating cycle a small glass transition step of the
20
glucose solution is observed (see point E in the enlarged inlet of panel b). This point is termedT
′
g or “the glass transition temperature of the freeze concentrated solution”, which is marked in panel (e) with a red hash mark at point E. Upon further heating, the solution concentration follows theTm curve and the ice continuously melts until at point F, the entire sample is again liquid.
25
Figure 2c depicts an experiment of a glucose solution at intermediate concentration withw2=0.599. Upon cooling from 308 K (point A) to 153 K (point C) a glass transition is observed at ∼180 K (point B), see panel (f) for comparison. In the heating cycle, the
ACPD
8, 9263–9320, 2008 Do atmospheric aerosols form glasses? B. Zobrist et al. Title Page Abstract Introduction Conclusions References Tables Figures ◭ ◮ ◭ ◮ Back CloseFull Screen / Esc
Printer-friendly Version
Interactive Discussion
glass-to-liquid transition is again observed at ∼180 K. Then, an additional exothermic peak appears at ∼210 K (point E). This signal can be attributed to ice crystallization in the sample, which leads to an increase of the glucose solution concentration until the
Tmcurve is reached (dotted arrow in panel f). There the ice starts to melt upon heating until it is completely melted at ∼255 K (endothermic peak in panel c (point F), see also panel (f) for comparison). At this point the solution reaches its initial weight fraction of
5
0.599. The experiment shown in Figure 2c imposes the question of why ice formation did not occur during the cooling cycle but only upon warming. It seems reasonable that ice germs larger than the critical size may have nucleated during cooling when the sample crossed the extrapolatedThom curve just before it vitrified at point B. However, the very high viscosity of the sample inhibited the ice crystal growth. No signal is
10
observed in the thermogram, because the release of latent heat due to the formation of critical germs is much too small to be detected by the DSC. Upon heating, the solution viscosity became low enough at about 30 K aboveTg so that the ice germs in the droplets could grow to macroscopic crystals, resulting in the exothermic peak at point E.
15
To summarize this section, three principal cases of glass formation in aqueous so-lutions can be distinguished in Fig. 2. Firstly, the aqueous solution is so concentrated that ice does not crystallize and a glass formation is observed atTg. Secondly, in dilute solutions ice crystallizes homogeneously and glass formation in the freeze concen-trated solution occurs at T
′
g upon cooling. T ′
g is a unique point in the state diagram
20
of each solute, defined as the intersection between theTg and Tm curves. Thirdly, at intermediate concentrations, some solutions vitrify upon cooling and do not form ice until temperatures typically 10–30 K aboveTgare reached.
4 Tgin aqueous solutions – organic versus inorganic solutes
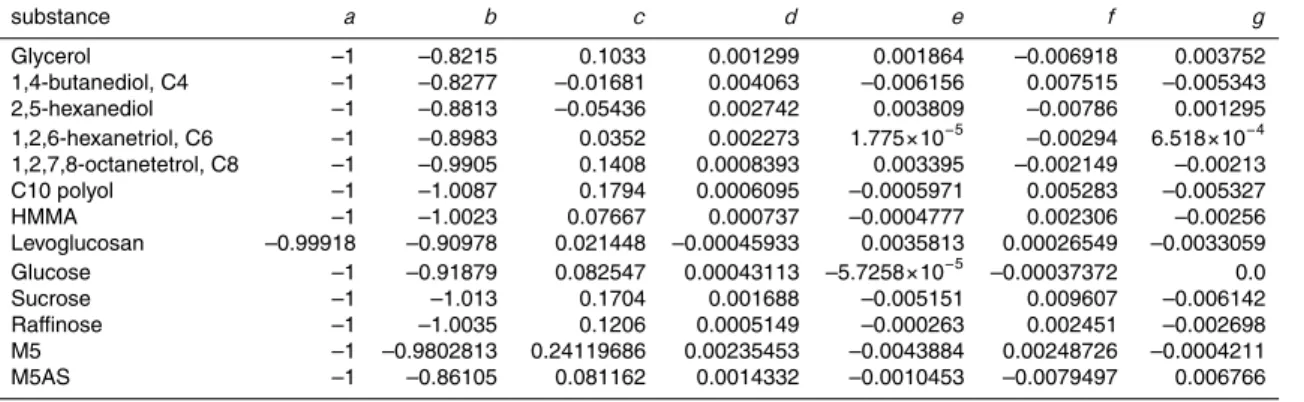
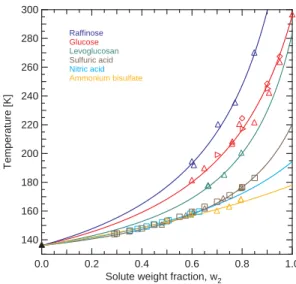
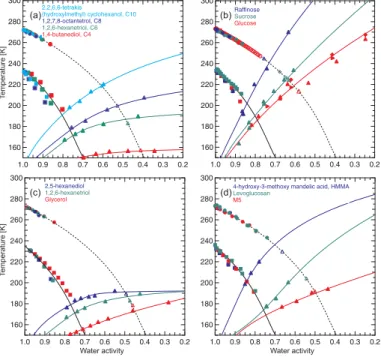
Figure 3 shows Tg as a function of the solute weight fraction for selected organic
25
ACPD
8, 9263–9320, 2008 Do atmospheric aerosols form glasses? B. Zobrist et al. Title Page Abstract Introduction Conclusions References Tables Figures ◭ ◮ ◭ ◮ Back CloseFull Screen / Esc
Printer-friendly Version
Interactive Discussion
(C6O6H12) and levoglucosan (C6O5H10) represent constituents of a typical biomass burning aerosol (Decesari et al., 2006) and the inorganic solutes belong to the most frequently occurring inorganic substances in atmospheric aerosol particles. The trian-gles and squares represent experimental data from this and reference studies, respec-tively, and the colored curves are fits to the data according to Eq. (1) (see discussion below).
5
All solutions exhibit a strong dependence ofTgon the solute weight fraction,w2, with larger w2 values leading to higher Tg. All curves have the Tg value of pure water in common (136 K atw2=0, see black triangle in Fig. 3), but show different slopes with increasing solute weight fraction. The increase ofTgwith increasingw2is strongest for raffinose and weakest for NH4HSO4. It is noteworthy that the organic solutes exhibit
10
higherTgvalues than the inorganic ones and that for organic solutesTgat a given con-centration is the higher, the larger the molar mass of the solute. Limitations exist for the concentration range over which glass formation can be determined experimentally when using moderate cooling rates, in agreement with our discussion of Fig. 2 above. For example, at low solute concentrations,Tg can be determined in sulfuric acid
solu-15
tions only whenw2exceeds a value of ∼0.3, whereas aqueous glucose solution vitrify whenw2 exceeds ∼0.6. At lower concentrations, ice nucleates homogeneously in the samples (see, e.g., Fig. 2b/e) although glasses could form if the samples were hyper-quenched. Similar limitations exist whenw2reaches values close to one, because the solute itself often crystallizes under such highly supersaturated conditions.
20
For various purposes it is desirable to have an appropriate description ofTgover the entire concentration range 0≤w2≤1. Indeed, Gordon and Taylor (1952) have developed an empirical formulation forTg based on experimental data of binary polymer blends. This so-called Gordon-Taylor equation has been widely applied in polymer research (Koleske and Lundberg, 1969) and also to aqueous solutions of carbohydrates in food science (e.g., Roos, 1993). In aqueous solutions, the glass transition temperature at a specific solute weight fraction, Tg(w2), can be expressed according to the
Gordon-ACPD
8, 9263–9320, 2008 Do atmospheric aerosols form glasses? B. Zobrist et al. Title Page Abstract Introduction Conclusions References Tables Figures ◭ ◮ ◭ ◮ Back CloseFull Screen / Esc
Printer-friendly Version
Interactive Discussion
Taylor equation as (Gordon and Taylor, 1952; Katkov and Levine, 2004):
5
Tg(w2) =
w1Tg1+1k w2Tg2
w1+1k w2
, (1)
wherew1 and w2 are the weight fractions of water and of the solute, Tg1 and Tg2 are the glass transition temperatures of pure water and of the pure solute, andk is a solute
specific constant. In this study, we use a value of 136 K forTg1(Johari et al., 1987; Kohl et al., 2005). The colored lines in Fig. 3 are fits to the experimental data using Eq. 1.
10
These fits yield values forTg2 andk as listed in Table A3 in Appendix A3 together with a sensitivity analysis of the fit parameters.
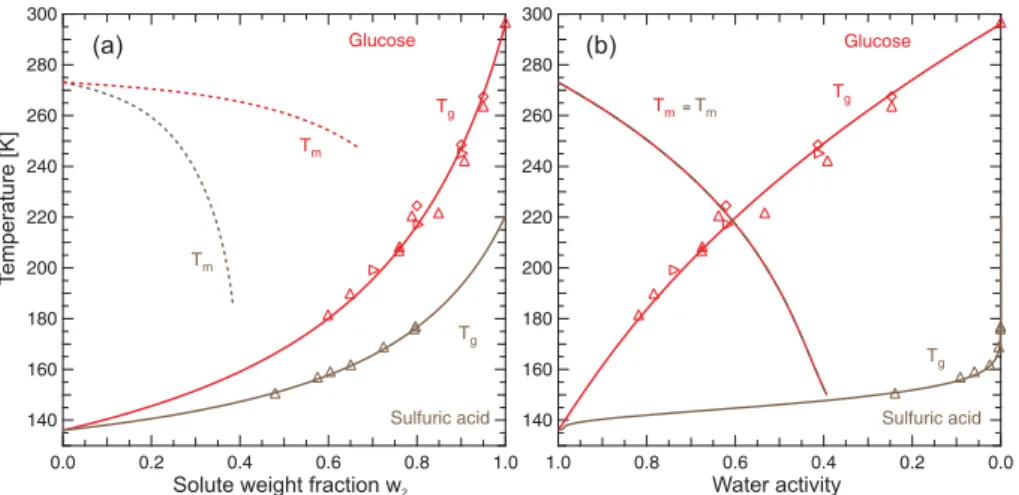
5 Concentration versus water activity dependence of Tmand Tg
In the atmosphere, the concentration of an aqueous aerosol particle is determined by the ambient relative humidity, RH. Therefore, state diagrams in terms of the solute
15
weight fraction as those shown in Figs. 2 and 3 have only limited applications for at-mospheric considerations. A much better way is to show data in terms of temperature versus water activity, aw, because RH is equal to aw of aerosol particles that are in equilibrium with the ambient relative humidity and for which the Kelvin effect is negligi-ble. This approach is shown in Fig. 4 for aqueous glucose and sulfuric acid solutions. In
20
addition to theTgcurves, the ice melting point curves (Tm) are also shown. In panel (a) both substances show a decrease inTm with increasing solute content, but a very dif-ferent dependence onw2. The glass transition temperatures increase with decreasing water content with glucose exhibiting higherTgvalues than H2SO4at similar concen-trations. In panel (b), the same data are shown as a function of the water activity. Now
25
theTm curves of both solutes collapse onto a single line because the water activity of any aqueous solution in equilibrium with ice is the same independently of the nature of the solute (Koop, 2002). The shape of the twoTgcurves is also modified. Both curves
ACPD
8, 9263–9320, 2008 Do atmospheric aerosols form glasses? B. Zobrist et al. Title Page Abstract Introduction Conclusions References Tables Figures ◭ ◮ ◭ ◮ Back CloseFull Screen / Esc
Printer-friendly Version
Interactive Discussion
start atTg1=136 K and end at the solute specific Tg2 value. However, the glass tran-sition curve in H2SO4 solutions does not exceed temperatures of 160 K for the most part of theaw-range. Only at aw .0.05, Tgincreases almost vertically towards Tg2. In contrast,Tgin glucose solutions increases considerably already at high water activities. The difference inTg between the two solutes is strongly enhanced when compared to
5
panel (a) because of the differentw2↔aw dependence of the two solutes. A H2SO4 solution with a solute weight fraction ofw2=0.6 exhibits a water activity of only 0.05, whereas a similarly concentrated glucose solution exhibits a water activity of ∼0.8. This differing behavior can be understood by considering that H2SO4 (like other inorganic salts and acids) dissociates into charged ions, which strongly affect water activity even
10
at smaller concentrations. In contrast, glucose and other non-dissociating water sol-uble organics interact with water mainly through hydrogen bonds and van der Waals forces, with a less dramatic effect on water activity. Therefore, at a given solute weight fraction, inorganic solutions typically exhibit a lower water activity than organic solu-tions. Applying the examples shown in Fig. 4 to the atmospheric situation we find that
15
at high and intermediate relative humiditiesTgof H2SO4is too low to be of atmospheric relevance. Similar conclusions result from an analysis of HNO3 and NH4HSO4 solu-tions (not shown). Moreover, at low relative humidities inorganic substances present in the atmosphere tend to crystallize instead of forming glasses: for example, we did not observe glass formation in ammonium sulfate solutions due to the crystallization of
20
(NH4)2SO4. In contrast, organic solutes with properties similar to glucose may read-ily form glasses under atmospheric conditions. Therefore, we have investigated Tg of aqueous solutions of a large variety of organic substances. As discussed above, the glass transition temperatures are required as a function of water activity for atmo-spheric applications. The AIM-model by Clegg et al. (1998) allows the calculation of
25
the water activity in inorganic ionic solutions typically found in the atmosphere over a wide temperature and concentration range. For most organic substances of interest no such parameterizations are available, since most of the existingawdata were mea-sured at ambient temperatures or above. Group contribution methods such as UNIFAC
ACPD
8, 9263–9320, 2008 Do atmospheric aerosols form glasses? B. Zobrist et al. Title Page Abstract Introduction Conclusions References Tables Figures ◭ ◮ ◭ ◮ Back CloseFull Screen / Esc
Printer-friendly Version
Interactive Discussion
(Fredenslund et al., 1975) are often inaccurate for the prediction of activity coefficients of multi-functional organics and usually they are not parameterized for use at low tem-peratures. Therefore, we have measured not only Tg but also aw of the investigated
5
solutions of organics with a commercial water activity meter in the temperature range between 289 K and 313 K. This data together withawvalues derived from the melting point depression temperatures below 273 K were used to extrapolate water activities to low temperatures and, thus, allow an estimate of aw at the measuredThom and Tg values (see Appendix A4).
10
6 Tgin binary aqueous organic solutions
In the previous section we have seen that organic aerosol constituents seem to have a tendency to form glasses at temperatures and relative humidities relevant for atmo-spheric considerations. Hence, we focus the subsequent discussion on glass transi-tions of pure organic or organic-rich aqueous solutransi-tions. Figure 5 shows the glass
tran-15
sition temperatures together with homogeneous ice nucleation and ice melting temper-atures for various aqueous organic solutions as a function of the solution water activity. The raw data as a function of the solute weight fraction are listed in Table A1 and the conversion to the water activity scale has been performed as explained in the previ-ous section and Appendix A4. The investigated substances have either been identified
20
in atmospheric aerosols or represent substances that are atmospherically relevant in terms of functional groups and molar mass.
Panel (a) depicts the experimental results for aqueous solutions of polyols with 4, 6, 8 and 10 carbon atoms (C4-C10) and a C:O ratio of 2:1. The molar masses increase from 90.1 g mol−1 for the C4 polyol up to 220.3 g mol−1 for the C10 polyol. The Tg curves
25
of the polyol solutions rise from 136 K ataw=1 to the glass temperatures of the pure polyols (Tg2) ataw=0 (Note that only a limited range is shown in the figure). In general, the measured data points are well reproduced by the Gordon-Taylor equation shown as the colored curves in the figure. For a givenaw, the glass transition temperature of
ACPD
8, 9263–9320, 2008 Do atmospheric aerosols form glasses? B. Zobrist et al. Title Page Abstract Introduction Conclusions References Tables Figures ◭ ◮ ◭ ◮ Back CloseFull Screen / Esc
Printer-friendly Version
Interactive Discussion
a polyol solution is higher for higher molar mass of the polyol and this trend becomes more pronounced at lower water activities. TheTgcurve for the C4 aqueous solutions is almost horizontal, sinceTg2 of pure C4 is only about 20 K higher than that of pure water. TheTgcurve for C10 aqueous solutions on the other hand strongly increases to theTg value of pure C10. The C6 and C8 curves lie in between the C4 and the C10
5
curves corroborating a clear trend to higherTg values with increasing molar mass for this series of polyols. The experimentally determinedT
′
gvalues (open triangles) usually agree nicely with theTg′ value derived from the intersections between theTmcurve and theTgcurves. The lowest measuredTgfor the C6 solutions (green triangle atT ≈165 K andaw≈0.8) falls clearly below the homogeneous ice nucleation curve (solid black line).
10
According to Koop et al. (2000), such a solution should freeze at a temperature of about 187 K. However, neither an emulsion nor a bulk sample froze during the cooling cycle, but ice crystallization was observed upon warming to ∼10 K above Tg representing the case shown in Fig. 2c. The experimental Tm data fall almost perfectly onto the ice melting curve, indicating that theawparametrization for the polyols are accurate at
15
these temperatures. The experimentalThom data of the polyol solutions show a small but systematic deviation from the homogenous ice nucleation curve that increases at lower water activities. It is not clear whether this deviation is due to uncertainties in the extrapolation ofaw to low temperatures or, alternatively, due to hindered ice formation as a consequence of the high viscosity of the C6, C8 and C10 solutions.
20
Panel (b) compares data of aqueous solutions of a mono- (glucose), di- (sucrose) and trisaccharide (raffinose). The C:O ratio increases slightly from 6:6 for glucose, over 12:11 for sucrose up to 18:16 for raffinose. A similar trend as in panel (a) is observed: A larger molar mass of the organic solute leads to a higherTgtemperature at a given water activity. TheTg2 values of the anhydrous sugars were estimated based on the
25
Gordon-Taylor equation as 296.1 K, 335.7 K and 395.7 K for glucose, sucrose and raffinose, respectively. The data are in very good agreement with directTg measure-ments on the pure melt investigated in this study and by Roos (1993), with values of 296.1 K for glucose and 333 K for sucrose. Note that for similar molar masses theTg
ACPD
8, 9263–9320, 2008 Do atmospheric aerosols form glasses? B. Zobrist et al. Title Page Abstract Introduction Conclusions References Tables Figures ◭ ◮ ◭ ◮ Back CloseFull Screen / Esc
Printer-friendly Version
Interactive Discussion
values of the pure sugars are higher than those of the pure polyols: The glass tran-sition of pure glucose is about 70 K higher than that of the pure C8, although their molar masses differ by less than 2 g mol−1. This indicates that, in addition to molar mass, the molecular structure of the organic molecules significantly affects their glass temperature. The same trend holds also for theT
′
gvalues but it becomes weaker the
5
higher theawvalues. The experimentally determinedT ′
gdiffer by about 5 K from those given by the intersection of the melting point and glass curves. This discrepancy may result from the experimental difficulty to determineT
′
g or from inaccuracies in the con-version from weight fraction to water activity. Several experimentalTgare clearly below theThom curve, e.g., for sucrose solutions withw2=0.5 and 0.6 (see the green
trian-10
gles at aw values of 0.875 and 0.825 in Fig. 5b). In these experiments, the samples were hyperquenched at a very large cooling rate of 75 K s−1 (Luyet and Rasmussen, 1968). On the other hand, at moderate cooling rates of 10 K min−1 homogeneous ice nucleation was observed for sucrose solutions withw2=0.55 (green square with a Thom of ∼210 K, Miyata and Kanno, 2005). This comparison indicates that in the region
15
close to the intersection of theThomandTgcurves also cooling rates are very important in determining whether glass formation or ice crystallization occur upon cooling. If a glass forms upon cooling in that area, then ice usually crystallizes upon warming (see discussion of Fig. 2). This was also observed for the two raffinose solutions with aTgof ∼190 K. The good agreement of the experimentalTmandThom data with the predicted
20
theoretical lines indicates again that theawparametrization for the sugar solutions are quite accurate to low temperatures.
Panel (c) of Fig. 5 compares three polyols with almost the sameTg2 value, but with different C:O ratios. At low water activities theTg curve for glycerol (C:O ratio of 1:1) reveals the steepest slope followed by 1,2,6-hexanetriol (C:O ratio of 2:1) and
2,5-25
hexanediol (C:O ratio of 3:1) indicating that the glass transition of aqueous solutions depends also on the hydrophilicity of the substance. For the moderately hydropho-bic 2,5-hexanediol the plasticizing effect of water is less effective than for the very
ACPD
8, 9263–9320, 2008 Do atmospheric aerosols form glasses? B. Zobrist et al. Title Page Abstract Introduction Conclusions References Tables Figures ◭ ◮ ◭ ◮ Back CloseFull Screen / Esc
Printer-friendly Version
Interactive Discussion
hydrophilic glycerol. Thus the 2,5-hexanediol glass curve exhibits high values over a large water activity range and drops off rather steeply to the glass temperature of pure water only at highaw.
Finally, we show that glass formation is not restricted to organic molecules with hy-droxy (−OH) functionalities, but occurs also for other organic substances representing the water soluble organic compounds (WSOC) of atmospheric aerosols. Panel (d)
5
depicts the Tg, Thom and Tm measurements for 4-hydroxy-3-methoxy mandelic acid, levoglucosan and an aqueous mixture of 5 different dicarboxylic acids (M5; consist-ing of malic acid, maleic acid, malonic acid, glutaric acid and methylsuccinic acid, see Appendix A1 for details). Levoglucosan is a biomass burning marker (e.g., Graham et al., 2002; Decesari et al., 2006), and 4-hydroxy-3-methoxy mandelic acid (hereafter,
10
HMMA) is an aromatic compound with a structure that is very similar to vanillic acid (4-hydroxy-3-methoxy benzoic acid), which has been proposed by Decesari et al. (2006) as a model substance of the WSOC in atmospheric aerosols. Furthermore, the M5 mixture was chosen because dicarboxylic acids are ubiquitous in the organic aerosol in remote and urban locations (e.g., Kawamura and Ikushima, 1993; Graham et al.,
15
2002; Narukawa et al., 2003) and are thought to have primary (e.g., Kanakidou et al., 2005) and secondary sources (e.g., Ervens et al., 2004). The highestTg curve is that of HMMA, which is in agreement with its large molar mass. AlsoTgremains quite high even at largeawvalues, because of its moderate hydrophobicity. TheTg-awrelationship of levoglucosan, a C6-anhydrosugar, resembles that of the structurally similar C6-sugar
20
glucose. TheTg curve of the aqueous M5 solutions is similar to that of glycerol solu-tions. This is due to the fact that the dicarboxylic acids exhibit a similar hydrophilicity as glycerol andTg2 of the anhydrous M5 mixture is also quite low.
Two major points influencing the glass temperatures of organic substances can be summarized from Fig. 5: Firstly, the higher the molar mass of an organic solute the
25
higher isTgof its aqueous solution at a given water activity. Secondly, in aqueous solu-tions of more hydrophobic moleculesTgremains at higher temperatures with increasing water content over a largeraw-range when compared to more hydrophilic molecules.
ACPD
8, 9263–9320, 2008 Do atmospheric aerosols form glasses? B. Zobrist et al. Title Page Abstract Introduction Conclusions References Tables Figures ◭ ◮ ◭ ◮ Back CloseFull Screen / Esc
Printer-friendly Version
Interactive Discussion
Therefore, aerosol particles containing larger and more hydrophobic organic molecules are more likely to form glasses at intermediate to high relative humidities in the upper troposphere (UT). However, the organic aerosol in the UT is typically an internal mix-ture of various organic molecules and inorganic salts and acids. Therefore, we also
5
investigatedTgof selected multi-component solutions.
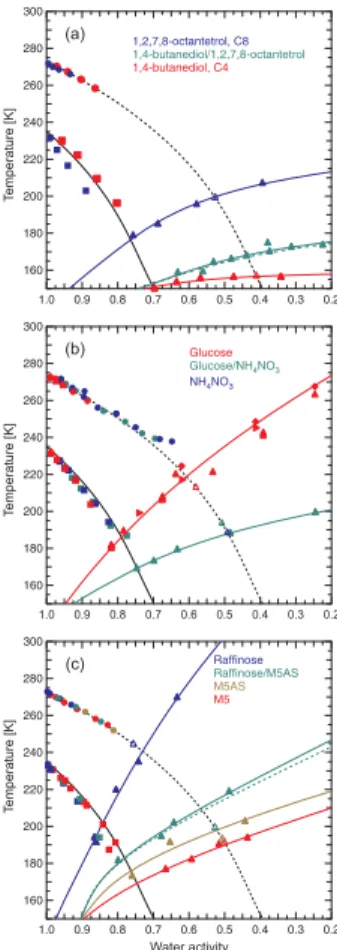
7 Tgof aqueous multi-component solutions
Figure 6 showsTg,Tm and Thom for different multi-component solutions. The organic mixture in panel (a) consists of a 1:1 mixture (by mass) of the polyols C4 and C8 with varying amounts of water. The Gordon-Taylor equation was used to determinek and
10
Tg2 of this mixture and the Zdanovskii-Stokes-Robinson (ZSR) mixing rule (Stokes and Robinson, 1966) was employed to predict the water activities of the ternary system fromawdata of the binary systems. The resulting ternaryTgcurve (green solid line) is closer to that of C4 (solid red line), i.e., closer to the binary system with the lower glass transition temperatures. The dashed green line is not a fit to the data, but aTg curve,
15
that was predicted from the two binaryTg curves using a mixing rule that depends on the molar masses and weight fractions of the individual polyols:
Tgt(wtot) = w2(A) Mw(A) T b(A) g (wtot) + w2(B) Mw(B) T b(B) g (wtot) w2(A) Mw(A)+ w2(B) Mw(B) , (2)
where Tgt is the glass transition temperature of the ternary solution containing both solutesA and B, and Tgb(A) and T
b(B)
g are the glass transition temperatures of binary
20
solutions of either solute A or B, respectively. wtot=w2(A)+w2(B) is the total solute weight fraction in the ternary solution and w2(A) and w2(B) are the individual weight fractions of the two solutesA and B in the ternary solution, respectively. Mw(A) and
ACPD
8, 9263–9320, 2008 Do atmospheric aerosols form glasses? B. Zobrist et al. Title Page Abstract Introduction Conclusions References Tables Figures ◭ ◮ ◭ ◮ Back CloseFull Screen / Esc
Printer-friendly Version
Interactive Discussion
according to Eq. 2 (dashed green line) is in excellent agreement with the experimental
25
data shown in Fig. 6, suggesting thatTgof ternary solutions consisting of two organics from the same chemical compound class can be predicted from the properties of the individual binary systems.
Panel (b) shows theTgcurve of a 1:1 mixture (by mass) of a non-dissociating organic compound (glucose) with a salt (NH4NO3). The water activities of the ternary solutions
5
were again calculated using the ZSR mixing rule. Unfortunately, theTgvalues of binary NH4NO3 solutions could not be determined experimentally, because NH4NO3 always crystallized upon cooling before forming a glass. Only in dilute NH4NO3solutions it was possible to determine Tg′ after homogeneous ice nucleation in the emulsion droplets (blue open triangle). The ternary glucose/NH4NO3 glass curve is far below that of
10
binary glucose solutions. Assuming a behavior similar to that of the mixture in panel (a) we expect theTg curve for binary NH4NO3 solutions to be not far below the ternary curve, in agreement with the comparison of theT
′
gvalues determined for these systems. Figure 6c shows Tg for solutions containing a eutonic mixture of (NH4)2SO4 with the dicarboxylic acids of the M5 mixture (M5AS; the exact mixing ratios are given in
15
Appendix A1 and differ slightly from those of the M5 mixture). M5AS was then mixed 1:1 (by mass) with raffinose and varying amounts of water and the correspondingTg curve is shown as the green line. (Note that theTgvalues of binary (NH4)2SO4solutions could not be determined experimentally, because crystallization of either (NH4)2SO4or ice was always observed). The water activities for the raffinose/M5AS and the M5AS
20
systems were determined from experiments similar to those for the binary aqueous systems described in Sect. 5. The absolute Tg values as well as the shape of the Tg curve for the raffinose/M5AS solutions are much closer to theTg curve of the M5AS system. The dashed green line shows theTg curve that was predicted from the two “binary”Tg curves (M5AS and raffinose) employing the mixing rule of Eq. 2 and using
25
the molar masses of the undissociated compounds. Both green curves (predicted and fitted to the actual data) agree nicely and, thus, support the conclusion, that Tg in multi-component aqueous solutions dominated by organic solutes can be estimated
ACPD
8, 9263–9320, 2008 Do atmospheric aerosols form glasses? B. Zobrist et al. Title Page Abstract Introduction Conclusions References Tables Figures ◭ ◮ ◭ ◮ Back CloseFull Screen / Esc
Printer-friendly Version
Interactive Discussion
reasonably well from theTgvalues of the binary solutions.
Because of the complex nature of the glass transition process and its intricate de-pendence on the characteristics of the different solutes, it is too early to generalize the
5
results presented in this section. Nevertheless, based on the few multi-component aqueous solutions investigated here, we suggest that Tg curves of aqueous multi-component solutions fall between those of the binary systems. Also, the location and shape of the ternary curve is typically more similar to that of the binary system with the lowerTgvalues. This behavior was observed for aqueous mixtures of organics and for
10
organic/inorganic aqueous mixtures, that are dominated by organic solutes.
8 T
′
gand T ∗
gof organic solutes and of multi-component solutions
As discussed above,Tg′ is an important indicator for the temperature and concentration range in which ice crystallization is inhibited (even if critical ice germs nucleated) at the cost of glass formation in an aqueous system. Also, we have shown that bothTg and
15
T
′
g are dependent on the molar mass of an organic solute. Next, we will try to better constrain this dependence.
Based on experimental data of 55 commercial starch hydrolysis products, Levine and Slade (1986) found a linear relationship betweenT
′
gand the inverse molar mass of these compounds for a range of molar masses from 180 g mol−1up to 39 000 g mol−1.
20
These results indicate that a larger molar mass of the organic molecules leads to a higherTg′ value due to the increase in viscosity of the aqueous solutions with increas-ing molecular size of the solute. Figure 7a showsT
′
g of various organic solutes (filled symbols) as well as for multi-component solutions (open symbols) from this study, com-plemented with literature data of solutes with the same functional groups. TheT
′ g
val-25
ues for all solutions increase with decreasing inverse molar mass (or increasing molar mass), from 156.8 K for the C4 polyol up to 244.4 K for raffinose. A linear trend,
in-ACPD
8, 9263–9320, 2008 Do atmospheric aerosols form glasses? B. Zobrist et al. Title Page Abstract Introduction Conclusions References Tables Figures ◭ ◮ ◭ ◮ Back CloseFull Screen / Esc
Printer-friendly Version
Interactive Discussion
dicated by the solid black line nicely represents the data in a molar mass range from 90 g mol−1to ∼500 g mol−1and can be approximated as:
Tg′ = −7813.5 · Mw−1+ 253.3, (3)
whereT
′
g is given in K and Mw is the molar mass of the substance in g mol −1
. The
5
dashed black lines in Fig. 7a depict the confidence bands for the linear fit on the level of one standard deviation. There is a maximum difference between the T
′
g values of organic solutions of roughly 25 K at a similar molar mass, which most likely is the result of the different chemical structures and hydrophilicities of the molecules, as dis-cussed above. The C8 polyol and glucose have similar molar masses (blue and red
10
circles at an inverse molar mass of ∼0.0055), but their T
′
g differ by about 15 K. T ′ g of the aromatic compound HMMA at ∼230 K is even higher than that of sucrose de-spite having only a molar mass that is ∼60% of that of sucrose. For the data shown in Fig. 7a, the molecules containing a ring structure seem to exhibit a higher T
′ g than open chain molecules, but the data base is too small to draw any general conclusions.
15
Also included in Fig. 7a are T
′
g values of multi-component solutions (open symbols). The average molar masses of the multi-component solutions were calculated by av-eraging the masses of the compounds according to their molar ratios (all compounds were treated as undissociated). TheT
′
gvalues of the multi-component solutions scat-ter slightly more than those of binary solutions, however, based on the present data it
20
appears to be appropriate to conclude thatT
′
gof both binary organic aqueous solutions and multi-component solutions that are dominated by organic solutes depend primarily on the molar mass of the solutes.
BesidesT
′
g, eachTgcurve has another very important characteristic point in the state diagram: the intersection between the homogeneous ice freezing curveThom and the
25
glass transition curve Tg. We define this point as T ∗
g, which adopts a unique value for every solute. Tg∗ designates the region of crossover between homogeneous ice nucleation and glass formation: At lower solute concentrations (or higheraw) aqueous
ACPD
8, 9263–9320, 2008 Do atmospheric aerosols form glasses? B. Zobrist et al. Title Page Abstract Introduction Conclusions References Tables Figures ◭ ◮ ◭ ◮ Back CloseFull Screen / Esc
Printer-friendly Version
Interactive Discussion
solution droplets will homogenously nucleate ice, and at higher solute concentrations (or lower aw) glass formation is more likely. Since no experimental technique exists to measure Tg∗ directly, we derive it from the intersection of the Thom curve with the experimentally determinedTgcurves in the state diagrams shown in Figs. 5 and 6. In
5
Fig. 7b we showTg∗for the investigated organic and multi-component solutions, again as a function of the inverse molar mass of the solutes. The data can be described nicely by a linear fit given by:
T∗
g = −5145.1 · M −1
w + 211.6. (4)
Here,Tg∗ is given in K and Mw is the molar mass of the solute in g mol −1
. In general,
10
the same trend as forTg′ is observed: T ∗
g increases with decreasing inverse molar mass (increasing molar mass). For a given molar mass, the substance with the lowest hy-drophilicity shows the highestT∗
g values. For example, the aromatic compound HMMA exhibits the largestT∗
galthough its molar mass is more than a factor of 2.5 smaller than that of raffinose. In addition, theTg∗ data of the multi-component solutions agree well
15
with the data of the binary organic solutions. For a given substance, the difference betweenT
′ gandT
∗
g is smaller when theTgcurve increases strongly at high water activ-ities and becomes more flat at lower water activactiv-ities as is typical for more hydrophobic solutes, such as the aromatic compound HMMA or 2,5-hexanediol.
Both T
′ g and T
∗
g have important implications for the atmospheric situation because
20
they can be used as indicators of whether atmospheric aerosols are more likely to form ice particles or glasses at a given temperature and relative humidity. This will be explored in more detail in the following section.
9 Atmospheric implications
Highly viscous or glassy aerosol particles may affect several physical and chemical
25
ACPD
8, 9263–9320, 2008 Do atmospheric aerosols form glasses? B. Zobrist et al. Title Page Abstract Introduction Conclusions References Tables Figures ◭ ◮ ◭ ◮ Back CloseFull Screen / Esc
Printer-friendly Version
Interactive Discussion
(e.g., Zahardis and Petrucci, 2007), and presumably will be inhibited in glassy aerosol particles, thereby leading to an extended aerosol lifetime with respect to chemical de-composition. The slow molecular diffusion of water within glassy aerosol particles can drastically retard or even entirely prevent water uptake from the gas phase and inhibit ice nucleation and/or ice growth. Water uptake by an aerosol increases its scattering
5
intensity and, therefore, affects climate forcing by the direct aerosol effect. Moreover, water uptake is an essential process that precedes and accompanies cloud formation and may therefore also influence cloud properties and/or occurrences.
Gas and liquid phase water diffusion is typically fast enough to justify the assump-tion that aerosols are in equilibrium with ambient relative humidity. However, if diffusion
10
within aerosol particles is drastically diminished, this assumption may no longer hold. The molecular diffusion of water within aqueous solutions is expressed by the diffu-sion coefficientDH2O, a quantity that is not well known for aqueous organic/inorganic solutions at low temperatures. Rampp et al. (2000) measured the self-diffusion coeffi-cient of water in several aqueous carbohydrate solutions in the temperature range from
15
273 K to 353 K. Their results indicate a reduction ofDH2Owith increasing concentration and decreasing temperature. A recent model study by He et al. (2006) allows for the calculation ofDH2Oin aqueous glycerol, fructose, sucrose and trehalose solutions over the entire concentration range down to upper tropospheric temperatures. DH2O in all these solutions rarely exceeds a value of 10−20 m2s−1atTgover the entireawrange.
20
This implies that a water molecule would need a time interval ∆t of about one day to
diffuse into an aerosol particle with a size of ∆×=50 nm:
∆t = (∆x) 2 DH2O = (50 · 10 −9 m)2 10−20m2s−1 = 2.5 · 10 5s ≥ 1 day. (5)
Furthermore, DH2O increases only moderately with increasing temperature and still exhibits values of ∼10−15m2s−1 at about 20 K above Tg. This suggests that water
25
uptake is significantly delayed in the temperature range just aboveTgand completely inhibited once a glass has formed in these solutions.
ACPD
8, 9263–9320, 2008 Do atmospheric aerosols form glasses? B. Zobrist et al. Title Page Abstract Introduction Conclusions References Tables Figures ◭ ◮ ◭ ◮ Back CloseFull Screen / Esc
Printer-friendly Version
Interactive Discussion
Because the glass transition temperature of solutions dominated by organics primar-ily depends on the average molar mass of the solutes (see Fig. 7), one needs to know the molar mass range of aerosol constituents to estimate theirTg. The fraction of low molar mass organic compounds in aerosol particles depends on gas/particle partition-ing. Acetic acid and glyoxal with molar masses of ∼60 g mol−1 belong to the smallest
5
organic compounds that partition to a certain extent into the condensed aerosol phase (Kawamura et al., 1996a,b; Fisseha et al., 2006). This lower molar mass limit might also apply to the UT, if we assume that the shift to the condensed phase due to lower temperatures is balanced by the opposite shift due to their lower concentrations in the upper troposphere. The aerosol components with the highest molar masses are HULIS
10
(humic-like substances) with masses up to 500 g mol−1and average molar masses in the range of 200–350 g mol−1(Kiss et al., 2003). This substance class typically repre-sents 20–50 % of the total water soluble organic carbon (Kriv ´acsy et al., 2008). A molar mass range from 60–500 g mol−1is consistent with the results of Kriv ´acsy et al. (2001), who measured aerosol molar mass at the high alpine station Jungfraujoch
(Switzer-15
land). Whether the average molar mass of an aerosol will be at the lower or higher end of this range depends strongly on the origin and history of air masses. Hence, for the following study of atmospheric scenarios, we define three different aerosol types: First, an aged highly hydrophilic aerosol containing predominantly low molar mass organics, such as the M5 mixture investigated above. Second, a biomass burning aerosol
con-20
sisting of low to high molar mass organics and a minor fraction of inorganic molecules represented by the raffinose/M5AS mixture. Third, an aerosol dominated by organics with a larger fraction of high molar mass that is moderately hydrophilic such as HULIS, represented by HMMA. Finally, we use pure H2SO4aerosols as an inorganic reference case.
25
Figure 8 depicts an upper tropospheric trajectory, that reaches the atmospheric frost point, i.e., ice saturation, at ∼195 K and for which homogeneous ice nucleation is expected to occur at ∼192 K. Figure 9 shows schematically the physical states that the four model aerosol particles assume while following the trajectory shown in Fig. 8 from
ACPD
8, 9263–9320, 2008 Do atmospheric aerosols form glasses? B. Zobrist et al. Title Page Abstract Introduction Conclusions References Tables Figures ◭ ◮ ◭ ◮ Back CloseFull Screen / Esc
Printer-friendly Version
Interactive Discussion
low to high relative humidity and back to low relative humidities.
Panel (a) of Fig. 9 shows the case of aerosols either consisting of an M5 mixture or of H2SO4. Both model aerosol particles pass through the same physical states along the trajectory except at low relative humidities when the H2SO4particle is liquid and the M5 particle is a glass. (A H2SO4 aerosol particle would need temperatures
5
below 160 K to turn into a glass for RH>20%, see brown curve in Fig. 8). A
glass-to-liquid transition of the M5 particle takes place at RH≈40% (red triangle in Fig. 8). The liquid M5 aerosol now starts to take up water and thus grows. Below the frost point, the air is supersaturated with respect to ice, but ice nucleation does not yet proceed unless heterogeneous ice nuclei are present. Once the trajectory has crossed the
10
homogeneous ice freezing curve (RH≈81% equivalent to an ice saturation ratio Sice of ∼1.58 at ∼192 K) homogeneous ice nucleation occurs in the liquid aerosol and gas phase water will be depleted due to the growth of ice. A freeze concentrated solution is rejected from the ice phase and may form an inclusion within the ice or a liquid layer or droplet attached to the ice surface as illustrated in Fig. 9. The ice grows until the air is
15
depleted to the frost point relative humidity. Upon decreasing RH, when the trajectory has passed the frost point, RH(Tfrost), the ice crystal shrinks due to evaporation. Below RH≈40%, M5 turns into a glass, whereas H2SO4remains liquid.
The aerosol in the second example, panel (b), consists of an inorganic/organic mix-ture representing a biomass burning aerosol. This aerosol particle is in a glassy state
20
up to RH∼70%. Due to negligible water diffusion within the glassy particle, the so-lute concentration remains at that lower relative humidity value where the glass was formed. Hence, the particles are not in equilibrium with the gas phase relative humidity and only begin to take up water after passing the glass-to-liquid transition (green line). If relative humidity increases at a low enough rate, the particle’saw equilibrates with
25
the gas phase RH and ice nucleates at RH(Thom) as indicated in Fig. 9b. However, if the particle’saw lags behind the gas phase RH in a large updraft, homogeneous ice nucleation might be retarded. When ice forms, the freeze concentrated solution vit-rifies (indicated by the spotted sphere segment attached to the ice crystal), because
ACPD
8, 9263–9320, 2008 Do atmospheric aerosols form glasses? B. Zobrist et al. Title Page Abstract Introduction Conclusions References Tables Figures ◭ ◮ ◭ ◮ Back CloseFull Screen / Esc
Printer-friendly Version
Interactive Discussion
RH(Tfrost)<RH(T ′
g). Ice evaporation begins when the trajectory passes below the frost point RH leaving behind a glassy aerosol particle.
In the third example, the aerosol is represented by a rather hydrophobic and large molecule with a highTg∗. An HMMA aerosol is in a glassy state over a large RH range and, hence, does not take up water. Since the aerosol particle is still glassy atThom,
5
ice nucleation is inhibited and, thus, RH rises significantly above the threshold for homogeneous ice nucleation RH(Thom). At RH≈87% or Sice≈1.70, the glass-to-liquid transition takes place and the liquid HMMA aerosol particle may take up water vapor and nucleate ice. However, it is likely that ice nucleation and growth is still slow because of the reduced diffusion within the aerosol particle.
10
Two notes have to be added to the above discussion. For simplicity, we neglected the Kelvin effect, which starts to become important for particles with diameters smaller than 200 nm. Since in the upper troposphere small particles with diameters of roughly 50 nm prevail (e.g., Jensen et al., 2005) the Kelvin effect shifts homogeneous ice
15
nucleation to higher supersaturations in these regions (an increase inSice of ∼0.1 for 50 nm particles at 192 K). An analogous increase applies to the glass-to-liquid transi-tion and subsequent ice nucleatransi-tion, potentially leading toSice>1.8 for 50 nm particles
in panel (c) of Fig. 9. We also think that heterogeneous ice nucleation by a deposition mechanism on a glassy aerosol is unlikely since nanometer-sized glassy particles
ex-20
hibit a smooth convex surface that is disordered on a molecular level – characteristics that are converse to those that are known to promote heterogeneous nucleation such as the presence of kinks and steps or a molecular match with the ice lattice.
The examples discussed above all assume a homogeneous, completely internally mixed aerosol. Single particle in-situ measurements show that a large fraction, but not
25
the entire upper tropospheric aerosol is internally mixed (Murphy et al., 2006). If an air parcel contains a range of H2SO4-rich to organic-rich particles, homogeneous ice nucleation will occur first in the H2SO4-rich particles with the lowest viscosity that adapt fastest to the increasing relative humidity, similar to model calculations with reduced
ac-ACPD
8, 9263–9320, 2008 Do atmospheric aerosols form glasses? B. Zobrist et al. Title Page Abstract Introduction Conclusions References Tables Figures ◭ ◮ ◭ ◮ Back CloseFull Screen / Esc
Printer-friendly Version
Interactive Discussion
commodation coefficients for organic aerosols (K ¨archer and Koop, 2005). These newly formed ice crystals start to deplete the gas phase water to values below the threshold ofSice for homogeneous ice nucleation leaving the organic-rich aerosol particles un-frozen. Such a fractionation was indeed observed by DeMott et al. (2003) and Cziczo et al. (2004) who found that organic-enriched aerosol particles were less abundant than
5
sulfate aerosol particles in the residues of ice cloud particles, and that organic-enriched aerosol particles remained unfrozen to higher RH. The measurements by Cziczo et al. (2004) have been performed in the temperature range between 196 K and 225 K. At these temperatures organic-rich particles are likely to be present as glasses at low RH but turn into liquids before RH(Thom) is reached. This corresponds to the scenario
10
outlined in Fig. 9b with a retarded water uptake starting only after the glass-to-liquid transition has occurred. Based on the data in Fig. 7 we consider it unlikely that atmo-spheric aerosol particles are in the glassy state when they reach the homogeneous ice nucleation threshold at temperatures above ∼202 K, but below this temperature we expect a significant impact on ice nucleation depending on the average molar mass of
15
the aerosol constituents.
If ice nucleation is retarded in aqueous organic aerosol particles in an externally mixed aerosol, then selective ice formation in inorganic particles may also influence the composition of the aged upper tropospheric aerosol because particles that have grown ice start to sediment and may not be available for further ice cloud cycles.
Organic-20
rich, glassy aerosols may therefore become enriched in aged air masses, because they do not sediment and are also not prone to chemical decomposition. Such an aerosol would not form an ice cloud at the homogeneous ice nucleation threshold but only after the glass-to-liquid transition has occurred. HighSicevalues up to 2.0 have indeed been observed in recent field campaigns (Jensen et al., 2005; Lawson et al., 2008), leading
25
to a debate about the principle understanding of ice cloud formation (Peter et al., 2006) and water vapor measurements in the UT. We propose that the presence of organic glassy aerosol might be able to explain some of these observations. This hypothesis is indirectly supported by a recent field study by Denkenberger et al. (2007). In
single-ACPD
8, 9263–9320, 2008 Do atmospheric aerosols form glasses? B. Zobrist et al. Title Page Abstract Introduction Conclusions References Tables Figures ◭ ◮ ◭ ◮ Back CloseFull Screen / Esc
Printer-friendly Version
Interactive Discussion
particle measurements they observed that the highest degree of oligomerization was observed when the aerosol was photochemically aged and acidic. Therefore, the aged aerosol in the upper troposphere might indeed contain a high fraction of HULIS and,
5
therefore, might be present as glasses up to high relative humidities, with implications as discussed above.
10 Conclusions
To answer the title question of this study, “Do atmospheric aerosols form glasses?”, we investigated the glass transition temperaturesTgof a series of aqueous inorganic,
10
organic and multi-component solutions as a function of the solute concentration using a differential scanning calorimeter. The measuredTgvalues were transformed from the concentration to the water activity (=relative humidity) scale, which is more appropriate for atmospheric applications. The state diagrams determined in this way and the atmo-spheric scenarios discussed above lead us to suggest that organic-rich aerosols might
15
indeed be present in a glassy state in the atmosphere. In addition, the data shown above support a number of additional conclusions:
1. Glass formation was observed in most of the investigated aqueous solutions. At smaller concentrations homogeneous ice nucleation occurred in all solutions. At larger concentrations, typically at solute weight fractions above 0.3–0.6,
depend-20
ing on the type of solute, glass formation occurred. Increasing solute concentra-tions lead to a higherTg which can be described by the Gordon-Taylor equation over the entire concentration range.
2. Aqueous inorganic solutions containing sulfuric acid, ammonium bisulfate or nitric acid form glasses at high solute concentrations, butTgrarely exceed 180 K.
Am-25
monium sulfate and ammonium nitrate solutions did not form glasses when using moderate cooling rates, because either ice or the solute precipitated beforehand.