HAL Id: hal-00303033
https://hal.archives-ouvertes.fr/hal-00303033
Submitted on 6 Aug 2007HAL is a multi-disciplinary open access
archive for the deposit and dissemination of sci-entific research documents, whether they are pub-lished or not. The documents may come from teaching and research institutions in France or abroad, or from public or private research centers.
L’archive ouverte pluridisciplinaire HAL, est destinée au dépôt et à la diffusion de documents scientifiques de niveau recherche, publiés ou non, émanant des établissements d’enseignement et de recherche français ou étrangers, des laboratoires publics ou privés.
Balloon-borne radiometer measurement of Northern
Hemisphere mid-latitude stratospheric HNO3 profiles
spanning 12 years
M. Toohey, B. M. Quine, K. Strong, P. F. Bernath, C. D. Boone, A. I.
Jonsson, C. T. Mcelroy, K. A. Walker, D. Wunch
To cite this version:
M. Toohey, B. M. Quine, K. Strong, P. F. Bernath, C. D. Boone, et al.. Balloon-borne radiometer measurement of Northern Hemisphere mid-latitude stratospheric HNO3 profiles spanning 12 years. Atmospheric Chemistry and Physics Discussions, European Geosciences Union, 2007, 7 (4), pp.11561-11586. �hal-00303033�
ACPD
7, 11561–11586, 2007 Radiometer measurements of HNO3 M. Toohey et al. Title Page Abstract Introduction Conclusions References Tables Figures ◭ ◮ ◭ ◮ Back CloseFull Screen / Esc
Printer-friendly Version Interactive Discussion
EGU
Atmos. Chem. Phys. Discuss., 7, 11561–11586, 2007 www.atmos-chem-phys-discuss.net/7/11561/2007/ © Author(s) 2007. This work is licensed
under a Creative Commons License.
Atmospheric Chemistry and Physics Discussions
Balloon-borne radiometer measurement
of Northern Hemisphere mid-latitude
stratospheric HNO
3
profiles spanning
12 years
M. Toohey1, B. M. Quine2, K. Strong1, P. F. Bernath3,4, C. D. Boone4, A. I. Jonsson1, C. T. McElroy6, K. A. Walker1,4, and D. Wunch1,5
1
Department of Physics, University of Toronto, Toronto, ON, M5S 1A7, Canada
2
School of Engineering, York University, Toronto, ON, M3J 1P3, Canada
3
Department of Chemistry, University of York, Heslington, York, YO10 5DD, UK
4
Department of Chemistry, Waterloo University, Waterloo, ON, N2L 3G1, Canada
5
California Institute of Technology, Pasadena, CA, 91125, USA
6
Environment Canada, Downsview, ON, M3H 5T4, Canada
Received: 2 July 2007 – Accepted: 27 July 2007 – Published: 6 August 2007 Correspondence to: M. Toohey ([email protected])
ACPD
7, 11561–11586, 2007 Radiometer measurements of HNO3 M. Toohey et al. Title Page Abstract Introduction Conclusions References Tables Figures ◭ ◮ ◭ ◮ Back CloseFull Screen / Esc
Printer-friendly Version Interactive Discussion Abstract
Low-resolution atmospheric thermal emission spectra collected by balloon-borne ra-diometers over the time span of 1990–2002 are used to retrieve vertical profiles of HNO3, CFC-11 and CFC-12 volume mixing ratios between approximately 10 and 35 km altitude. All of the data analyzed have been collected from launches from a Northern
5
Hemisphere mid-latitude site, during late summer, when stratospheric dynamic vari-ability is at a minimum. The retrieval technique incorporates detailed forward modeling of the instrument and the radiative properties of the atmosphere, and obtains a best fit between modeled and measured spectra through a combination of onion-peeling and global optimization steps. The retrieved HNO3profiles are consistent over the 12-year
10
period, and are consistent with recent measurements by the Atmospheric Chemistry Experiment-Fourier transform spectrometer satellite instrument. This suggests that, to within the errors of the 1990 measurements, there has been no significant change in the HNO3summer mid-latitude profile.
1 Introduction
15
One of the central aims of the Middle Atmosphere Nitrogen TRend Assessment (MANTRA) mission is to evaluate observational evidence for changes in the compo-nents of stratospheric total reactive nitrogen (NOy). Towards this aim, two emission radiometer instruments have played an important and unique role in MANTRA balloon campaigns, due largely to the substantial flight heritage of the instrument design. The
20
instruments measure atmospheric thermal emission in the 8–14 µm (715–1250 cm−1) range, measuring the spectral emission features of many trace gas species, including emission at 11.3– µm due to nitric acid (HNO3).
HNO3 was first detected in the stratosphere though the use of balloon-borne filter radiometer instruments by Murcray et al. (1968), who soon afterwards identified the
25
inter-ACPD
7, 11561–11586, 2007 Radiometer measurements of HNO3 M. Toohey et al. Title Page Abstract Introduction Conclusions References Tables Figures ◭ ◮ ◭ ◮ Back CloseFull Screen / Esc
Printer-friendly Version Interactive Discussion
EGU
ference by other gases (Murcray et al.,1973). Balloon measurements led to a greater understanding of the vertical, latitudinal, and seasonal distribution of HNO3 (Murcray
et al.,1975) and the partitioning of active nitrogen between HNO3, NO2 and NO (e.g.
Evans et al.,1977;Evans et al.,1982). Subsequent measurements by space-based (seeSantee et al.,2004, and references therein), and balloon-borne instruments have
5
led to a wealth of retrieved HNO3profiles.
Unfortunately, deriving a picture of the long-term behaviour of HNO3 using the his-torical archive of retrieved profiles is complicated by inconsistencies in the spectro-scopic parameters used to retrieve profiles from radiance measurements. Laboratory measurements of the line intensities in the 11.3– µm band, in particular, have yielded
10
results which differ by as much as 30% (Flaud et al.,2006). Retrieved volume mixing ratio (VMR) magnitudes have been seen to be directly proportional to scaling of the line intensities (e.g.Irion et al.,2002), thus it is fair to say that there exist systematic discrepancies between the various retrieved profiles, with magnitudes up to 30%.
Furthermore, modern computational resources have allowed the improvement of the
15
algorithms used to retrieve trace gas profiles from radiance observations. The earliest retrievals were based upon an onion-peeling technique (e.g.Evans et al.,1976) which required smoothing of the raw data. Quine et al. (2005) have shown that the resulting profiles can be greatly affected by the somewhat arbitrary choice of smoothing param-eters. Also, the ability of modern retrieval algorithms to perform global fits can also
20
greatly improve results (Irion et al.,2002).
In this work, we have collected data recorded by emission radiometer instruments during three MANTRA balloon flights (1998, 2000, and 2002), and during two flights in 1990. All data was collected through launches from a northern mid-latitude site (Vanscoy, Saskatchewan, 52◦N, 107◦W) during late summer when dynamical
variabil-25
ity is minimal (Wunch et al.,2005). By analyzing the data with a consistent retrieval al-gorithm and spectroscopic line intensities, we connect modern measurements of HNO3 with historical ones, and in so doing, develop a semi-quantitative picture of long-term HNO3profile changes.
ACPD
7, 11561–11586, 2007 Radiometer measurements of HNO3 M. Toohey et al. Title Page Abstract Introduction Conclusions References Tables Figures ◭ ◮ ◭ ◮ Back CloseFull Screen / Esc
Printer-friendly Version Interactive Discussion 2 HNO3in a changing atmosphere
HNO3is the principal component of NOy in the lower stratosphere, where it acts as a reservoir for the active nitrogen species NO and NO2involved in catalytic ozone loss cycles.
Changes in the abundance of HNO3are related to changes in the abundance of NOy
5
and its partitioning. The source of stratospheric NOy is the transport of N2O from the troposphere. Tropospheric N2O has steadily increased by 3% per decade due to an-thropogenic activities.McLinden et al.(2001) estimate that this increase in N2O should lead to a 2.3% per decade increase in NOy, with the difference due to nonlinear NOy loss processes in the upper atmosphere. Meanwhile, the partitioning of NOyhas been
10
modified by the increase of stratospheric chlorine. Modelling studies byPrather et al.
(1984) have shown that as stratospheric concentrations of inorganic chlorine increase, ClONO2 becomes more important as a NOy reservoir, leading to possible declines in HNO3. HNO3 is also highly sensitive to stratospheric aerosol loading through the heterogeneous reaction:
15
N2O5+H2O → HNO3+HNO3, (R1)
which converts N2O5to HNO3in the presence of aerosols.
Long-term changes in HNO3 have been studied by use of ground-based observa-tions of total columns, and space based, vertically resolved HNO3 profiles. In an analysis of data comprised of solar spectra recorded with a grating spectrometer in
20
June 1951 and a set of observations obtained with a Fourier transform spectrometer between June 1986 and June 1990, all from the International Scientific Station of the Jungfraujoch in Swiss Alps,Rinsland et al. (1991) found no significant change in the June HNO3total column over this time span.Randel et al.(1999) report statistically sig-nificant decreases of order 2% per year in lower stratospheric, extra-tropical HNO3
be-25
tween 1993 and 1997 based on analysis of observations made by the Microwave Limb Sounder (MLS) on board the Upper Atmosphere Research Satellite (UARS). While
ACPD
7, 11561–11586, 2007 Radiometer measurements of HNO3 M. Toohey et al. Title Page Abstract Introduction Conclusions References Tables Figures ◭ ◮ ◭ ◮ Back CloseFull Screen / Esc
Printer-friendly Version Interactive Discussion
EGU
the trend analysis excluded from consideration the MLS data from 1991–1992 in an at-tempt to remove the effects of elevated aerosol loading due to the Mt. Pinatubo eruption of 1991, ground-based measurements of HNO3total columns, and model results indi-cate NOypartitioning may have been significantly perturbed until 1996 (Rinsland et al.,
2003). To the authors’ knowledge, no study has yet addressed long-term changes
5
in HNO3, apart from those due to aerosol loading from Mt. Pinatubo, by comparing consistent measurements from before and after the eruption.
The detection of trends in data is dependent upon the variability of the measured quantity (Weatherhead et al.,1998). In order to better understand the variability to be expected in HNO3profiles, we have studied simulated fields from the Canadian Middle
10
Atmosphere Model. CMAM is an extended version of the Canadian Centre for Climate Modeling and Analysis spectral General Circulation Model. The dynamical core and chemistry scheme are described byBeagley et al.(1997) andde Grandpr ´e et al.(1997) respectively. The current version of the model is discussed by Eyring et al. (2006), while the model results shown here are from a transient run described byEyring et al.
15
(2007). Chemical species have been saved every 18 h. Monthly mean CMAM HNO3, at the vertical level of peak VMR (∼24 km) and the model gridpoint closest to Vanscoy, Saskatchewan, are shown in Fig. (1) for ten years of the transient run. The seasonal cycle is apparent in the model output, with maximum HNO3 in winter, and minimum in summer. The 2σ monthly variability of the 18-hourly data is shown by the shaded
20
region. The average standard deviation of August HNO3 values is approximately 6% of the mean, while in winter the same metric is 16%. Summer measurements are therefore the most useful measurements for assessing long-term changes in HNO3.
3 Instrument design and history
The emission radiometer instruments used in this study were originally designed and
25
fabricated by the Canadian Atmospheric Environment Service (AES) in the early 1970’s based on a design first developed byPick and Houghton(1969). The main design
fea-ACPD
7, 11561–11586, 2007 Radiometer measurements of HNO3 M. Toohey et al. Title Page Abstract Introduction Conclusions References Tables Figures ◭ ◮ ◭ ◮ Back CloseFull Screen / Esc
Printer-friendly Version Interactive Discussion tures include (seeQuine et al.,2005, Fig. 2): a mechanical chopper at the entrance
slit, a spectral band-pass filter, a mercury-cadmium-telluride detector, amplifying elec-tronics, and an insulated liquid-nitrogen dewar surrounding the detector and optics, maintaining a temperature of approximately 77 K. The instrument design also includes a blackbody calibration flap that is automatically lowered to cover the field-of-view
pe-5
riodically. The flap, mounted externally to maintain a temperature above that of liquid nitrogen, has an embedded platinum resistance thermometer to provide temperature information necessary for performing in-flight radiometric calibration.
The radiometer measures the cumulative spectroscopic gas emission along an upward-looking slant path. Vertical atmospheric information is made available by
10
mounting the instrument, typically with a 20◦ elevation angle, on a balloon platform, and taking measurements while the balloon ascends. At the beginning of the balloon ascent, the instrument views a slant path through the whole atmosphere, and the radi-ance measurements are at a maximum. As the instrument ascends, the atmosphere below the instrument is excluded from the slant path, and the collected radiance
de-15
creases. A radiosonde is flown with the instrument in order to measure temperature and pressure, from which altitude is deduced via the hydrostatic relation.
When first fabricated, these instruments were furnished with five discrete band-pass filters to sample sections of the HNO3 emission band at 11.3– µm. Radiance esti-mates were derived from these band-pass measurements and a careful filter
calibra-20
tion. Later instrument designs replaced the discrete filters with circular variable filter (CVF) segments. With two segments mounted on a constantly turning wheel, the in-struments are able to scan a wavelength region from 8–14 µm (715–1250 cm−1) with a band-pass varying between 1% and 4% of the center wavelength. A number of these scanning emission radiometers were flown on a series of AES test flights from Vanscoy,
25
Saskatchewan from 1989–1991 before being used in non-recovered Arctic flights. Two surviving instruments, code-named MX-31 and MX-36 were refurbished with minimal modifications and used in the biennial MANTRA flights of 1998–2004.
ACPD
7, 11561–11586, 2007 Radiometer measurements of HNO3 M. Toohey et al. Title Page Abstract Introduction Conclusions References Tables Figures ◭ ◮ ◭ ◮ Back CloseFull Screen / Esc
Printer-friendly Version Interactive Discussion
EGU
4 Retrieval
Vertical profiles of HNO3 were originally retrieved from data measured by the emis-sion radiometer instrument through an onion-peeling algorithm, wherein the amount of HNO3 between two measurement altitudes was assumed to be proportional to the change in radiance between the measurements (Evans et al.,1976). Instrument
pa-5
rameters were determined through pre- and post-flight calibration.
Quine et al. (2005) introduced an updated retrieval algorithm for the emission ra-diometer, based on detailed forward modelling of the atmosphere and instrument. Given atmospheric temperature and pressure information, expected trace gas abun-dances, and some instrument calibration parameters, these models simulate the
spec-10
tral scans recorded by the instrument during flight. An optimization routine is used to obtain a best fit between the simulated and measured spectra by adjusting the instru-ment parameters and trace gas amounts. The main advantage of this technique is the incorporation of instrument parameters into the retrieved state vector, which allows the analysis of flight data without pre- and post- calibration data. We summarize the main
15
points of the retrieval algorithm below, with special emphasis on modifications made since the work ofQuine et al.(2005).
4.1 Atmospheric forward model
The atmosphere is modelled as a set of discrete 2-km-thick cells on a vertical grid. For each cell, a density-weighted effective mean temperature and pressure are determined
20
using the Curtis-Godson approximation (Houghton,1986), based on sonde measure-ments. Spectral absorption coefficients for each cell and for eight principal emitting gas species (H2O, CO2, O3, N2O, CH4, HNO3, CFC-11 and CFC-12) are calculated using the GENSPECT line-by-line code (Quine and Drummond, 2002) with HITRAN 2004 data (Rothman et al.,2005). HITRAN line parameter updates for HNO3 are included
25
(Flaud et al.,2006), based on work that went into the MIPAS (Michelson Interferometer for Passive Atmospheric Sounding) database. Radiative transfer code included in the
ACPD
7, 11561–11586, 2007 Radiometer measurements of HNO3 M. Toohey et al. Title Page Abstract Introduction Conclusions References Tables Figures ◭ ◮ ◭ ◮ Back CloseFull Screen / Esc
Printer-friendly Version Interactive Discussion GENSPECT package is used to calculate the radiance at each cell boundary based on
the blackbody emission and transmission of each cell. This simulated spectral radiance profile is linearly interpolated to the radiometer measurement heights, and passed as the main input into the instrument forward model.
4.2 Instrument forward model
5
The aim of the instrument forward model is to accurately simulate the true mapping between input radiance and detector response. While it is assumed that the individual instruments are for the most part functionally identical, a few instrument parameters defining unique properties of the instruments are necessary, and are included in the forward model.
10
Two parameters define the mapping between CVF angular position and wavenum-ber. A linear relationship between CVF position and wavelength is reported by the CVF manufacturer and assumed here. Initial estimates for the two parameters are produced manually by finding the angular position of the O3 and HNO3 peaks in the raw data. These instrument parameters are then included in the retrieval, and serve to shift and
15
stretch the data in order to match the simulated spectra.
A third instrument parameter is used in the construction of the instruments’ slit func-tion. The shape of the slit function, and the relationship between width and center wavelength is based upon Fourier transform spectrometer measurements of the band-pass of a sample CVF. A retrieved instrument parameter specifies the width of a boxcar
20
function convolved with this experimental slit function, accounting for the finite angular width of the focussed light passing through the CVF in each particular instrument.
The instrument is modelled so as to assume a relationship between detector re-sponse S at a given wavenumber ν′and incident radiance spectrum I for a given effec-tive viewing angle ˆθas follows:
25
S(ν′, z) = R(ν′, z) Z∞
0
ACPD
7, 11561–11586, 2007 Radiometer measurements of HNO3 M. Toohey et al. Title Page Abstract Introduction Conclusions References Tables Figures ◭ ◮ ◭ ◮ Back CloseFull Screen / Esc
Printer-friendly Version Interactive Discussion
EGU
where R is the instrument responsivity as a function of altitude, F is the slit function, and ε is a dark current level.
Dark current noise is defined for each scan by the average signal measured as an opaque section of the CVF attenuates the input radiation.
The effective viewing angle ˆθ is an approximate quantity describing the mean
ele-5
vation angle of light collected by the instrument. It is a function of the mounting angle of the instrument on the balloon payload, the field-of-view (FOV) function of the instru-ment describing the angular dependence of the instruinstru-ment’s ability to collect radiation, and the radiation field as a function of angle. In order to define a constant ˆθ for any measurement set, we assume a plane parallel atmosphere with homogeneous
emis-10
sion. The radiation field is then given by the cosecant function describing the variation of atmospheric slant path with elevation angle, and ˆθis given by the mean of the prod-uct of the FOV and cosecant functions. The FOV, as determined by laboratory tests, is roughly toroidal, with sensitivity extending to ±16◦ and maximum sensitivity at ±9◦. The effective viewing angle for an instrument mounted at 20◦elevation angle is
approx-15
imately 17◦.
In-flight blackbody calibration scans, performed every fifth scan at altitudes z′, are used to define instrument responsivity function R. The responsivity of the instrument changes as a function of altitude, due to changes in atmospheric pressure and tem-perature. The responsivity function is calculated as the ratio of detector output S (with
20
dark current ǫ subtracted) to the theoretical blackbody radiance curve (based on the temperature measured by the flap thermometer) convolved by the instrument slit func-tion: R(ν′, z′) = S(ν ′, z′ ) − ε R∞ 0 Bν(ν, T )F (ν − ν′)d ν . (2)
The responsivity function is then interpolated to the atmospheric measurement heights
25
ACPD
7, 11561–11586, 2007 Radiometer measurements of HNO3 M. Toohey et al. Title Page Abstract Introduction Conclusions References Tables Figures ◭ ◮ ◭ ◮ Back CloseFull Screen / Esc
Printer-friendly Version Interactive Discussion 4.3 Optimization
The objective function is defined as the sum of squares of the difference between the simulated and measured spectral scans. The optimal retrieval is that which minimizes this objective function.
Prior work (Quine et al.,2005) introduced the use of a non-linear global optimization
5
algorithm used to search for a global minimum by iteratively perturbing the full state vector of instrument parameters and trace gas species on the full vertical grid. While this technique produced reasonable results, it required large amounts of computing resources, and time. In order to produce results on a faster time scale we have modified this approach.
10
In the latest approach, a first stage retrieval defines a state vector of instrument parameters and scale factors which multiply a priori trace gas profiles. The objec-tive function to be minimized is based solely on spectral scans within the lowermost atmospheric cell. These low-altitude scans provide the most information regarding the instrument parameters, since they contain significant radiance contributions from
15
HNO3, CFC-11 and CFC-12. The Direct global optimization routine (Jones et al.,1993) is used.
A second stage performs onion-peeling while keeping the instrument parameters fixed. Starting at the uppermost atmospheric cell and moving down, trace gas amounts are adjusted in order to minimize the measurement residual within that cell in the local
20
spectral neighbourhood of the emission peak for each of the three species. The onion-peeling proceeds by the method of steepest descent, with the local gradient defined by first perturbing the cell VMR by 1%, and using the forward model to calculate the corresponding change in radiance. This process is repeated iteratively until the differ-ence between the measured and simulated radiances reaches a preset convergdiffer-ence
25
criterion. Weighting functions and averaging kernels for the onion-peeling algorithm are given inQuine et al.(2005).
ACPD
7, 11561–11586, 2007 Radiometer measurements of HNO3 M. Toohey et al. Title Page Abstract Introduction Conclusions References Tables Figures ◭ ◮ ◭ ◮ Back CloseFull Screen / Esc
Printer-friendly Version Interactive Discussion
EGU
difference being that the global optimization in step one is performed with the objective function defined using scans over the full altitude range. Comparison of simulated and measured spectral scans for a sample instrument and year are shown in Fig. (2). 4.4 Error analysis
Within the final onion peeling step of the retrieval, a root-mean-square (RMS) residual
5
is calculated between the simulated and measured spectra in the neighbourhood of the emission peak for each gas species fit. This RMS is divided by the local change in radiance for a given change in trace gas VMR in order to estimate the retrieval error based on radiance noise.
The recorded temperature of the blackbody flaps is another major source of
uncer-10
tainty. Laboratory tests have produced calibration coefficients for the two instruments used in MANTRA flights. Based on these tests, we conservatively estimate the tem-perature error of the MANTRA blackbody flaps as 2 K. Corresponding VMR errors have been calculated by simply performing the retrieval on raw data perturbed by the tem-perature uncertainty estimate. A 2 K error in temtem-perature leads to a HNO3VMR error
15
of approximately 10% at 24 km.
Lastly, the uncertainty in the effective elevation angle is estimated to be ±0.5◦, which corresponds to an error of approximately 2.5% at 24 km.
Radiance error, blackbody temperature error, and viewing angle error are added in quadrature to obtain the total error as a function of altitude.
20
5 Data
Each MANTRA mission has included on the instrument payload two radiometers, MX-31 and MX-36. The two instruments were mounted with different elevation angles, with one at 20◦ and the other at 30–40◦. Raw data of good quality was collected by both instruments during the flights of 1998 and 2000. One instrument failed in
ACPD
7, 11561–11586, 2007 Radiometer measurements of HNO3 M. Toohey et al. Title Page Abstract Introduction Conclusions References Tables Figures ◭ ◮ ◭ ◮ Back CloseFull Screen / Esc
Printer-friendly Version Interactive Discussion 2002, and both instruments failed in 2004, likely due to the effect of ice build-up on the
mechanically rotating CVF.
The AES test flights of 1990 suffered from a variety of fatal and non-fatal failures, making the raw data difficult to process. All flights suffered from poor data quality due to transponder drop-outs. Many flights also suffered from obvious mis-calibration of the
5
blackbody flap temperatures.
We include in this work results from two radiometer flights of August 1990. Of all data from the AES test flights, that from MX-19 on 30 August is of the highest quality. The ubiquitous transponder drop-outs and a higher-than-expected spectral noise are the data’s only significant faults. Data from MX-13, flown on 20 August 1990, suffered some
10
more critical non-fatal effects. Time synchronization between the radiometer clock and the radiosonde clock (in order to achieve proper altitude registration) was produced by defining a time offset that minimized the residual between the time derivatives of the sonde-measured air temperature and the instrument flap temperature. Furthermore, the flap temperature was bias corrected in order to bring the difference between flap
15
temperature and air temperature into a range comparable to the other flights. Due to these necessary pre-processing steps, we have estimated the temperature error of the blackbody flaps for this flight at 5 K.
We will compare our retrieved profiles of HNO3, CFC-11 and CFC-12 with results from the Atmospheric Chemistry Experiment – Fourier transform spectrometer
(here-20
inafter ACE) satellite instrument, launched in August 2003. We compare with ACE since it simultaneously retrieves all three species measured by the radiometers, and since ACE data has previously been used in a trend analysis of many species, including CFC-11 and CFC-12 (Rinsland et al.,2005). ACE is a Fourier transform spectrometer operating at high spectral resolution in the infrared, measuring atmospheric extinction
25
by solar occultation, from which profiles of temperature, pressure and dozens of con-stituents are retrieved through a global fitting algorithm (Bernath et al.,2005; Boone
et al., 2005). ACE results are from the version 2.2 data set. HNO3 retrievals from ACE employ a set of microwindows near 900 cm−1 (11.3– µm), and another set near
ACPD
7, 11561–11586, 2007 Radiometer measurements of HNO3 M. Toohey et al. Title Page Abstract Introduction Conclusions References Tables Figures ◭ ◮ ◭ ◮ Back CloseFull Screen / Esc
Printer-friendly Version Interactive Discussion
EGU
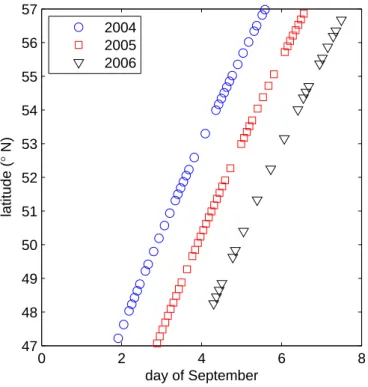
1700 cm−1, and use the HITRAN 2004 spectral database. ACE retrievals do not use theFlaud et al. (2006) HNO3 update, but the impact of the update to HITRAN 2004 in the 11.3– µm spectral range is small: the percent change in integrated line inten-sity over this band is on the order of 2% (Flaud et al., 2006). ACE retrievals have been shown to have good (relative differences of 5–10% below 30 km) agreement with
5
MIPAS operational retrievals (Wang et al.,2007a), and the MIPAS IMK-IAA research product (Wang et al.,2007b). Due to the orbit and solar occultation technique used by the ACE platform, the latitudinal distribution of measurements is highly dependant upon the time of year. ACE samples the Northern mid-latitudes in late summer briefly at the beginning of September (see Fig. 3), in close proximity to the window of past
10
MANTRA flights (24 August–3 September). For the comparison, we take averages of these late summer ACE measurements from 2004–2006 over the 10◦ latitude band centered on the latitude of Vanscoy, Saskatchewan.
6 Results
The retrieved profiles of HNO3are shown in Fig. (4). The mean profile for the MANTRA
15
missions (1998–2002) is shown on each panel for comparison. The retrieved profiles are remarkably consistent. The two retrieved profiles for the flights with simultaneous measurements (1998 and 2000) are equivalent at almost all altitudes. Small differ-ences between the simultaneous measurements are likely due to differdiffer-ences in hori-zontal sampling by the two instruments mounted with differing elevation angles, and the
20
local horizontal gradient in the HNO3field. The error in the 1990 profiles is large, due to uncertainties in the blackbody flap temperature and the measured radiance noise. Despite this, the profiles are not inconsistent with the MANTRA mean profile.
The MANTRA-mean profiles of HNO3, CFC-11 and CFC-12 are compared to mean Northern Hemisphere mid-latitude late summer retrieved profiles from the ACE
satel-25
lite instrument in Fig. (5). The comparison shows excellent agreement for HNO3: the MANTRA-mean HNO3profiles lie within the ACE 2σ variability for all but the very
high-ACPD
7, 11561–11586, 2007 Radiometer measurements of HNO3 M. Toohey et al. Title Page Abstract Introduction Conclusions References Tables Figures ◭ ◮ ◭ ◮ Back CloseFull Screen / Esc
Printer-friendly Version Interactive Discussion est altitudes. CFC profiles retrieved from the radiometers exibit a larger degree of
scatter and inter-instrument bias, as shown by the 1σ error bars. The individual re-trieved profiles have errors between 20 and 100% between 12 and 24 km (not shown). Despite this, the mean radiometer CFC profiles are comparable in shape to the ACE measurements, although somewhat larger in magnitude. In a comparison of
measure-5
ments by the Atmospheric Trace Molecule Spectroscopy Experiment (ATMOS) in 1985 and 1994 and by ACE in 2004,Rinsland et al.(2005) find very little difference between CFC-11 and CFC-12 stratospheric mixing ratios between 1994 and 2004. Given this result, we suggest the differences between ACE and MANTRA-mean CFC profiles are due to the large random error in the MANTRA radiometer measurements and the small
10
sample size.
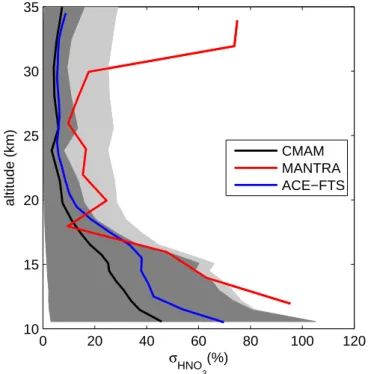
Are the MANTRA HNO3measurements consistent with the variability of the CMAM? Figure (6) addresses this question by plotting the percent standard deviation of the MANTRA retrieved profiles and that from the 18-hourly data from the final week of Au-gust over 10 CMAM years. The two profiles show similar structure, with larger values
15
in the lower stratosphere, and a broad minimum between 20 and 30 km. This com-parison is somewhat unfair as the MANTRA HNO3 measurements represent a very sparse sampling of the true HNO3 late-summer time series, with only three indepen-dent samples. We address the issue of sparse sampling by MANTRA by calculating the standard deviation of the model profiles using only three random samples. By
it-20
erating this procedure a large number of times, we produce a probability distribution function of the calculated standard deviation for the given MANTRA sampling, and de-fine a 99% confidence interval, shown in grey shading in Fig. (6). By repeating the same procedure, but adding a 10% random error onto the sampled CMAM profiles, we get an even better sense of the variability expected in the MANTRA measurements.
25
Between 15 and 30 km height, the variability of the MANTRA measurements is seen to be consistent with the variability of the model, given the sparsity and uncertainty of the measurements. Above 30 km and below 15 km, the variance of the MANTRA measurements is apparently adversely affected by instrument error.
ACPD
7, 11561–11586, 2007 Radiometer measurements of HNO3 M. Toohey et al. Title Page Abstract Introduction Conclusions References Tables Figures ◭ ◮ ◭ ◮ Back CloseFull Screen / Esc
Printer-friendly Version Interactive Discussion
EGU
The variance of ACE HNO3measurements is in excellent agreement with that of the CMAM (Fig.6). On the one hand, this close agreement validates our use of the model to explore the sampling issues inherent in the MANTRA measurements. On the other hand, under the assumption that the CMAM gives a good estimate of the variability of the true atmosphere, any difference between the CMAM and ACE variances should
5
be due to the random error of the ACE retrievals. The close agreement between the measured and modelled variance is then evidence that ACE measurements display a high degree of precision.
7 Conclusions
We have analyzed raw data recorded by low-resolution scanning infrared radiometers
10
from balloon flights in 1990, 1998, 2000, and 2002, and retrieved vertical profiles of HNO3using current spectroscopic line parameters and an efficient retrieval technique making use of both global-fitting and onion-peeling routines. The retrieved HNO3 pro-files show excellent agreement, in profile shape and magnitude, with measurements made by the ACE satellite instrument at a similar season and latitude region over the
15
years 2004–2006. The measurements were taken over a mid-latitude Northern Hemi-sphere site in late summer, when stratospheric dynamical and chemical variability is minimal. The variance of the HNO3profiles measured over the MANTRA era (1998– 2002) is in good agreement with the variability estimated by the CMAM, when the lim-ited sampling and error of the measurements are taken into account. The radiometer
20
measurements represent a consistent data set with samples before and after the Mt. Pinatubo eruption. While the error on the measurements from 1990 is large, and the data set is small, we see no significant change in the vertical profile of HNO3over this time span. This result may be taken as direct evidence that the –2% per year HNO3 trend measured by the UARS-MLS instrument over the time span 1993–1997 (Randel
25
et al.,1999) represents a slow relaxation of the NOy partitioning from the perturbed conditions after the Mt. Pinatubo eruption of 1991, as is suggested by the modelling
ACPD
7, 11561–11586, 2007 Radiometer measurements of HNO3 M. Toohey et al. Title Page Abstract Introduction Conclusions References Tables Figures ◭ ◮ ◭ ◮ Back CloseFull Screen / Esc
Printer-friendly Version Interactive Discussion component of work by Rinsland et al. (2003), rather than any underlying long-term
trend.
Acknowledgements. All four MANTRA campaigns were supported by the Canadian Space
Agency (CSA) and the Meteorological Service of Canada. MANTRA 1998 also received sup-port from the Centre for Research in Earth and Space Technology, while MANTRA 2002 and
5
2004 were also supported by Natural Sciences and Engineering Research Council (NSERC) of Canada. The Atmospheric Chemistry Experiment (ACE), also known as SCISAT-1, is a Canadian-led mission mainly supported by the CSA and NSERC. This work was also carried out with the aid of a grant from the CSA. M. Toohey gratefully acknowledges the scholarship support of NSERC and the CSA.
10
References
Beagley, S. R., de Grandpr ´e, J., Koshyk, J. N., McFarlane, N. A., and Shepherd, T. G.: Radiative-dynamical climatology of the first-generation Canadian Middle Atmosphere Model, Atmos. Ocean, 35, 293–331, 1997.11565
Bernath, P. F., McElroy, C. T., Abrams, M. C., Boone, C. D., Butler, M., Camy-Peyret, C., Carleer,
15
M., Clerbaux, C., Coheur, P.-F., Colin, R., DeCola, P., DeMazi `ere, M., Drummond, J. R., Dufour, D., Evans, W. F.J., Fast, H., Fussen, D., Gilbert, K., Jennings, D. E., Llewellyn, E. J., Lowe, R. P., Mahieu, E., McConnell, J. C., McHugh, M., McLeod, S. D., Michaud, R., Midwinter, C., Nassar, R., Nichitiu, F., Nowlan, C., Rinsland, C. P., Rochon, Y. J., Rowlands, N., Semeniuk, K., Simon, P., Skelton, R., Sloan, J. J., Soucy, M.-A., Strong, K., Tremblay,
20
P., Turnbull, D., Walker, K. A., Walkty, I., Wardle, D. A., Wehrle, V., Zander, R., and Zou, J.: Atmospheric Chemistry Experiment (ACE): Mission overview, Geophys. Res. Lett., 32, L15S01, doi:10.1029/2005GL022386, 2005.11572
Boone, C. D., Nassar, R., Walker, K. A., Rochon, Y., McLeod, S. D., Rinsland, C. P., and Bernath, P. F.: Retrievals for the atmospheric chemistry experiment Fourier-transform
spec-25
trometer, Appl. Optics, 44, 7218–7231, 2005. 11572
de Grandpr ´e, J., Sandilands, J. W., McConnell, J. C., Beagley, S. R., Croteau, P. C., and Danilin, M. Y.: Canadian Middle Atmosphere Model: Preliminary results from the chemical transport module, Atmos. Ocean, 35, 385–431, 1997. 11565
ACPD
7, 11561–11586, 2007 Radiometer measurements of HNO3 M. Toohey et al. Title Page Abstract Introduction Conclusions References Tables Figures ◭ ◮ ◭ ◮ Back CloseFull Screen / Esc
Printer-friendly Version Interactive Discussion
EGU
Evans, W. F. J., Lin, C. I., and Midwinter, C. L.: The Altitude Distribution of Nitric Acid at Churchill, Atmosphere, 14, 172–179, 1976. 11563,11567
Evans, W. F. J., Kerr, J. B., McElroy, C. T., Obrien, R. S., Wardle, D. I., and Ridley, B. A.: The odd nitrogen mixing ratio in the stratosphere, Geophys. Res. Lett., 4, 235–238, 1977. 11563
Evans, W. F. J., Kerr, J. V., McElroy, C. T., O’Brien, R. S., and McConnell, J. C.: Measurements
5
of NO2 and HNO3 during a stratospheric warming at 54 in February 1979, Geophys. Res. Lett., 9, 493–496, 1982. 11563
Eyring, V., Waugh, D. W., Bodeker, G. E., Cordero, E., Akiyoshi, H., Austin, J., Beagley, S. R., Boville, B., Braesicke, P., Br ¨uhl, C., Butchart, N., Chipperfield, M. P., Dameris, M., Deckert, R., Deushi, M., Frith, S. M., Garcia, R. R., Gettelman, A., Giorgetta, M., Kinnison, D. E.,
10
Mancini, E., Manzini, E., Marsh, D. R., Matthes, S., Nagashima, T., Newman, P. A., Nielsen, J. E., Pawson, S., Pitari, G., Plummer, D. A., Rozanov, E., Schraner, M., Scinocca, J. F., Semeniuk, K., Shepherd, T. G., Shibata, K., Steil, B., Stolarski, R., Tian, W., and Yoshiki, M.: Multi-model projections of stratospheric ozone in the 21st century, J. Geophys. Res., in press, 2007. 11565
15
Eyring, V., Butchart, N., Waugh, D. W., Akiyoshi, H., Austin, J., Bekki, S., Bodeker, G. E., Boville, B. A., Br ¨uhl, C., Chipperfield, M. P., et al.: Assessment of temperature, trace species, and ozone in chemistry-climate model simulations of the recent past, J. Geophys. Res., 111, D22308, doi:10.1029/2006JD007327, 2006. 11565
Flaud, J.-M., Brizzi, G., Carlotti, M., Perrin, A., and Ridolfi, M.: MIPAS database: Validation of
20
HNO3line parameters using MIPAS satellite measurements, Atmos. Chem. Phys., 6, 5037– 5048, 2006,
http://www.atmos-chem-phys.net/6/5037/2006/. 11563,11567,11573
Houghton, J. T.: The Physics of Atmospheres, Cambridge University Press, 45pp., 1986.11567
Irion, F. W., Gunson, M. R., Toon, G. C., Chang, A. Y., Eldering, A., Mahieu, E., Manney, G.
25
L., Michelsen, H. A., Moyer, E. J., Newchurch, M. J., et al.: Atmospheric Trace Molecule Spectroscopy (ATMOS) Experiment Version 3 data retrievals, Appl. Optics, 41, 6968–6979, 2002. 11563
Jones, D. R., Perttunen, C. D., and Stuckman, B. E.: Lipschitzian optimization without the Lipschitz constant, J. Optimiz. Theory App., 79, 157–181, 1993.11570
30
McLinden, C. A., Olsen, S. C., Prather, M. J., and Liley, J. B.: Understanding trends in strato-spheric NOyand NO2, J. Geophys. Res., 106, 27 787–27 793, 2001. 11564
ACPD
7, 11561–11586, 2007 Radiometer measurements of HNO3 M. Toohey et al. Title Page Abstract Introduction Conclusions References Tables Figures ◭ ◮ ◭ ◮ Back CloseFull Screen / Esc
Printer-friendly Version Interactive Discussion
lower stratosphere, Nature, 218, 78–79, 1968. 11562
Murcray, D. G., Goldman, A., Csoeke-Poeckh, A., Murcray, F. H., Williams, W. J., and Stocker, R. N.: Nitric acid distribution in the stratosphere, J. Geophys. Res., 78, 7033–7038, 1973.
11563
Murcray, D. G., Barker, D. B., Brooks, J. N., Goldman, A., and Williams, W. J.: Seasonal and
5
latitudinal variation of the stratospheric concentration of HNO3, Geophys. Res. Lett., 2, 223– 225, 1975.11563
Pick, D. R. and Houghton, J. T.: Measurements of atmospheric infrared emission with a balloon-borne multifilter radiometer, Q. J. Roy. Meteor. Soc., 95, 535, 1969. 11565
Prather, M. J., McElroy, M. B., and Wofsy, S. C.: Reductions in ozone at high concentrations of
10
stratospheric halogens, Nature, 312, 227–231, 1984.11564
Quine, B. M. and Drummond, J. R.: GENSPECT: A new generation line-by-line code with a bounded interpolation accuracy, J. Quant. Spectrosc. Ra., 74, 147–165, 2002. 11567
Quine, B. M., Toohey, M., Drummond, J. R., Strong, K., Wunch, D., Midwinter, C., and McElroy, C. T.: The Concentration Profile of Nitric Acid and Other Species over Saskatchewan in
Au-15
gust 1998: Retrieval from Data Recorded by Thermal-Emission Radiometry, Atmos. Ocean, 43, 361–376, 2005.11563,11566,11567,11570
Randel, W. J., Wu, F., Russel III, J. M., and Waters, J. W.: Space-time patterns of trends in stratospheric constituents derived from UARS measurements, J. Geophys. Res., 104(D3), 3711pp., 1999. 11564,11575
20
Rinsland, C. P., Zander, R., and Demoulin, P.: Ground-based infrared measurements of HNO3 total column abundances: long-term trend and variability, J. Geophys. Res., 96, 9379–9389, 1991. 11564
Rinsland, C. P., Weisenstein, D. K., Ko, M. K. W., Scott, C. J., Chiou, L. S., Mahieu, E., Zander, R., and Demoulin, P.: Post-Mount Pinatubo eruption ground-based infrared stratospheric
25
column measurements of HNO3, NO and NO2and their comparison with model calculations, J. Geophys. Res., 108(D15), 4437, doi:10.1029/2002JD002965, 2003. 11565,11576
Rinsland, C. P., Boone, C., Nassar, R., Walker, K., Bernath, P., Mahieu, E., Zander, R., Mc-Connell, J. C., and Chiou, L.: Trends of HF, HCl, CCl2F2, CCl3F, CHClF2(HCFC-22), and SF6 in the lower stratosphere from Atmospheric Chemistry Experiment (ACE) and Atmospheric
30
Trace Molecule Spectroscopy (ATMOS) measurements near 30◦N latitude, Geophys. Res.
Lett., 32, L16S03, doi:10.1029/2005GL022415, 2005.‘ 11572,11574
ACPD
7, 11561–11586, 2007 Radiometer measurements of HNO3 M. Toohey et al. Title Page Abstract Introduction Conclusions References Tables Figures ◭ ◮ ◭ ◮ Back CloseFull Screen / Esc
Printer-friendly Version Interactive Discussion
EGU
M. R., Chackerian, C., Chance, K., Coudert, L. H., et al.: The HITRAN 2004 molecular spectroscopic database, J. Quant. Spectrosc. Ra., 96, 139–204, 2005.11567
Santee, M. L., Manney, G. L., Livesey, N. J., and Read, W. G.: Three-dimensional structure and evolution of stratospheric HNO3 based on UARS Microwave Limb Sounder measurements, J. Geophys. Res., 109, D15306, doi:10.1029/2004JD004578, 2004.11563
5
Wang, D. Y., H ¨opfner, M., Blom, C. E., Ward, W. E., Fischer, H., Blumenstock, T., Hase, F., Keim, C., Liu, G. Y., Mikuteit, S., et al.: Validation of MIPAS HNO3operational data, Atmos. Chem. Phys. Discuss., 7, 5173–5251, 2007a. 11573
Wang, D. Y., H ¨opfner, M., Tsidu, G. M., Stiller, G. P., von Clarmann, T., Fischer, H., Blumen-stock, T., Glatthor, N., Grabowski, U., Hase, F., et al.: Validation of nitric acid retrieved by the
10
IMK-IAA processor from MIPAS/ENVISAT measurements, Atmos. Chem. Phys., 7, 721–738, 2007b.11573
Weatherhead, E. C., Reinsel, G. C., Cheang, W. K., Tiao, G. C., Meng, X. L., Choi, D., Keller, T., DeLuisi, J., Wuebbles, D. J., and Kerr, J. B.: Factors affecting the detection of trends-Statistical considerations and applications to environmental data, J. Geophys. Res., 103,
15
17–149, 1998.11565
Wunch, D., Tingley, M. P., Shepherd, T. G., Drummond, J. R., Moore, G. W. K., and Strong, K.: Climatology and predictability of the late summer stratospheric zonal wind turnaround over Vanscoy, Saskatchewan, Atmos. Ocean, 43, 301–313, 2005. 11563
ACPD
7, 11561–11586, 2007 Radiometer measurements of HNO3 M. Toohey et al. Title Page Abstract Introduction Conclusions References Tables Figures ◭ ◮ ◭ ◮ Back CloseFull Screen / Esc
Printer-friendly Version Interactive Discussion Table 1. Balloon flights of the radiometer dataset.
Flight Date Instruments AES Aug 20, 1990 MX13 AES Aug 30, 1990 MX19 MANTRA Aug 24, 1998 MX31, MX36 MANTRA Aug 29, 2000 MX31, MX36 MANTRA Sep 03, 2002 MX31
ACPD
7, 11561–11586, 2007 Radiometer measurements of HNO3 M. Toohey et al. Title Page Abstract Introduction Conclusions References Tables Figures ◭ ◮ ◭ ◮ Back CloseFull Screen / Esc
Printer-friendly Version Interactive Discussion EGU 1995 1996 1997 1998 1999 2000 2001 2002 2003 2004 2 4 6 8 10 12 14 CMAM year peak HNO 3 (ppb)
Fig. 1. Time series of monthly mean HNO3 volume mixing ratio (VMR) at ∼24 km from the
Canadian Middle Atmosphere Model (CMAM). Monthly variability (2σ) is represented by shad-ing, and August variability values are highlighted by vertical lines.
ACPD
7, 11561–11586, 2007 Radiometer measurements of HNO3 M. Toohey et al. Title Page Abstract Introduction Conclusions References Tables Figures ◭ ◮ ◭ ◮ Back CloseFull Screen / Esc
Printer-friendly Version Interactive Discussion 820 840 860 880 900 920 940 0 1 2 3 4 5 6 7 radiance 820 840 860 880 900 920 940 −0.5 0 0.5 wavenumber (cm−1) residual
Fig. 2. An example selection of spectral fits and residuals, approximately equally spaced
between 12 and 30 km height, from the emission radiometer fitting routine. Results shown are for MANTRA 2000, MX-36. Plotted points represent the measurement scans, while lines show the simulated spectra.
ACPD
7, 11561–11586, 2007 Radiometer measurements of HNO3 M. Toohey et al. Title Page Abstract Introduction Conclusions References Tables Figures ◭ ◮ ◭ ◮ Back CloseFull Screen / Esc
Printer-friendly Version Interactive Discussion EGU 0 2 4 6 8 47 48 49 50 51 52 53 54 55 56 57 day of September latitude ( ° N) 2004 2005 2006
Fig. 3. Time-latitude coordinates of Northern Hemisphere mid-latitude ACE occultations in late
ACPD
7, 11561–11586, 2007 Radiometer measurements of HNO3 M. Toohey et al. Title Page Abstract Introduction Conclusions References Tables Figures ◭ ◮ ◭ ◮ Back CloseFull Screen / Esc
Printer-friendly Version Interactive Discussion 0 5 10 10 15 20 25 30 35 altitude (km) HNO 3 (ppb)
1990
0 5 10 HNO 3 (ppb)1998
0 5 10 HNO 3 (ppb)2000
0 5 10 HNO 3 (ppb)2002
MX13 MX19 MX31 MX36 MX31 MX36 MX31Fig. 4. Retrieved HNO3profiles for the years shown. Instrument code names, specifying the
source of the radiance data used in each retrieval, are given in the legend (see Table 1). Error bars show the estimated uncertainty in the retrievals. The mean profile over MANTRA missions
ACPD
7, 11561–11586, 2007 Radiometer measurements of HNO3 M. Toohey et al. Title Page Abstract Introduction Conclusions References Tables Figures ◭ ◮ ◭ ◮ Back CloseFull Screen / Esc
Printer-friendly Version Interactive Discussion EGU 0 5 10 10 15 20 25 30 35 HNO3 (ppb) altitude (km) 0 0.2 0.4 CFC−11 (ppb) 0 0.5 1 CFC−12 (ppb) MANTRA ACE
Fig. 5. Mean profiles of HNO3, CFC-11 and CFC-12 VMR from the MANTRA flights (1998–
2002) and from observations by the ACE satellite instrument (2004–2006). Shading represents the 2σ variability of the ACE profile, while the error bars on the MANTRA radiometer profiles represent 1σ variability in the retrieved profiles.
ACPD
7, 11561–11586, 2007 Radiometer measurements of HNO3 M. Toohey et al. Title Page Abstract Introduction Conclusions References Tables Figures ◭ ◮ ◭ ◮ Back CloseFull Screen / Esc
Printer-friendly Version Interactive Discussion 0 20 40 60 80 100 120 10 15 20 25 30 35 σ HNO 3 (%) altitude (km) CMAM MANTRA ACE−FTS
Fig. 6. Percent standard deviations of HNO3VMR profiles from ACE measurements, MANTRA
measurements, and simulated fields from CMAM. Grey shading represents the 99% confidence interval of values given by CMAM when only three independent samples are used (dark grey), and with an added 10% error on each sample (light grey).