Variation of dissolved and particulate metal(loid) (As, Cd, Pb, Sb,
1
Tl, Zn) concentrations under varying discharge during a
2
Mediterranean flood in a former mining watershed, the Gardon
3
River (France)
4
Eléonore Resonglesa*, Corinne Casiota, Rémi Freydiera, Marion Le Galla and Françoise Elbaz-5
Poulicheta 6
aHydroSciences UMR 5569, CNRS, Universités Montpellier I & II, IRD, Place Eugène
7
Bataillon, CC MSE, 34095 Montpellier Cedex 5, France 8
*Corresponding author: 9
Tel.: +33467143605 10
E-mail address: [email protected] 11
ABSTRACT
12
The variation of dissolved and particulate metal(loid) concentrations was investigated 13
during a Mediterranean flood in a former mining watershed, the Gardon River (SE France), 14
using high-temporal resolution sampling. 15
Dissolved antimony originating from the upper Gardon River watershed underwent 16
dilution during flood. Conversely, dissolved As and particulate As, Pb, Zn, Cd and Tl 17
concentrations exhibited increased values during rising flood compared to low and receding 18
flow conditions, with a double-peak shape. As, Pb, Cd and Tl concentration data in suspended 19
particulate matter from this double-peak were distributed along two different correlation lines, 20
showing the successive mobilization of two groups of particles highly enriched with As and 21
Cd or Pb and Tl, both inherited from ancient Pb/Zn mines. 22
Metal(loid) loads during the monitored 24 h-flood event were: 0.5 kg for Cd, 19.4 kg for 23
Sb and 204 kg for As in the dissolved phase and 24 kg for Cd, 38 kg for Tl, 94 kg for Sb, 24
1915 kg for As, 2860 kg for Pb and 5214 kg for Zn in the particulate phase. 25
Altogether, these results highlighted the importance of floods in the mobilization of 26
metals and metalloids from ancient mining sites in Mediterranean regions, showing the need 27
for high-temporal resolution monitoring of flood event to accurately assess the long-term 28
contribution of mining activity to metal(loid) loads of downstream watershed. 29
30 31
KEYWORDS
1
Flood event; high temporal resolution sampling; metal and metalloid load; contaminated 2
particles remobilization; mining pollution; Mediterranean watershed 3
1.
Introduction
1
River systems that drain former mining regions are generally contaminated with metals 2
and metalloids even long after the mining activity has ceased (Macklin et al. 1997; Young 3
1997; MacKenzie and Pulford 2002; Coulthard and Macklin 2003). This trend is due to the 4
persistence of contamination sources which include untreated mining waters, mining wastes, 5
tailings and smelting slags that remained on sites as well as contaminated sediments stored 6
downstream in riverbeds, floodplains or reservoir lakes (Moore and Luoma 1990; Hudson-7
Edwards 2003). These mining-related pollutions affect the immediate vicinity of mines but 8
also hydrosystem further downstream (Moore and Luoma 1990; Axtmann and Luoma 1991; 9
Miller et al. 2004, 2007). 10
In Europe, metal(loid) inputs from former mining sites often represent an obstacle to 11
achieve the good chemical and ecological status of surface waters aimed by the Water 12
Framework Directive (2000/60/EC) (Younger and Wolkersdorfer 2004; Mayes et al. 2009; 13
Mighanetara et al. 2009; Foulds et al. 2014). Assessment of water quality downstream from 14
these former mining sites is generally based on discrete measurements of metal(loid) 15
concentrations during baseflow, on a monthly or weekly basis at best. However, little studies 16
have focused on metal(loid) dynamic during flood events in former mining regions although 17
floods are particularly effective agents of metal(loid) transport in rivers (Bradley 1984; Miller 18
et al. 1999; Dennis et al. 2003; Coynel et al. 2007; Žák et al. 2009; Gozzard et al. 2011; 19
Foulds et al. 2014). This is especially relevant in Mediterranean rivers affected by short and 20
intense floods during which the great part of suspended particulate matter (SPM) and 21
contaminant flux occur (Meybeck 2001; Pont et al. 2002; Cánovas et al. 2008, 2012; David et 22
al. 2012). 23
Significant variations of metal(loid) concentrations have been recorded in mining-24
impacted rivers within a single flood event both in dissolved and particulate phases. Metal-25
contaminated particles enter the river through erosion of mine waste tips and contaminated 26
soils caused by heavy rainfalls (Gao and Bradshaw 1995; Dennis et al. 2003; Hudson-27
Edwards 2003; Macklin et al. 2006; Gozzard et al. 2011; Byrne et al. 2012) and reworking of 28
historically contaminated sediments containing both primary (e.g. sulfides) and secondary 29
(e.g. Fe and/or Al (oxy)hydroxides) metal-bearing phases (Macklin and Klimek 1992; 30
Macklin et al. 1997, 2006; Coulthard and Macklin 2003; Dennis et al. 2003; Hudson-Edwards 31
2003; Coynel et al. 2007; Žák et al. 2009; Gozzard et al. 2011; Cánovas et al. 2012; Foulds et 32
al. 2014). Therefore, increasing particulate metal(loid) concentrations in SPM have been 1
reported in relation with increasing discharge in mining-impacted river (Lehmann et al. 1999; 2
Coynel et al. 2007) while the usual trend for particulate metal(loid) concentrations during 3
floods is a decrease due to dilution by less contaminated sediment, change in grain size and 4
exhaustion of available contaminated particles (Bradley and Lewin 1982; Bradley 1984; 5
Dawson and Macklin 1998; Schäfer and Blanc 2002). 6
Furthermore, an increase of dissolved metal(loid) concentrations downstream from old 7
mines has been reported during rising floods and was assigned to flushing of metal-rich 8
soluble secondary sulfates accumulated at mining sites during summer (Grimshaw et al. 1976; 9
Hudson-Edwards et al. 1999; Keith et al. 2001; Cánovas et al. 2008, 2010; Byrne et al. 2013), 10
contribution of contaminated subsurface water or groundwater (Cánovas et al. 2008; Byrne et 11
al. 2013) and metal(loid) release from mineral phases (Byrne et al. 2013). 12
Overall, these studies have highlighted the need to monitor floods with high temporal 13
resolution sampling in order to better understand metal(loid) behavior and fate downstream 14
from mining site under flood conditions. However, flood monitoring studies are scarce and 15
often focused on small watershed at the outlet of a single mining site, only little research was 16
carried out on medium watersheds affected by several contamination sources (Coynel et al. 17
2007; Cánovas et al. 2008, 2012). 18
The aim of this study was to investigate temporal variability of dissolved and particulate 19
metal(loid) concentrations during a Mediterranean flood in a former mining watershed of 20
medium size, the Gardon River watershed (France). For this purpose, spatial surveys of 21
metal(loid) concentrations were carried out during low and high flow. Moreover, high 22
temporal resolution sampling was performed during two consecutive floods at two stations of 23
the Gardon River watershed and SPM, dissolved and particulate metal(loid) concentrations 24
were determined. 25
2.
Study area
1
2.1. Geological characteristics and mining legacy of the Upper Gardon River 2
The Gardon River is the most southern tributary of the Rhône River (SE France, 3
Figure 1). The Upper Gardon River is divided into two main sub-basins; the Gardon of 4
Anduze watershed (~627 km²) and the Gardon of Ales watershed (~448 km²); from its 5
headwaters in the Cevennes Mountains to the junction of the two subwatersheds at Ners, the 6
Gardon River has a drainage area of 1100 km² (Figure 1). 7
The Upper Gardon River drains granitic and metamorphic bedrocks belonging to the 8
Paleozoic geological formations of the French Massif Central. The middle and lower parts are 9
underlain by Jurassic (west) to Cretaceous (east) carbonated formations (BRGM, Infoterre 10
website; Resongles et al. 2014). 11
Land occupation on the Upper Gardon River consists mainly in forest, being 76% for 12
the Gardon of Ales subwatershed and 89 % for the Gardon of Anduze subwatershed (Corine 13
Land Cover, 2006). There is also one mid-size town, Ales (~40,000 inhabitants) and a 14
chemical industrial center at Salindres (Figure 1). The Upper Gardon River drains many 15
former mining sites exploited mainly for Pb, Zn, Sb, pyrite and coal. Modern exploitation 16
occurred from the mid-19th century to the end of the 1960s and let large amounts of mining 17
wastes on sites (Table 1). This ancient exploitation has durably enriched the Gardon River 18
sediments with As, Cd, Hg, Pb, Sb, Tl and Zn (Resongles et al. 2014). This enrichment 19
reaches a factor 24 for main stream sediments compared to the local geochemical background 20
and a factor 1849 for mine-impacted tributaries (Aiguesmortes, Amous, Avène, Ourne, 21
Grabieux, Ravin des Bernes, Richaldon) (Resongles et al. 2014). 22
2.2. Hydrological characteristics of the Upper Gardon River 23
The Gardon River is characterized by a Mediterranean hydrological regime i.e. high 24
seasonal variations (Figure 2a). Its mean annual discharge maximum during the studied period 25
(2011-2013) was 26.6 m3/s at Ners, 15.4 m3/s at Anduze and 6.9 m3/s at Ales (Banque Hydro 26
website). Summer flows are very low with mean monthly discharge generally below 3 m3/s at 27
Ners during July and August. In spring and autumn, the Gardon River watershed is affected 28
by flash flood events, with instantaneous discharges which can reach more than 100 fold the 29
mean annual discharge (Delrieu et al. 2005; Dezileau et al. 2014). These floods are caused by 30
heavy rainfalls: precipitations greater than 200 mm can be recorded in a single day while the 1
average annual precipitation ranges between 500 and 1100 mm (Dezileau et al., 2014). 2
During the studied period, three main flood events occurred in March 2011, November 3
2011 and March 2013 (Figure 2a). The instantaneous peak discharge and average daily 4
discharge at Ners reached 716 m3/s and 403 m3/s, respectively, in March 2011, 1110 m3/s and 5
670 m3/s in November 2011, 820 m3/s and 431 m3/s in March 2013 (Banque Hydro website). 6
3.
Materials and methods
7
3.1. Sampling 8
3.1.a. Spatial sampling
9
Three spatial sampling campaigns were carried out throughout the Upper Gardon River 10
watershed in 2011 and 2012; sample locations are indicated on Figure 1. One campaign in 11
December 2012 was representative of winter low flow conditions (no significant rainfall in 12
the previous 3 weeks). Campaigns in March 2011 and November 2011 were carried out 13
during high flow periods, one and four days after the flood peak of two major floods, 14
respectively (Figure 2). 15
For the three campaigns, water samples for the analysis of dissolved metal(loid) 16
concentrations were filtered in the field as described in section 3.2.a. In November 2011, SPM 17
and particulate metal(loid) concentrations were also determined. For this, 2 L of raw water 18
were sampled in acid-cleaned HDPE bottles and filtered immediately back to the laboratory as 19
described in section 3.2.b. 20
3.1.b. Flood monitoring
21
Two consecutive flood events (Event 1 on 6-7 March 2013 and Event 2 on 17-18 March 22
2013, Figure 2b) were monitored with high resolution sampling during 24 h each at two 23
sampling sites (1) at the station “Lezan” situated ~7 km upstream from the outlet of the 24
Gardon of Anduze subwatershed and (2) at the station “Ners” (station 10) downstream from 25
the confluence between the Gardon of Anduze and the Gardon of Ales Rivers (Figure 1). 26
Hourly discharge reached 171 m3/s at Anduze station (~6 km upstream from the Lezan site) 27
and 206 m3/s at Ners station during Event 1; it reached 527 m3/s and 811 m3/s, respectively, 28
during Event 2. This second flood event was characterized by a temporary steady flow pattern 1
during the rising limb of the hydrograph (Figure 2b). 2
Flood samples were collected using two automatic samplers manually triggered (Sigma 3
SD900 at the Lezan site and Isco 6712 at the Ners site). Water was pumped using a peristaltic 4
pump and a ~10 m PTFE sampling tube. Its outlet was equipped with a polypropylene strainer 5
and fixed on a bridge pier (Lezan station) or a water mill wall (Ners station) to prevent the 6
sampling tube washout during floods. In such a way, water was pumped at 1 m from the 7
riverbank and 0.5 m above the riverbed. Such a setting was shown to be adapted to automatic 8
sampling in river systems (Coynel et al., 2004). 9
Automatic samplers were scheduled to collect a sample of 1 L every hour during a 24 h-10
period. An automatic purge allowed rinsing the sampling tube before each sampling to avoid 11
sample cross-contamination. Water samples were stored in acid-cleaned 1 L polypropylene 12
bottles. Finally, samples were retrieved at the end of the program (within 6 h) and were 13
filtered back to the laboratory within less than 72 hours after collection. For technical reasons, 14
the record of the Event 1 started at the flood peak at Lezan and 4h before the flood peak at 15
Ners. 16
3.2. Sample treatment 17
3.2.a. Dissolved metal(loid) concentrations
18
Filtrations were performed using a syringe and a disposable 0.22 µm cellulose acetate 19
syringe filter rinsed with river water before sample filtration. Filtrates were collected in acid-20
cleaned HDPE bottles, acidified to 1‰ with HNO3 (14.5 M, suprapur) and stored at 4 °C until
21
analysis. The filtrate will be referred to dissolved fraction, although colloidal particles may 22
pass through 0.22 µm filters. 23
3.2.b. SPM concentrations
24
Determination of SPM concentrations was performed by filtration of a precise volume 25
(from 150 mL to 900 mL) of homogenized water through acid-cleaned, dried and pre-weighed 26
0.22 µm PTFE filters (Millipore) fitted on polycarbonate filter holders (Sartorius). Then, 27
filters were dried in a desiccator until constant weight. Three successive weighing were 28
performed after the drying step to estimate weight reproducibility. The collected SPM mass 29
ranged from 4.7 mg to 194 mg (43 mg of average). Weighing error (relative standard 30
deviation) was better than 5% even for low masses. Filters were stored in a freezer for 1
subsequent acid digestion and particulate metal(loid) concentration determination. 2
3.2.c. Particulate metal(loid) concentrations
3
Filters with SPM were digested in closed Teflon reactors on hot-plates at 100°C for 24 h 4
with 4 mL HNO3 (14.5 M, suprapur) and 3 mL HF (22.6 M, suprapur). After cooling, filters
5
were rinsed with double deionized water (Milli-Q) and removed. The remaining solutions 6
were evaporated to dryness at 65 °C. Finally, samples were brought to 30 mL using 3 mL 7
HNO3 (14.5 M, suprapur) and 27 mL of double deionized water (Milli-Q). For each set of
8
samples, method blanks and certified reference river sediments (NCS DC70317 from LGC 9
Standards) were digested in the same way. 10
3.3. Analysis 11
3.3.a. Determination of dissolved and particulate metal(loid) concentrations
12
Dissolved and particulate metal (Cd, Pb, Tl, Zn) and metalloid (As, Sb) concentrations 13
were measured using ICP-MS (X7 Series II and iCAP Q, equipped with a CCT – Collision 14
Cell Technology chamber – Thermo Scientific). Concentrations were determined with 15
external calibration using In and Bi as internal standards to correct potential sensitivity drifts. 16
The quality of analysis was checked by analyzing international certified reference waters 17
(CNRC SLRS-5, NIST SRM 1643e). Accuracy was better than 5% relative to the certified 18
values and analytical error (relative standard deviation) was better than 5% for concentrations 19
ten times higher than the detection limits. 20
For mineralized solid samples, accuracy was within 10% of the certified values for 21
reference standards (NCS DC70317 from LGC Standards, n=5). Finally, mineralization 22
blanks represented less than 5 % of particulate metal(loid) concentrations; except for Sb and 23
Zn in a set of samples for which these elements were excluded from the results. 24
3.3.b. Assessment of the potential alteration of samples during storage in automatic
25
sampler
26
To evaluate potential sample alteration during storage in the automatic sampler (e.g. 27
eventual sorption of metal(loid) onto SPM or bottle walls), we compared dissolved 28
concentrations in two samples from stations Lezan and Ners after immediate filtration in the 1
field and after 72 h storage at 6-10 °C followed by filtration in the laboratory (Table 2). 2
Recovery averaged 100% for As, Cd and Sb in the dissolved fraction after 72 h storage 3
whatever the hydrological conditions (high or low SPM concentration). Conversely, recovery 4
was lower than 100% for Pb and Zn and higher than 100% for Tl, showing adsorption (Pb, 5
Zn) or desorption (Tl) of these elements onto/from SPM during 72h storage, in an extent 6
which appeared to depend on SPM concentration (Table 2). Therefore, temporal variations of 7
dissolved concentrations during the flood will be presented only for As, Cd and Sb. 8
However, particulate concentrations will be presented for all studied metals and 9
metalloids (As, Cd, Pb, Sb, Tl and Zn) because the contribution of adsorption (Pb, Zn) or 10
desorption (Tl) evidenced during storage (Table 2) and that modified significantly dissolved 11
concentration values for Pb, Zn and Tl appeared to affect very slightly particulate 12
concentrations. Indeed, concerning Tl in samples from the monitored flood, if we consider 13
that all Tl present in the dissolved phase originates from desorption during storage (which is 14
the worst case), particulate Tl concentrations during the flood would be underestimated by no 15
more than 26% (Supporting Information, Figure 1). Concerning Pb and Zn, previous 16
unpublished dissolved concentration data obtained after filtration in the field in various 17
hydrological conditions (high and low flow) at Lezan (n = 5) and Ners (n = 4) indicated low 18
values, less than 0.82 µg/L for Pb and less than 6.3 µg/L for Zn (Supporting Information, 19
Figure 2), showing that dissolved Pb and Zn concentrations were low whatever hydrological 20
conditions. Dissolved concentrations represented 18% (Zn) and 5% (Pb) of total (dissolved + 21
particulate) Zn and Pb concentrations in our November 2011 survey (section 4.1.b), in 22
agreement with the predominant association of these elements to the particulate phase in river 23
systems at near neutral pH (Gaillardet et al. 2003; Masson et al. 2006; Ollivier et al. 2011). 24
Thus, Pb and Zn present in the dissolved phase in our flood samples would reasonably not 25
contribute to increase significantly the particulate concentration values during storage. 26
3.3.c. Metal(loid) load assessment
27
Dissolved loads of As and Sb during the second monitored 24 h-flood at Ners were 28
calculated using hourly discharge (Qh) (Banque Hydro website) and hourly dissolved
29
concentrations (Cd) (Equation 1). Particulate loads of metal(loid)s were estimated using
30
hourly discharge, hourly SPM concentration (CSPM) and hourly particulate metal(loid)
31
concentrations (Cp) (Equation 2).
Dissolved load: 𝐿𝐷 = ∑(𝑄ℎ× 𝐶𝑑) Eq. 1 1
Particulate load: 𝐿𝑃 = ∑(𝑄ℎ× 𝐶𝑆𝑃𝑀× 𝐶𝑝) Eq. 2
2
4.
Results
3
4.1. Spatial distribution of dissolved and particulate metal(loid) concentrations 4
at high and low flow 5
4.1.a. Dissolved metal and metalloid concentrations
6
Dissolved concentrations of the studied elements along the Gardon River watershed 7
exceeded world river averages up to 3- (Pb), 13- (As), 19- (Zn), 52- (Tl) and 161-fold (Sb), 8
with the exception of Cd (Figure 3) (Gaillardet et al. 2003). The highest concentrations were 9
obtained at low flow for Cd, Sb, Tl and Zn (stations 4 and 5 for Cd, Tl and Zn; stations 2 to 5 10
for Sb, Figure 3) and at high flow for Pb (stations 2 to 4 and 8 to 10) while As concentration 11
did not vary significantly between high flow and low flow during these spatial surveys, 12
showing different dynamics of the studied elements relatively to hydrological conditions. The 13
concentrations of Cd, Sb, Tl and Zn were higher along the Gardon of Ales subwatershed 14
(Figure 3b, 3d, 3e, 3f, zone 1) than along the Gardon of Anduze subwatershed (Figure 3b, 3d, 15
3e, 3f, zone 2), while the reverse was observed for As (Figure 3a); no clear trend was 16
evidenced for Pb in the dissolved phase (Figure 3c). For Sb, a general decrease of dissolved 17
concentrations was observed from upstream to downstream stations along the Gardon of Ales 18
subwatershed (Figure 3d, zone 1). This dilution pattern suggests that the predominant Sb 19
sources were localized at the uppermost course of the subwatershed, where ancient Sb mines 20
are present. Conversely, Cd, Tl and Zn concentrations increased from upstream (1, 2, 3) to 21
downstream (4, 5) stations along the Gardon of Ales subwatershed, showing significant inputs 22
downstream station 3, where several Pb/Zn mines and the urban area of Ales are localized 23
(Figure 1). 24
Finally, dissolved concentrations downstream from the junction between the two 25
subwatersheds (station 10) clearly reflected the predominant flow contribution of the Gardon 26
of Anduze River upon the Gardon of Ales River (average discharge ratio 2:1, Banque Hydro 27
data), with As concentration at station 10 similar to station 9 while significant dilution was 28
evidenced for Cd, Sb, Tl and Zn from station 5 to station 10. 29
4.1.b. Particulate metal and metalloid concentrations
1
Particulate As, Cd, Pb, Sb, Tl and Zn concentrations in SPM recovered at high flow 2
exceeded world river averages up to 2 (As, Pb, Zn), 4 (Tl) and 25 fold (Sb) with the exception 3
of Cd (Figure 4). 4
The particulate phase represented on average 36% (Sb), 43% (As), 57% (Cd), 82% (Tl, 5
Zn) and 95% (Pb) of total (dissolved + particulate) concentrations, showing significant 6
contribution of particulate over dissolved load to metal transport during high (receding) flow. 7
Spatial distribution showed extremely higher concentrations of Sb in SPM along the 8
Gardon of Ales subwatershed compared to the Gardon of Anduze subwatershed (Figure 4d), 9
as already observed for dissolved Sb, and subsequent dilution in particles at the junction 10
between the two subwatersheds (station 10), confirming the predominance of Sb source on the 11
upper course of the Gardon of Ales subwatershed. For other metal(loid), particulate 12
concentrations did not show clear trend from upstream to downstream stations in both 13
subwatersheds indicating that there were more than one predominant source for these 14
metal(loid)s. 15
4.2. Flood monitoring 16
4.2.a. Dissolved As, Cd and Sb concentrations
17
The pattern of dissolved As concentrations during the two consecutive flood events 18
(Figure 5a, 5d) differed from that of Sb (Figure 5b, 5e) and Cd (Figure 5c, 5f). Arsenic 19
concentration increased with the discharge during Event 2, with a few hours shift between the 20
two consecutive upstream (Lezan) and downstream (Ners) stations (Figures 5a, 5d). 21
Concentration reached 10.2 µg/L at Lezan (17/03/2013 at 06:00) and 7.3 µg/L at Ners 22
(17/03/2013 at 09:00), which exceeded the values obtained during the winter low flow 23
conditions. This first peak coincided with a stationary flow phase occurring during the rising 24
limb of the hydrograph (Event 2’, Figure 5a, 5d) in response to a temporary rainfall decrease 25
(data not shown). A second peak occurred (Event 2”, Figure 5a, d), with As concentration 26
reaching 5.7 µg/L, both at Lezan (17/03/2013 at 16:00) and Ners (17/03/2013 at 17:00). A 27
concentration peak was also visible during Event 1 at Ners (Figure 5d) but it was missed at 28
Lezan (Figure 5a), due to the time shift. Conversely, Sb concentration decreased with 29
increasing discharge during Event 2 at Ners (Figure 5e) and increased at receding flow during 30
Event 1, ranging between the high and low flow values recorded at this station (10) during the 1
spatial surveys. At Lezan, dissolved Sb concentration remained low and relatively stable 2
during the flood (Figure 5b), with a value of 0.17±0.01 µg/L which is lower than the 3
concentration measured during winter low flow. For Cd, dissolved concentrations also 4
decreased with increasing discharge during Event 2 at Lezan and during Event 1 at Ners. At 5
Lezan, the concentrations recorded during the flood were higher than the winter low flow 6
values, indicating that a concentration peak was probably missed at the early stage of the 7
floods while at the Ners station, Cd presented a dilution pattern compared to winter low flow 8
level (Figure 5c, 5f). 9
4.2.b. SPM and particulate metal and metalloid concentrations
10
SPM concentration increased with the discharge during Events 1 and 2; it reached 11
higher values during Event 2 (334 mg/L at Lezan and 647 mg/L at Ners) than during Event 1 12
(73 mg/L at Lezan and 141 mg/L at Ners), in relation with a higher discharge (Figure 6). 13
During Event 2, a first SPM peak coincided with the stationary flow phase occurring during 14
the rising limb of the hydrograph (Figure 6). 15
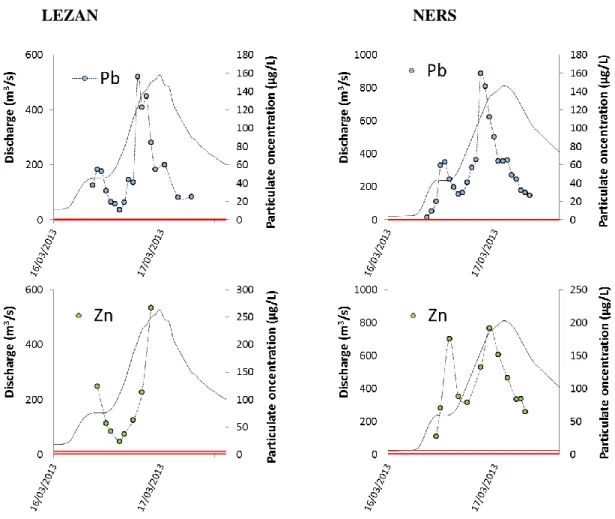
The pattern of particulate metal(loid) concentrations during the floods was similar to 16
that of dissolved As concentrations; two consecutive peaks were recorded during the rising 17
limb of Event 2 for As, Cd, Pb, Sb, Tl and Zn at Lezan (Figure 7a,7b) and for As, Pb and Zn 18
at Ners (Figure 7c), with lower concentration values at downstream station Ners located at the 19
junction between the two subwatersheds compared to upstream station Lezan, located at the 20
lowermost course of the Gardon of Anduze River. These concentrations during flood event 2 21
were higher than those recorded at high (receding) flow during the spatial survey, by a factor 22
1 to 3 for Sb, 2 to 6 for Zn and Tl, 2 to 11 for Pb, 3 to 14 for Cd, and 5 to 20 for As. This may 23
suggest the contribution of a common source highly enriched with these metal(loid)s in the 24
particulate phase during flood event 2 on the Gardon of Anduze subwatershed. 25
By plotting Pb versus As and Tl versus Cd concentration data from Event 2 at Lezan, a 26
distribution along two different correlation lines was observed, corresponding to Event 2’ and 27
2” (Figure 8a, 8b). SPM from Event 2’ were more enriched with As and Cd compared to SPM 28
from Event 2” which were more enriched with Pb and Tl. Correlation line from Event 2’ fitted 29
with Pb-As data from Amous River SPM and surface bed deposit (Figure 8c); this river is 30
concentrations were recorded in the drainage waters and associated secondary precipitates 1
(Leblanc et al. 1996; Casiot et al. 2003, 2009; Héry et al. 2014). Correlation line from Event 2
2” fitted both with Pb-As and Tl-Cd Amous River bulk sediment data and also with the Ourne 3
and Aiguesmortes Rivers sediment data (Figure 8c, 8d); these two latest rivers are located 4
downstream from the ancient mining district of Pallières which is close to Carnoulès mining 5
district. Correlation line from Event 2” also fitted with data from sulfide-rich tailings of the 6
Carnoulès mine and with data from a sediment layer in a flooding terrace recovered at 45 km 7
downstream from Lezan; this contaminated layer was attributed to the failure of a tailing dam 8
at the Carnoulès mine (Dezileau et al. 2014; Resongles et al. 2014). 9
5.
Discussion
10
The Gardon River is a typical Mediterranean mid-size river that has been durably 11
impacted by metal contamination from ancient mining activity (Resongles et al. 2014). Levels 12
of As, Pb, Sb, Tl and Zn in the dissolved and particulate phases recorded in the present study 13
showed enrichments relatively to average river values, in agreement with the contamination 14
status of sediments and the high geochemical background established in a previous study 15
(Resongles et al. 2014). For As, Cd, Pb, Tl and Zn, the dissolved and particulate concentration 16
values were within the range of other mid-size rivers impacted by ancient mines (Table 3). 17
For Sb, the present data showed higher values than those recorded for the Isle and Lot Rivers 18
impacted by ancient mines from the western border of the French Massif Central (Coynel et 19
al. 2007; Grosbois et al. 2009). 20
The spatial distribution of metal(loid) contamination in the dissolved and particulate 21
phases corroborated previous sediment characterization along the Gardon River watershed 22
(Resongles et al. 2014). In this previous study, Cd, Sb, and Zn appeared to be enriched in the 23
sediments along the Gardon of Ales subwatershed relatively to the Gardon of Anduze 24
subwatershed, with predominant sources localized at the uppermost course of the river (Sb) 25
and around Ales urban and Pb/Zn mining area (Cd, Zn). For other elements (As, Pb, Tl), the 26
concentrations in the sediments upstream from the junction between the two subwatersheds 27
was similar (Resongles et al. 2014), these elements being associated to ancient Pb/Zn mines 28
present on both subwatersheds. 29
In the present study, the level of contamination and the contribution of the different 30
sources were shown to vary with hydrological conditions. For Sb, a decrease of dissolved 31
concentrations was observed at high flow on the Gardon of Ales subwatershed compared to 1
low flow conditions and a dilution pattern was also evidenced after the junction between the 2
two subwatersheds during the flood events. This was attributed to a dilution effect generally 3
observed with increasing river discharge (Grimshaw et al. 1976; Cánovas et al. 2008, 2012; 4
Grosbois et al. 2009; Ollivier et al. 2011). For As, dissolved concentrations along the Gardon 5
of Anduze River were similar at low and high (receding) flow. Nevertheless, these relatively 6
stable dissolved As levels have been exceeded two-fold during flood event 2 at Lezan, 7
showing that unusual As levels may be reached during such peculiar hydrological events. 8
Indeed, surface leaching processes occurring during rising floods may upgrade the usual As 9
levels; these processes involve flushing of surface tailings and contaminated soils, desorption 10
from As-rich particles from riverbed in mine-impacted tributaries; such flushing events were 11
often observed during floods in mining areas (Grimshaw et al. 1976; Cánovas et al. 2008; 12
Byrne et al. 2013). As an example, Masson et al. (2007) observed maximum dissolved As 13
concentrations in the Garonne River during a major flood event due to heavy rainfalls in the 14
upper Lot River watershed which is known for important potential As point sources such as 15
mining wastes, tailings and contaminated reservoir sediments. The concentration of the other 16
studied elements (Cd, Pb, Zn, Tl) in the particulate phase was also significantly increased 17
during flood event 2 at Lezan and also at Ners, relatively to receding flow of November 2011, 18
making the Gardon of Anduze subwatershed the predominant contributor to downstream 19
particulate As, Pb, Zn, Cd and Tl load during this peculiar flood event. Increasing metal(loid) 20
concentration in SPM during floods can be due to several processes such as remobilization of 21
contaminated sediments from the riverbed or the riverbank and erosion of soil and waste 22
deposits at mining sites caused by surface runoff. Here, the two successive contamination 23
peaks and associated distinct Pb-As and Tl-Cd correlations evidenced during the rising flood 24
of Event 2 at Lezan clearly highlighted that two different predominant sources or transport 25
mechanisms were involved during this flood. The mobilization of particles highly enriched 26
with As and Cd and in a lesser extent with Pb (Event 2’) was followed by the mobilization of 27
particles highly enriched with Pb and Tl and in a lesser extent with As and Cd (Event 2”). The 28
corresponding activated sources or mechanisms are difficult to discriminate since floods are 29
complex events. Source contribution depends on the spatial and temporal repartition of 30
rainfalls and the distance between the source and the sampling station (Coynel et al. 2007). In 31
the present study, the main potential sources of As and Pb on the Gardon of Anduze 32
subwatershed are the mining districts of Carnoulès and Pallières (Figure 1, Table 1). During 33
140 mm of precipitations in 36 hours (data from Meteo-France). Moreover, the two mines are 1
nearly equidistant from the flood monitoring station of Lezan, thus both mining sites may 2
have contributed to increase metal(loid) levels in SPM during flood event 2. Thus, the two 3
correlation lines may rather reflect the composition of different kinds of particles, being more 4
or less easily flushed as the flow rate increased. SPM of Event 2’ exhibited Pb/As and Tl/Cd 5
ratios of 0.5 and 0.7 and the corresponding correlation line fitted with some of the Amous 6
River SPM highly enriched with arsenic (Pb/As and Tl/Cd ratios of 0.5 and 0.2 on average, 7
Figure 8c). This correlation also fitted with few data from fine Fe-rich superficial Amous 8
River bed deposits (Pb/As and Tl/Cd ratios of 0.3 and 0.04 on average); these deposits were 9
orange loosely packed and watery, they were deposited onto the top of Amous river bed (Héry 10
et al. 2014). Their consistency makes these deposits prone to flushing as soon as the flow rate 11
increases. SPM corresponding to Event 2” presented higher Pb/As and Tl/Cd ratios of 2.3 and 12
2.5 and the correlation line fitted with data from sulfide-rich tailings from the Carnoulès mine 13
(Pb/As and Tl/Cd ratios of 3.6 and 4.5 on average), also with sediment data from rivers 14
draining the ancient mining districts of Carnoulès and Pallières (Pb/As and Tl/Cd ratios of 6.4 15
and 1.5 on average, Figure 8c, 8d) (Resongles et al. 2014). Moreover, this correlation line also 16
fitted with data from a sedimentary archive layer located at a downstream station in the 17
Gardon River; this layer corresponded to sulfide-rich sands originating from the failure of a 18
tailings dam at Carnoulès in 1976 (Pb/As and Tl/Cd ratios of 2.8 on average). Therefore, the 19
geochemical signature of SPM transported during Event 2’ may be related to the 20
remobilization of easily flushed secondary precipitates temporarily stored in the streambed in 21
the vicinity of Carnoulès mine while SPM transported during Event 2” may reflect the 22
contribution of primary sulfides originating from tailings or from downstream diffuse sources 23
(remobilization of these primary sulfides stored temporally in riverbed or riverbank) which 24
may have a similar composition in As, Pb, Tl and Cd throughout the whole Carnoulès-25
Pallières mining area. Such sulfide-rich grey sands were observed after storm events at the 26
outlet of the drain that crossed the tailings pile at Carnoulès and in the streambed of the small 27
Reigous Creek that flows into the Amous River. 28
Altogether, these results highlight the importance of flood events in the mobilization of 29
metal(loid)s in the Gardon River. Exceptionally high particulate concentrations of As were 30
reached during flood event 2 in the present study, compared to other mining-impacted rivers; 31
the values reached 1233 mg/kg at Lezan and greatly exceeded European guidelines for 32
sediment quality (Macklin et al. 2006). Considering the dissolved and particulate loads 33
downstream from the junction between the two subwatersheds (Ners station), our calculations 1
indicated dissolved As, Cd and Sb loads reaching 204 kg, 0.5 kg and 19.4 kg, respectively and 2
particulate load reaching 1915 kg for As, 24 kg for Cd, 94 kg for Sb, 38 kg for Tl, 2860 kg for 3
Pb and 5214 kg for Zn within 24 h during Event 2. Although these particulate metal(loid) 4
loads are significant, they are relatively low compared to those exported from the Lot River 5
watershed that also drained ancient mines from the western border of the French Massif 6
Central, besides receiving inputs from an ancient Zn smelter. The particulate load of the Lot 7
River during a 5-days major flood was about 14 times (As), 18 times (Pb), 47 times (Sb), 164 8
times (Zn) and 349 times (Cd) higher than the particulate load of the Gardon River during the 9
flood Event 2, in relation with a 30 times higher SPM load (Coynel et al. 2007) and a higher 10
level of Cd and Zn (Table 3). 11
The geochemical signature of the Gardon River, characterized by relatively high 12
dissolved As and Sb concentrations, was evidenced during three important flood events 13
recorded on the Rhône River in 2002 and 2003 (Ollivier et al. 2006). During these floods, 14
dissolved As (1-5 µg/L) and Sb (0.2-0.7 µg/L) concentrations in the Rhône River at Arles, 15
downstream from the junction with the Gardon River, were close to those recorded in the 16
present study (3-7 µg/L for As and 0.3-0.9 µg/L for Sb) during the floods at Ners; this was 17
related to the unusual contribution of Cevenol tributaries to the whole Rhône flow during the 18
2002 and 2003 flood events. In particular, Cevenol tributaries accounted for 90% of the 19
Rhône flow at Arles during the September 2002 flood event (Ollivier et al. 2006, 2011). 20
6.
Conclusion
21
In this study, high-temporal flood monitoring allowed to evidence that significant 22
temporal variations of dissolved and particulate metal (Cd, Pb, Tl, Zn) and metalloid (As, Sb) 23
concentrations occurred during Mediterranean flood in the former mining watershed of the 24
Gardon River. Dissolved Sb concentration was affected by usual dilution processes often 25
observed with increasing discharge. Conversely, dissolved As and particulate As, Cd, Pb, Tl 26
and Zn concentrations exhibited two successive contamination peaks during the rising flood 27
with higher concentrations than those recorded during low or receding flow conditions 28
showing that mine-related sources were activated during the flood. 29
The correlation between particulate As, Pb, Tl and Cd concentrations showed two 30
different signatures associated with the two contamination peaks, suggesting that two 31
different kinds of contaminated particles were successively transported during the studied 1
flood in the Gardon River system. Based on the location of the potential contamination 2
sources and the geochemical signature of associated contaminated particles, we could infer 3
that the first group of particles might be ascribed to the flushing of secondary precipitates 4
which are commonly found in mining streams affected by acid mine drainage. The second 5
group might correspond to primary sulfides originating from tailings or from downstream 6
secondary sources. However, further work is necessary to distinguish between point sources 7
and diffuse downstream sources of such particles. 8
Finally, this study highlighted the importance of floods in the mobilization of metals 9
and metalloids from ancient mining sites in Mediterranean regions, showing the need for 10
monitoring flood events to understand metal and metalloid transport in such river systems and 11
accurately assess the long-term contribution of mining activity to metal(loid) loads of 12
downstream watershed. Further research is needed to estimate the contribution of this kind of 13
flood event to annual metal(loid) flux. 14
Acknowledgments
1
The authors would like to thank Pierre Marchand, Maurice Guilliot and Frédéric Hernandez 2
for field assistance and Sophie Delpoux for laboratory analysis. Valérie Borrell is thanked for 3
fruitful discussions. The municipality of Boucoiran is thanked for providing access to the mill 4
at Pont de Ners for automatic sampler installation. This study was supported by the EC2CO-5
INSU program and OSU OREME (http://www.oreme.univ-montp2.fr). 6
References
7
Alkaaby, A., 1986. Conglomérats minéralisés (Pb-Ba-Fe) du Trias basal sur la bordure sud-est des Cévennes : 8
exemple du système fluvial en tresse de Carnoulès (Gard). Thesis Université des Sciences et Techniques 9
du Languedoc, p.154. 10
Audry, S., 2003. Bilan géochimique du transport des éléments traces métalliques dans le système fluvial 11
anthropisé Lot-Garonne-Gironde. Thesis Université de Bordeaux I, p.413. 12
Axtmann, E., Luoma, S., 1991. Large-scale distribution of metal contamination in the fine-grained sediments of 13
the Clark Fork River, Montana, U.S.A. Applied Geochemistry 6, 75–88. 14
Banque Hydro, Eaufrance. Last accessed on 30/08/2014, http://www.hydro.eaufrance.fr/. 15
Bradley, S., Lewin, J., 1982. Transport of heavy metals on suspended sediments under high flow conditions in a 16
mineralised region of Wales. Environmental Pollution 4, 257–267. 17
Bradley, S.B., 1984. Flood effects on the transport of heavy metals. International Journal of Environmental 18
Studies 22, 225–230. 19
BRGM, ADES. Portail National d’Accès aux Données sur les Eaux Souterraines Last accessed on 30/08/2014, 20
http://www.ades.eaufrance.fr/. 21
BRGM, InfoTerre. Last accessed on 30/08/2014, http://infoterre.brgm.fr/. 22
BRGM, SIG Mines. Last accessed on 30/08/2014, http://sigminesfrancebrgmfr/. 23
Byrne, P., Wood, P.J., Reid, I., 2012. The Impairment of River Systems by Metal Mine Contamination: A 24
Review Including Remediation Options. Critical Reviews in Environmental Science and Technology 42, 25
2017–2077. 26
Byrne, P., Reid, I., Wood, P.J., 2013. Stormflow hydrochemistry of a river draining an abandoned metal mine: 27
the Afon Twymyn, central Wales. Environmental Monitoring and Assessment 185, 2817–32. 28
Cánovas, C.R., Hubbard, C.G., Olías, M., Nieto, J.M., Black, S., Coleman, M.L., 2008. Hydrochemical 29
variations and contaminant load in the Río Tinto (Spain) during flood events. Journal of Hydrology 350, 30
25–40. 31
Cánovas, C.R., Olías, M., Sarmiento, A.M., Nieto, J.M., Galván, L., 2012. Pollutant transport processes in the 32
Odiel River (SW Spain) during rain events. Water Resources Research 48, W06508. 33
Cánovas, C.R., Olías, M., Nieto, J.M., Galván, L., 2010. Wash-out processes of evaporitic sulfate salts in the 34
Tinto River: Hydrogeochemical evolution and environmental impact. Applied Geochemistry 25, 288–301. 35
Casiot, C., Leblanc, M., Bruneel, O., Personné, J.-C., Koffi, K., Elbaz-Poulichet, F., 2003. Geochemical 36
Processes Controlling the Formation of As-Rich Waters Within a Tailings Impoundment (Carnoulès, 37
France). Aquatic Geochemistry 9, 273–290. 38
Casiot, C., Egal, M., Elbaz-Poulichet, F., Bruneel, O., Bancon-Montigny, C., Cordier, M.-A., Gomez, E., 39
Aliaume, C., 2009. Hydrological and geochemical control of metals and arsenic in a Mediterranean river 40
contaminated by acid mine drainage (the Amous River, France); preliminary assessment of impacts on fish 41
Coulthard, T.J., Macklin, M.G., 2003. Modeling long-term contamination in river systems from historical metal 1
mining. Geology 31, 451-454. 2
Coynel, A., Schäfer, J., Hurtrez, J.-E., Dumas, J., Etcheber, H., Blanc, G., 2004. Sampling frequency and 3
accuracy of SPM flux estimates in two contrasted drainage basins. Science of the Total Environment 330, 4
233–247. 5
Coynel, A., Schäfer, J., Blanc, G., Bossy, C., 2007. Scenario of particulate trace metal and metalloid transport 6
during a major flood event inferred from transient geochemical signals. Applied Geochemistry 22, 821– 7
836. 8
David, A., Bancon-Montigny, C., Salles, C., Rodier, C., Tournoud, M.-G., 2012. Contamination of riverbed 9
sediments by hazardous substances in the Mediterranean context: Influence of hydrological conditions. 10
Journal of Hydrology 468-469, 76–84. 11
Dawson, E.J., Macklin, M.G., 1998. Speciation of heavy metals on suspended sediment under high flow 12
conditions in the River Aire, West Yorkshire , UK. Hydrogical Processes 12, 1483–1494. 13
Delrieu, G., Ducrocq, V., Gaume, E., Nicol, J., Payrastre, O., Yates, E., Kirstetter, P., Andrieu, H., Ayral, P., 14
Bouvier, C., Creutin, J., Livet, M., Anquetin, S., Lang, M., Neppel, L., Obled, C., Parent-Du-Chatelet, J., 15
Saulier, G., Walpersdorf, A., Wobrock, W., 2005. The catastrophic flash-flood event of 8-9 September 16
2002 in the Gard region, France: a first case study for the Cévennes-Vivarais Mediterranean 17
Hydrometeorological. Journal of Hydrometeorology 6, 34–52. 18
Dennis, I.A., Macklin, M.G., Coulthard, T.J., Brewer, P.A., 2003. The impact of the October-November 2000 19
floods on contaminant metal dispersal in the River Swale catchment, North Yorkshire, UK. Hydrological 20
Processes 17, 1641–1657. 21
Dezileau, L., Terrier, B., Berger, J.F., Blanchemanche, P., Latapie, A., Freydier, R., Bremond, L., Paquier, A., 22
Lang, M., Delgado, J.L., 2014. A multidating approach applied to historical slackwater flood deposits of 23
the Gardon River, SE France. Geomorphology 214, 56–68. 24
Foulds, S.A., Brewer, P.A., Macklin, M.G., Haresign, W., Betson, R.E., Rassner, S.M.E., 2014. Flood-related 25
contamination in catchments affected by historical metal mining: An unexpected and emerging hazard of 26
climate change. Science of the Total Environment 476-477, 165–180. 27
Gaillardet, J., Viers, J., Dupré, B., 2003. Trace elements in river waters. Treatise on Geochemistry 5, 225–272. 28
Gao, Y., Bradshaw, A.D., 1995. The containment of toxic wastes: II. Metal movement in leachate and drainage 29
at Parc lead-zinc mine, North Wales. Environmental Pollution 90, 379–382. 30
Gozzard, E., Mayes, W.M., Potter, H.A.B., Jarvis, A.P., 2011. Seasonal and spatial variation of diffuse (non-31
point) source zinc pollution in a historically metal mined river catchment, UK. Environmental Pollution 32
159, 3113–3122. 33
Gray, N.F., 1998. Acid mine drainage composition and the implications for its impact on lotic systems. Water 34
Research 32, 2122–2134. 35
Grimshaw, D., Lewin, J., Fuge, R., 1976. Seasonal and short-term variations in the concentration and supply of 36
dissolved zinc to polluted aquatic environments. Environmental Pollution 11, 1–7. 37
Grosbois, C., Schäfer, J., Bril, H., Blanc, G., Bossy, A., 2009. Deconvolution of trace element (As, Cr, Mo, Th, 38
U) sources and pathways to surface waters of a gold mining-influenced watershed. Science of the Total 39
Environment 407, 2063–2076. 40
Helios Rybicka, E., Adamiec, E., Aleksander-Kwaterczak, U., 2005. Distribution of trace metals in the Odra 41
River system: Water–suspended matter–sediments. Limnologica 35, 185–198. 42
Héry, M., Casiot, C., Resongles, E., Gallice, Z., Bruneel, O., Desoeuvre, A., Delpoux, S., 2014. Release of 43
arsenite, arsenate and methyl-arsenic species from streambed sediment impacted by acid mine drainage: a 44
microcosm study. Environmental Chemistry. http://dx.doi.org/10.1071/EN13225 45
Hudson-Edwards, K.A., 2003. Sources, mineralogy, chemistry and fate of heavy metal-bearing particles in 46
mining-affected river systems. Mineralogical Magazine 67, 205–217. 47
Hudson-Edwards, K.A., Schell, C., Macklin, M.G., 1999. Mineralogy and geochemistry of alluvium 1
contaminated by metal mining in the Rio Tinto area, southwest Spain. Applied Geochemistry 14, 1015– 2
1030. 3
Keith, D.C., Runnells, D.D., Esposito, K.J., Chermak, J.A., Levy, D.B., Hannula, S.R., Watts, M., Hall, L., 2001. 4
Geochemical models of the impact of acidic groundwater and evaporative sulfate salts on Boulder Creek at 5
Iron Mountain, California. Applied Geochemistry 16, 947–961. 6
Laslett, R., 1995. Concentrations of dissolved and suspended particulate Cd, Cu, Mn, Ni, Pb and Zn in surface 7
waters around the coasts of England and Wales and in adjacent seas. Estuarine, Coastal and Shelf Science 8
40, 67–85. 9
Leblanc, M., Achard, B., Othman, D. Ben, Luck, J., 1996. Accumulation of arsenic from acidic mine waters by 10
ferruginous bacterial accretions (stromatolites). Applied Geochemistry 11, 541–554. 11
Lehmann, J., Puff, T., Damke, H., Eidam, J., Henning, K.-H., Jülich, W.-D., Roßberg, H., 1999. The Odra river 12
load of heavy metals at Hohenwutzen during the flood in 1997. Acta Hydrochimica Hydrobiologica 27, 13
321–324. 14
MacKenzie, A., Pulford, I., 2002. Investigation of contaminant metal dispersal from a disused mine site at 15
Tyndrum, Scotland, using concentration gradients and stable Pb isotope ratios. Applied Geochemistry 17, 16
1093–1103. 17
Macklin, M.G., Brewer, P.A., Hudson-Edwards, K.A., Bird, G., Coulthard, T.J., Dennis, I.A., Lechler, P.J., 18
Miller, J.R., Turner, J.N., 2006. A geomorphological approach to the management of rivers contaminated 19
by metal mining. Geomorphology 79, 423–447. 20
Macklin, M.G., Hudson-Edwards, K.A., Dawson, E.J., 1997. The significance of pollution from historic metal 21
mining in the Pennine orefields on river sediment contaminant fluxes to the North Sea. Science of the 22
Total Environment 194-195, 391–397. 23
Macklin, M.G., Klimek, K., 1992. Dispersal , storage and transformation of metal- contaminated alluvium in the 24
upper Vistula basin, southwest Poland. Applied Geography 12, 7–30. 25
Masson, M., Blanc, G., Schäfer, J., 2006. Geochemical signals and source contributions to heavy metal (Cd, Zn, 26
Pb, Cu) fluxes into the Gironde Estuary via its major tributaries. Science of the Total Environment 370, 27
133–146. 28
Masson, M., Schäfer, J., Blanc, G., Pierre, A., 2007. Seasonal variations and annual fluxes of arsenic in the 29
Garonne, Dordogne and Isle Rivers, France. Science of the Total Environment 373, 196–207. 30
Mayes, W.M., Johnston, D., Potter, H.A.B., Jarvis, A.P., 2009. A national strategy for identification, 31
prioritisation and management of pollution from abandoned non-coal mine sites in England and Wales. I. 32
Methodology development and initial results. Science of the Total Environment 407, 5435–5447. 33
Meybeck, M., 2001. Transport et qualité des sédiments fluviaux : de la variabilité spatio-temporelle à la gestion. 34
La Houille Blanche 34–43. 35
Mighanetara, K., Braungardt, C.B., Rieuwerts, J.S., Azizi, F., 2009. Contaminant fluxes from point and diffuse 36
sources from abandoned mines in the River Tamar catchment, UK. Journal of Geochemical Exploration 37
100, 116–124. 38
Miller, J., Barr, R., Grow, D., Lechler, P., Richardson, D., Waltman, K., Warwick, J., 1999. Effects of the 1997 39
Flood on the Transport and Storage of Sediment and Mercury within the Carson River Valley, West-40
Central Nevada. The Journal of Geology 107, 313–327. 41
Miller, J.R., Hudson-Edwards, K.A., Lechler, P.J., Preston, D., Macklin, M.G., 2004. Heavy metal 42
contamination of water, soil and produce within riverine communities of the Río Pilcomayo basin, Bolivia. 43
Science of the Total Environment 320, 189–209. 44
Miller, J.R., Lechler, P.J., Mackin, G., Germanoski, D., Villarroel, L.F., 2007. Evaluation of particle dispersal 45
from mining and milling operations using lead isotopic fingerprinting techniques, Rio Pilcomayo Basin, 46
Bolivia. Science of the Total Environment 384, 355–373. 47
Moore, J., Luoma, S., 1990. Hazardous wastes from large-scale metal extraction. A case study. Environmental 48
Science & Technology 24, 1278–1285. 49
Ollivier, P., Radakovitch, O., Hamelin, B., 2006. Unusual variations of dissolved As, Sb and Ni in the Rhône 1
River during flood events. Journal of Geochemical Exploration 88, 394–398. 2
Ollivier, P., Radakovitch, O., Hamelin, B., 2011. Major and trace element partition and fluxes in the Rhône 3
River. Chemical Geology 285, 15–31. 4
Pont, D., Simonnet, J.-P., Walter, A.V., 2002. Medium-term Changes in Suspended Sediment Delivery to the 5
Ocean: Consequences of Catchment Heterogeneity and River Management (Rhône River, France). 6
Estuarine, Coastal and Shelf Science 54, 1–18. 7
Resongles, E., Casiot, C., Freydier, R., Dezileau, L., Viers, J., Elbaz-Poulichet, F., 2014. Persisting impact of 8
historical mining activity to metal (Pb, Zn, Cd, Tl, Hg) and metalloid (As, Sb) enrichment in sediments of 9
the Gardon River, Southern France. Science of the Total Environment 481, 509–521. 10
Schäfer, J., Blanc, G., 2002. Relationship between ore deposits in river catchments and geochemistry of 11
suspended particulate matter from six rivers in southwest France. Science of the Total Environment 298, 12
103–118. 13
SMAGE des Gardons, 2011. Etude de la qualité des eaux du bassin des Gardons. Phase 1 : Diagnostic, p.380. 14
Viers, J., Dupré, B., Gaillardet, J., 2009. Chemical composition of suspended sediments in World Rivers: New 15
insights from a new database. Science of the Total Environment 407, 853–868. 16
Young, P.L., 1997. The longevity of minewater pollution: a basis for decision-making. Science of the Total 17
Environment 194, 457–466. 18
Younger, P., Wolkersdorfer, C., 2004. Mining impacts on the fresh water environment: technical and managerial 19
guidelines for catchment scale management. Mine Water and the Environment 23, 2–80. 20
Žák, K., Rohovec, J., Navrátil, T., 2009. Fluxes of Heavy Metals from a Highly Polluted Watershed During 21
Flood Events: A Case Study of the Litavka River, Czech Republic. Water, Air, and Soil Pollution 203, 22
343–358. 23
Figure captions
1
Figure 1: Map of the studied area, showing the sampling station locations (details are given in Table 1 for
2
mining districts indicated by a letter A-F).
3
Figure 2: a) Daily discharge (in m3/s) measured at Ners from 2011 to 2013; arrows represent spatial
4
sampling campaign dates b) Hourly discharge in m3/s measured at Ners and at Anduze and Ales towns
5
during the two monitored floods of March 2013, crosses represent sample collection.
6
Figure 3: Spatial evolution of dissolved As, Cd, Pb, Sb, Tl and Zn concentrations from upstream to
7
downstream sites along the Gardon Ales River (zone 1), the Gardon Anduze River (zone 2) and
8
downstream from the confluence of these two rivers, at the Ners site (zone 3) under low flow and high flow
9
conditions. World river average values of dissolved concentrations from Gaillardet et al. (2003).
10
Figure 4: Spatial evolution of particulate As, Cd, Pb, Sb, Tl and Zn concentrations from upstream to
11
downstream sites along the Gardon Ales River (zone 1), the Gardon Anduze River (zone 2) and
12
downstream from the confluence of these two rivers, at the Ners site (zone 3) in SPM recovered during
13
high flow in November 2011. World river average values in SPM from Viers et al. (2009).
14
Figure 5: Temporal variations of dissolved As, Cd and Sb concentrations (in µg/L) and hourly discharge (in
15
m3/s) at Lezan (discharge measured at Anduze ~6 km upstream from Lezan site) and Ners during the
16
monitored floods of March 2013. The first point represents the dissolved concentrations measured during
17
winter low flow in December 2012. Horizontal dashed lines represent the concentration measured at station
18
8 (a, b and c) and station 10 (d, e, f) during the receding flow of November 2011.
19
Figure 6: Temporal variations of suspended particulate matter (SPM) concentration (in mg/L) and hourly
20
discharge (in m3/s) at Lezan (discharge measured at Anduze ~6 km upstream from Lezan site) and at Ners.
21
Figure 7: Temporal variations of particulate metal (Cd, Pb, Tl, Zn) and metalloid (As, Sb) concentrations
22
(in mg/kg) and hourly discharge (in m3/s) at Lezan (discharge measured at Anduze ~6 km upstream from
23
Lezan site) and Ners during the monitored floods of March 2013. Horizontal dashed lines represent the
24
concentration measured at station 8 (a, b) and station 10 (c, d) during the receding flow of November 2011.
25
Figure 8 : Relationship between a) Pb and As concentrations and b) Tl and Cd concentrations in SPM
26
collected during the flood Event 2 at Lezan. The geochemical background value of the Gardon River
27
watershed and sediments from flooding layers dated at 1976 are also shown. Relationship between c) Pb
28
and As concentrations and d) Tl and Cd concentrations in various contaminated materials collected on the
29
two main mining districts of the Gardon of Anduze River subwatershed (Carnoulès and Pallières mining
30
districts, Figure 1 and Table 1). The lines in panels c) and d) are extrapolations of regression lines shown in
31
panels a) and b).
32
*Concentrations are divided by 2 to fit into the scale
33
References : 1this study, 2Resongles et al. 2014, 3unpublished data, 4Leblanc et al. 1996 (graph c only),
34
5Casiot et al. 2009, 6Héry et al. 2014
35
Table captions
36
Table 1: Largest mining districts, their metal production, remaining wastes and the rivers that drain sites
37
(Alkaaby, 1986; BRGM, SIG Mines website).
38
Table 2 : Comparison of dissolved concentrations in the filtrates when filtration was performed at t=0 h and
39
t=72 h.
Table 3 : Dissolved and particulate metal(loid) concentrations from several European mining-impacted
1
rivers.
Mining district Metal production Mining wastes Impacted river Location code (Figure 1) Carnoulès Pb 30 000-65 000 t ; Zn 3500 t; Ag 20 t 1.3 Mt Amous A Pallières Zn 80 000 t; Pb 20 000 t; Ag 22 t 0.27 Mt Ourne and Aiguesmortes B
La Felgerette Sb 2750 t 38 000 t Ravin des Bernes C
Le Soulier Pyrite 4 Mt, Pb, Zn 1 Mt Gardon of Ales, Grabieux D
Rousson Zn 4300 t, pyrite n.d. Avène E
SPM As Cd Pb Sb Tl Zn mg/L µg/L µg/L µg/L µg/L µg/L µg/L t = 0 5.45 ± 0.06 0.009 ± 0.002 0.234 ± 0.003 0.99 ± 0.01 0.086 ± 0.002 1.31 ± 0.09 t = 72 h 5.1 ± 0.1 0.008 ± 0.003 0.171 ± 0.001 1.00 ± 0.02 0.094 ± 0.002 1.36 ± 0.06 t = 0 5.7 ± 0.1 0.010 ± 0.002 0.82 ± 0.01 0.57 ± 0.02 0.071 ± 0.001 3.18 ± 0.01 t = 72 h 5.6 ± 0.2 0.010 ± 0.002 0.136 ± 0.001 0.60 ± 0.02 0.116 ± 0.001 0.28 ± 0.02 Lezan station <5 71 Filtration delay Ners station
River Watershed area
(km²) Sample type As Cd Pb Sb Zn Reference
0.7-8.0a 0.005-0.08a 0.03-0.20a 0.12-11a 0.85-11a 2.9-10b 0.007-0.05b - 0.2-0.9b -22-87a 0.28-1.0a 38-138a 1.9-55a 145-335a 61-1233b 1.1-5.3b 116-772b 4.0-9.7b 270-1267b Dissolved phase (µg/L) - 0.01-0.27 0.05-0.32 - 3.1-17 SPM (mg/kg) 51-95 0.26-38 14-272 2.7-18 52-2656 Dissolved phase (µg/L) 0.1-35 <0.002-0.22 0.01-2.8 0.4-1.1 0.53-27 SPM (mg/kg) 18-109 0.79-12 32-338 - 180-2270 Dissolved phase (µg/L) 0.1-8.8 0.002-1.1 <d.l.-11 - 1.3-202 SPM (mg/kg) 2.0-302 0.9-40 9.4-1614 - 111-31369 Dissolved phase (µg/L) - 0.02-0.10 0.05-0.82 - 0.7-14 SPM (mg/kg) - 0.6-5.4 110-320 - 190-1100
Tamar River (UK) 1700 Dissolved phase (µg/L) 2.1-9.9 <d.l. <0.46 - 3.1-28 Mighanetara et al. (2009) Avoca River (Ireland) 652 Dissolved phase (µg/L) 0-0.03 0-0.61 - - 170-640 Gray (1998)
Litavka River (Czech Republic) 630 SPM (mg/kg) - 6.1-47 102-2070 - 603-3800 Žák et al. (2009) Dissolved phase (µg/L) 1.2-4.7 - 0.02-0.43 0.16-0.65 0.70-8.4
SPM (mg/kg) - 0.28-1.1 22-109 0.82-5.0 107-336 arange of values obtained from spatial surveys
brange of values obtained during flood monitoring at Lezan and Ners stations <d.l. lower than detection limit
Rhône River (France) 98800 Ollivier et al. (2011)
Audry (2003) & Coynel et al. (2007) for As and Sb Lot River (France) 11840
Tees River (UK) 1906
Isle River (France) 6600
Rybicka et al. (2005) Laslett (1995) Odra River (Czech Republic) 136 528
Gardon River (France) 1100
SPM (mg/kg) Dissolved phase (µg/L)
This study
Grosbois et al. (2009) & Masson et al. (2006, 2007)
" Ai Ai B B B B B B B B B B B B B ) " " ) " " ALES ANDUZE SALINDRES 0 5 km
¯
2 3 4 5 6 7 8 9 10 @Former mining sites Coal B Pb/Zn i Sb
Chemical industrial center @
"
! (
Autosampler station Manual sampling station Discharge monitoring station Town Watershed limit Gardon of Anduze subwatershed Gardon of Ales subwatershed FRANCE Rhône River Gardon River Study area Ourne Amous Avène Grabie ux Alzon Salindrenque Galeizon LEZAN NERS Richaldon Aigue s-mortes 1 ! ( ! ( Ravin des Bernes R R R ! ( A B C D E F
0 500 1000 H ou rl y di sc ha rg e (m 3 /s)
Gardon River at Ners site Gardon of Anduze River Gardon of Ales River Flood sampling 0 100 200 300 400 500 600 700 D ai ly d is ch ar ge (m 3 /s) 750 250 Event 1 Event 2 b) a) Spatial sampling
World river average 0 20 40 60 80 100 2 3 4 6 7 8 10
A
s (
m
g/
kg
)
0.0 0.5 1.0 1.5 2.0 2 3 4 6 7 8 10C
d
(m
g/
kg
)
0 50 100 150 2 3 4 6 7 8 10Pb
(m
g/
kg
)
0 100 200 300 400Zn
(m
g/
kg
)
0.0 0.5 1.0 1.5 2.0T
l (
m
g/
kg
)
0 10 20 30 40 50 60Sb
(m
g/
kg
)
1 2 3 1 2 3 1 2 3 1 2 3 1 2 3 1 2 3 Low flow High flowWorld river average
Station number Station number Station number
1 3 2
Gardon of Ales River Gardon of Anduze River Gardon River at Ners
1 3 2
Gardon of Ales River Gardon of Anduze River Gardon River at Ners
a) b) c) f) e) d) a) b) c) f) e) d) 0 2 4 6 8 10 1 2 3 4 5 6 7 8 9 10 A s ( µg /L ) 0 2 4 6 8 10 12 1 2 3 4 5 6 7 8 9 10 Sb (µ g/ L ) 0.0 0.1 0.2 0.3 0.4 1 2 3 4 5 6 7 8 9 10 T l ( µg /L ) 0.00 0.02 0.04 0.06 0.08 0.10 1 2 3 4 5 6 7 8 9 10 C d (µ g/ L ) 0.0 0.1 0.2 0.3 0.4 1 2 3 4 5 6 7 8 9 10 Pb (µ g/ L ) 0 2 4 6 8 10 12 1 2 3 4 5 6 7 8 9 10 Zn (µ g/ L )
World river average 0 20 40 60 80 100 2 3 4 6 7 8 10 A s ( m g/ kg ) 0.0 0.5 1.0 1.5 2.0 2 3 4 6 7 8 10 C d (m g/ kg ) 0 50 100 150 2 3 4 6 7 8 10 Pb (m g/ kg ) 0 100 200 300 400 2 3 4 6 7 8 10 Zn (m g/ kg ) 0.0 0.5 1.0 1.5 2.0 2 3 4 6 7 8 10 T l ( m g/ kg ) 0 10 20 30 40 50 60 2 3 4 6 7 8 10 Sb (m g/ kg ) 1 2 3 1 2 3 1 2 3 1 3 2
Gardon of Ales River Gardon of Anduze River Gardon River at Ners
a) b) c)
f) e)
0 200 400 600 0 0.1 0.2 0.3 0 200 400 600 800 1000 0 0.5 1.0 1.5 0 200 400 600 0 2 4 6 8 10 12 Discharge As 0 200 400 600 800 1000 0 2 4 6 8
LEZAN SITE LEZAN SITE
NERS SITE NERS SITE
Event 1 Event 2 2’2” Event 1 Event 2 a) b) d) e) 0 0.01 0.02 0.03 0.04 0.05 0 LEZAN SITE NERS SITE Event 1 Event 2 c) f) Discharge As DischargeSb Discharge Sb DischargeCd Discharge Cd Discharge (m 3/s) Discharge (m 3/s) Discharge (m 3/s) Discharge (m 3/s) 0 200 400 600 0 200 400 600 800 1000 Discharge (m 3/s) Discharge (m 3/s)
Concentration (µg/L) Concentration (µg/L) Concentration (µg/L)
0.01 0.02 0.03 0.04 0.05 Concentration (µg/L) Concentration (µg/L) Concentration (µg/L)
0 100 200 300 400 500 600 700 800 900 0 100 200 300 400 500 600 700 Discharge SPM D is ch ar ge (m 3/s) SP M (m g/ L ) D is ch ar ge (m 3 /s) SP M (m g/ L ) 0 50 100 150 200 250 300 350 400 0 100 200 300 400 500 600 Discharge SPM Event 2 Event 1 LEZAN SITE NERS SITE a) b)