HAL Id: hal-00297882
https://hal.archives-ouvertes.fr/hal-00297882
Submitted on 3 Apr 2007HAL is a multi-disciplinary open access
archive for the deposit and dissemination of sci-entific research documents, whether they are pub-lished or not. The documents may come from teaching and research institutions in France or abroad, or from public or private research centers.
L’archive ouverte pluridisciplinaire HAL, est destinée au dépôt et à la diffusion de documents scientifiques de niveau recherche, publiés ou non, émanant des établissements d’enseignement et de recherche français ou étrangers, des laboratoires publics ou privés.
Methane hydrate stability and anthropogenic climate
change
D. Archer
To cite this version:
D. Archer. Methane hydrate stability and anthropogenic climate change. Biogeosciences Discussions, European Geosciences Union, 2007, 4 (2), pp.993-1057. �hal-00297882�
BGD
4, 993–1057, 2007 Methane hydrate stability and anthropogenic climate change D. Archer Title Page Abstract Introduction Conclusions References Tables Figures ◭ ◮ ◭ ◮ Back Close Full Screen / EscPrinter-friendly Version Interactive Discussion Biogeosciences Discuss., 4, 993–1057, 2007
www.biogeosciences-discuss.net/4/993/2007/ © Author(s) 2007. This work is licensed under a Creative Commons License.
Biogeosciences Discussions
Biogeosciences Discussions is the access reviewed discussion forum of Biogeosciences
Methane hydrate stability and
anthropogenic climate change
D. Archer
Department of the Geophysical Sciences, University of Chicago, Chicago, USA Received: 20 March 2007 – Accepted: 25 March 2007 – Published: 3 April 2007 Correspondence to: D. Archer ([email protected])
BGD
4, 993–1057, 2007 Methane hydrate stability and anthropogenic climate change D. Archer Title Page Abstract Introduction Conclusions References Tables Figures ◭ ◮ ◭ ◮ Back Close Full Screen / EscPrinter-friendly Version Interactive Discussion
Abstract
Methane frozen into hydrate makes up a large reservoir of potentially volatile carbon below the sea floor and associated with permafrost soils. This reservoir intuitively seems precarious, because hydrate ice floats in water, and melts at Earth surface conditions. The hydrate reservoir is so large that if 10% of the methane were released
5
to the atmosphere within a few years, it would have an impact on the Earth’s radiation budget equivalent to a factor of 10 increase in atmospheric CO2.
Hydrates are releasing methane to the atmosphere today in response to anthro-pogenic warming, for example along the Arctic coastline of Siberia. However most of the hydrates are located at depths in soils and ocean sediments where anthropogenic
10
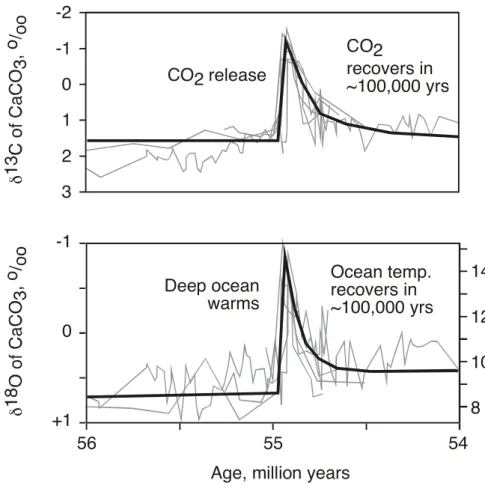
warming and any possible methane release will take place over time scales of millen-nia. Individual catastrophic releases like landslides and pockmark explosions are too small to reach a sizable fraction of the hydrates. The carbon isotopic excursion at the end of the Paleocene has been interpreted as the release of thousands of Gton C, pos-sibly from hydrates, but the time scale of the release appears to have been thousands
15
of years, chronic rather than catastrophic.
The potential climate impact in the coming century from hydrate methane release is speculative but could be comparable to climate feedbacks from the terrestrial biosphere and from peat, significant but not catastrophic. On geologic timescales, it is conceiv-able that hydrates could release much carbon to the atmosphere/ocean system as we
20
do by fossil fuel combustion.
BGD
4, 993–1057, 2007 Methane hydrate stability and anthropogenic climate change D. Archer Title Page Abstract Introduction Conclusions References Tables Figures ◭ ◮ ◭ ◮ Back Close Full Screen / EscPrinter-friendly Version Interactive Discussion
1 Methane in the carboncycle
1.1 Sources of methane 1.1.1 Juvenile methane
Methane, CH4, is the most chemically reduced form of carbon. In the atmosphere
and in parts of the biosphere controlled by the atmosphere, oxidized forms of carbon
5
are most stable, such as CO2, the carbonate ions in seawater, and CaCO3 minerals.
Methane is therefore a transient species in our atmosphere; its concentration must be maintained by ongoing release. One source of methane to the atmosphere is the reduced interior of the Earth, via volcanic gases and hydrothermal vents. Reducing power can leak from the interior of the Earth in other forms, such as molecular
hydro-10
gen, which creates methane from CO2. The other source of reduced carbon is from photosynthesis, harvesting energy from sunlight. By far the greatest portion of the methane was generated originally from photosynthesis, rather than juvenile release from the Earth.
Photosynthesis does not produce methane directly, because methane as a gas has
15
little use in the biochemical machinery. Most biomolecules utilize carbon in an inter-mediate oxidation state, such as carbohydrates made up of multiples of the unit CH2O with zero oxidation state, or on the reduced end of the spectrum lipids with an oxidation state near –2. Once produced, biomolecules can be post-processed into methane by one of two general pathways. One is biological, mediated by bacteria at low
tempera-20
tures, and the other is abiological, occurring spontaneously at elevated temperatures. 1.1.2 Biogenic methane
Biogenic methane is a product of organic matter degradation. Microbial respiration tends to utilize the partner electron acceptor which will maximize the energy yield from the organic matter. In the presence of molecular oxygen, O2, oxic respiration is the
25
BGD
4, 993–1057, 2007 Methane hydrate stability and anthropogenic climate change D. Archer Title Page Abstract Introduction Conclusions References Tables Figures ◭ ◮ ◭ ◮ Back Close Full Screen / EscPrinter-friendly Version Interactive Discussion most energetically lucrative, and this is the pathway that is followed. With the depletion
of O2, respiration proceeds using electron acceptors in the order NO− 3, Mg
2+, Fe2+,
then SO2−4 . Of these, SO2−4 has potentially the highest availability, because seawater contains high concentrations of SO2−4 . Once the SO2−4 is depleted, mathanogenesis can begin. Fresh water has less SO2−4 than seawater, so methanogenesis begins
di-5
agenetically earlier in fresh water systems. These pathways can be distinguished by their isotopic signatures ofδ13C and δD in the methane (Sowers, 2006; Whiticar and
Faber, 1986) . In sulfate-depleted salt water, the dominant pathway is the reduction of CO2by molecular hydrogen, H2. H2is produced bacterially by fermentation of organic
matter, and is ubiquitous in marine sediments, implicated in many other diagenetic
re-10
actions such as iron, manganese, and nitrate reduction (Hoehler et al., 1999). Carbon isotopic values range from –60 to –100‰ whileδD is typically –175 to –225‰. In fresh
waters, the dominant pathway appears to be by the splitting of acetate into CO2 + CH4. Acetate, CH3COO−, can be produced from molecular hydrogen, H2, and CO2
(Hoehler et al., 1999). The H2is produced by fermentation of organic matter (Hoehler
15
et al., 1998). The isotopic signature is –40 to –50 inδ13C, and –300 to –350‰ inδD.
Ultimately, by conservation of oxidation state, if the source of reducing power is organic matter, then a maximum of 50% of the organic carbon can be converted to methane (Martens et al., 1998), by the reaction
2CH2O− > CO2+ H2O
20
In sediments, biogenic methane production at the Blake Ridge is inferred to take place hundreds of meters below the depth where SO2−4 is depleted. , as indicated by linear gradients in SO2−4 and CH4 as they diffuse toward their mutual annihiliation at
the methane sulfate boundary (Egeberg and Barth, 1998). At other locations methano-genesis is inferred to be occurring throughout the sulfate-rich zone, but methane only
25
accumulates to high concentrations when sulfate is gone (D’Hondt et al., 2004; D’Hondt et al., 2002). Biological activity has been inferred to take place as deep as 800 meters below the sea floor (D’Hondt et al., 2002, 2004; Wellsbury et al., 2002).
BGD
4, 993–1057, 2007 Methane hydrate stability and anthropogenic climate change D. Archer Title Page Abstract Introduction Conclusions References Tables Figures ◭ ◮ ◭ ◮ Back Close Full Screen / EscPrinter-friendly Version Interactive Discussion 1.1.3 Thermogenic methane
As temperatures increase to about 110◦C degrees (Milkov, 2005), methane is
pro-duced, abiologically, from photosynthetically-produced organic matter. This thermo-genic methane is distinguished by carbon isotopic values of about –30‰ (Whiticar and Faber, 1986), in contrast with the much lighter values, –60 to –110‰ of biogenic
5
methane. Thermogenic methane is often associated with petroleum, coal, and other forms of fossil carbon. Petroleum is converted to methane if the deposits have ever been buried deeper than the “oil window” of 7–15 km depth (Deffeyes, 2001). Most of the hydrates in the ocean derive from biogenic methane, but the Gulf of Mexico (Milkov, 2005) and the Siberian gas fields (Grace and Hart, 1986) are examples of hydrate
sys-10
tems dominated by thermogenic methane.
Thermogenic methane is also accompanied by other small organic compounds such as ethane (Milkov, 2005). In addition to serving as a tracer for the origin of the methane, these compounds affect the thermodynamics of hydrate formation. Pure methane forms Type I structural hydrates, while the inclusion of a few percent of ethane or H2S
15
favors Type II structure. Type II hydrates are stable to 5–10◦C warmer, or perhaps
100 m deeper in the geothermal gradient in warmer temperatures (Sloan, 1998). 1.2 Radiative impacts of methane release
1.2.1 Atmospheric release
CO2 is the dominant anthropogenic greenhouse gas in the atmosphere, because the
20
anthropogenic perturbation to the CO2 concentration is much larger than the
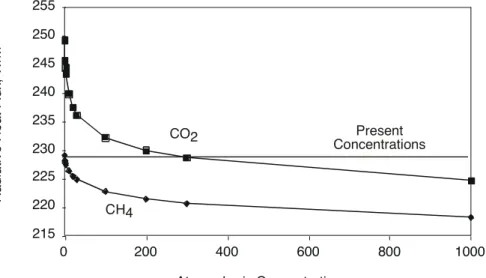
anthro-pogenic change in CH4. However, the higher concentration of CO2 means that on a per-molecule basis, CO2 is a less potent greenhouse gas than CH4. Figure 1 shows
the direct radiative impact of changes in CO2and CH4 concentrations. The most
sig-nificant practical distinction between the gases is that CO2 is more concentrated in
25
the atmosphere than is methane. For this reason, the strongest absorption bands of 997
BGD
4, 993–1057, 2007 Methane hydrate stability and anthropogenic climate change D. Archer Title Page Abstract Introduction Conclusions References Tables Figures ◭ ◮ ◭ ◮ Back Close Full Screen / EscPrinter-friendly Version Interactive Discussion CO2already absorb most of the outgoing longwave light from the ground. An increase
in CO2 concentration tends to make the absorption bands a bit wider, but they
can-not get any more intense. Methane is less concentrated than CO2, and its absorption
bands less saturated, so a single molecule of additional methane has a larger impact on the radiation balance than a molecule of CO2, by about a factor of 24 (Wuebbles
5
and Hayhoe, 2002). Methane has an indirect radiative effect, as its oxidation in the stratosphere produces water vapor (Hansen et al., 2005). The radiative impact of CH4 follows the concentration to roughly the 1/3 power, while the CO2impact follows the log
of the concentration. To get an idea of the scale, we note that a doubling of methane from present-day concentration would be equivalent to 60 ppm increase in CO2 from
10
present-day, and 10 times present methane would be equivalent to about a doubling of CO2. A release of 500 Gton C as methane (order 10% of the hydrate reservoir) to
the atmosphere would have an equivalent radiative impact to a factor of 10 increase in atmospheric CO2.
Once methane is released to the oxic, sunlit atmosphere, it oxidizes to CO2 on a
15
time scale of about a decade. Ultimately, the oxidizing power comes from O2, but the
reactive compound OH is a necessary intermediate, following the reaction CH4+ OH− > CH3+ H2O
where CH3produced is a reactive radical compound, quickly reacting with water vapor
and other gases to form ultimately CO2. OH is produced by photolysis, the absorption
20
of light energy by the severing of a chemical bond. Ozone photolyzes in the tropo-sphere to yield OH, as does H2O2 and NO2. In the absence of sunlight, such as in ice
cores, no OH is produced, and CH4and O2are able to coexist with negligible reaction for hundreds of thousands of years.
The implication of the short lifetime of methane in the atmosphere is that the
con-25
centration of methane at any given time is determined by the rate of methane emission over the past few decades. If emission is steady with time, then the steady-state
BGD
4, 993–1057, 2007 Methane hydrate stability and anthropogenic climate change D. Archer Title Page Abstract Introduction Conclusions References Tables Figures ◭ ◮ ◭ ◮ Back Close Full Screen / EscPrinter-friendly Version Interactive Discussion spheric concentration can be expressed as
Inventory [mol]=Emission flux[mol/year]. Atmospheric lifetime [years]
One uncertainty in this equation is how strongly the methane lifetime may depend on the methane source flux. If the methane oxidation rate is limited by the supply rate of OH, then an increase in the methane source flux could increase the methane lifetime in
5
the atmosphere. In atmospheric photochemical models, a doubling of the source flux results in more than a doubling of the concentration (Pavlov et al., 2000).
The concentration of OH, and hence the lifetime and steady-state concentration of methane, could theoretically be affected by anthropogenic emissions of combustion products such as the nitrogen oxides NOx, hydrocarbons, and carbon monoxide. In
10
another atmospheric chemistry model (Wang and Jacob, 1998), the concentrations of several of gases have undergone order-one changes, but the effects of these changes on the OH concentration appear to largely cancel each other out.
If the methane is released quickly, on a time scale that is short compared to the atmospheric lifetime, the methane concentration spikes upward, decaying back toward
15
the steady-state concentration. We will refer to a fast release as a “catastrophic” methane release, as opposed to a long-term ongoing or “chronic” release. If the record of methane concentration recorded in an ice core is smoothed by too much time-averaging, then the maximum concentration of the event may not be recorded in ice cores (Thorpe et al., 1996). The current inventory of methane in the atmosphere is
20
about 3 Gton C. Therefore, the release of 1 Gton C of methane catastrophically to the atmosphere would raise the methane concentration by 33%. 10 Gton C would triple atmospheric methane.
1.2.2 Radiative impact of methane oxidized in the ocean
Once the methane is oxidized to CO2, it still acts as a greenhouse gas, albeit with
25
less intensity. CO2 equilibrates between the atmosphere and the ocean on a time
scale of hundreds of years (Archer, 2005). Depending on the magnitude of the CO2 999
BGD
4, 993–1057, 2007 Methane hydrate stability and anthropogenic climate change D. Archer Title Page Abstract Introduction Conclusions References Tables Figures ◭ ◮ ◭ ◮ Back Close Full Screen / EscPrinter-friendly Version Interactive Discussion release, i.e. the pH perturbation of the ocean, the equilibrium between the atmosphere
and the ocean finds 15–30% of the CO2 release remains in the atmosphere. This partitioning will apply whether the methane is oxidized in the atmosphere or in the oxic ocean. If the methane is oxidized in the atmosphere, the initial condition has more CO2in the atmosphere than at equilibrium, and the excess CO2will invade the ocean.
5
Methane oxidized in the ocean will increase the inventory of CO2in the ocean, leading
to gradual degassing of 15–30% over the coming centuries. The final distribution of the CO2 between the atmosphere and ocean will be the same regardless of whether the source of the CO2is in the atmosphere or the ocean.
Excess CO2in the atmosphere is gradually neutralized by dissolution of carbonate
10
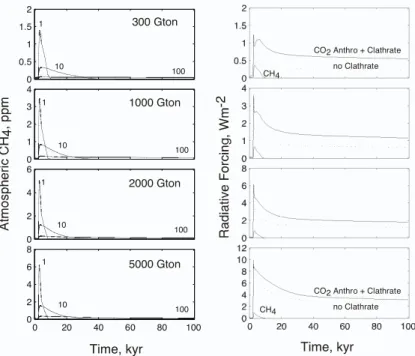
and silicate rocks, on time scales that range as long as 400 kyr (Archer, 2005). So, while methane is a transient species in the atmosphere, CO2 accumulates. For this
reason, the impact of a slow, ongoing methane release might be to have greater radia-tive forcing from the accumulated CO2than from the increased methane concentration, even while the methane release is ongoing (Fig. 2 from Archer and Buffett, 2005, see
15
also Harvey and Huang, 1995; Schmidt and Shindell, 2003).
There exists an alternate pathway for methane oxidiation which does not produce CO2, but rather bicarbonate ion HCO−3. This is anaerobic oxidation of methane (AOM)
(Boetius et al., 2000),
SO2−4 + CH4→ HCO−3 + HS−+ H2O
20
The fate of the released alkalinity is often to precipitate as CaCO3. Authigenic CaCO3
has been used as a tracer for the locations of CH4emissions at Hydrate Ridge (Teichert
et al., 2003, 2005), and invoked as an active player in the life cycle of an emission field (Luff et al., 2005). A young vent site should have an irregular, patchy distribution of carbonates, while an old site has become paved over with large flat CaCO3 slabs,
25
which tend to seal off the methane emission (Sager et al., 1999).
BGD
4, 993–1057, 2007 Methane hydrate stability and anthropogenic climate change D. Archer Title Page Abstract Introduction Conclusions References Tables Figures ◭ ◮ ◭ ◮ Back Close Full Screen / EscPrinter-friendly Version Interactive Discussion
2 The geology of methane hydrate
2.1 Methane production
The majority of the hydrate deposits on Earth are composed of biogenic methane, as indicated by its isotopic composition and the lack of other short hydrocarbons such as ethane. Most of the organic matter raining to the sea floor decomposes in the few
cen-5
timeters of the sediment, called the zone of early diagenesis. However, the production of methane from this decaying organic matter is usually inhibited by the presence of dissolved sulfate, providing a more energetically favorable respiration pathway.
Sulfate is removed from pore waters deeper in the sediment by reaction with methane (anaerobic oxidation of methane, AOM, described above) . This reaction prevents
10
sulfate and methane from coexisting at high concentrations in sediment porewa-ters. Typically both species diffuse toward their mutual annihilation at a well-defined methane/sulfate boundary (Borowski et al., 1996, 1999; D’Hondt et al., 2004). After the depletion of sulfate, methane can be produced from solid organic carbon, or by reaction of dissolved organic carbon, notably acetate, carried into the methanogenesis
15
zone by diffusion or pore water advection. Wellsbury et al. (1997) found that heating sediment in the lab, up to 60◦C, stimulates the bacterial production of acetate. At Blake
Ridge, the concentration of acetate reaches very high concentrations, supplying 10% of the reduced carbon necessary for methane production (Egeberg and Barth, 1998).
Bacterial abundances and metabolic rates of methanogenesis, acetate formation,
20
and AOM are extremely high at the base of the hydrate and gas zone, rivaling metabolic rates at the sediment surface (Parkes et al., 2000). Bacterial activity is detected within the hydrate zone as well Orcutt et al. (2004).
BGD
4, 993–1057, 2007 Methane hydrate stability and anthropogenic climate change D. Archer Title Page Abstract Introduction Conclusions References Tables Figures ◭ ◮ ◭ ◮ Back Close Full Screen / EscPrinter-friendly Version Interactive Discussion 2.2 Methane transport
2.2.1 Diffusion
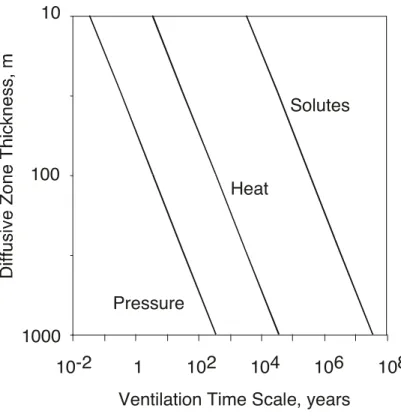
Once formed, methane moves within the sediment column by diffusion, porewater flow, or migration of bubbles. The time scale for diffusion depends on the length scale as
T [s] = ∆x2[m2]/D[m2/s]
5
whereD is a diffusion coefficient, of order 10−9, 10−6, and 10−4m2/s for a solute, for
heat, and for pressure, respectively. Heat can diffuse approximately 100 m in about 300 years (Fig. 3). Solutes such as dissolved methane diffuse more slowly, while a pressure perturbation, such as would result from melting of hydrate to methane bubbles, diffuses away more quickly.
10
Diffusion is slow enough to insulate most of the hydrate reservoir from anthropogenic warming in the coming century. Methane released to the dissolved phase, such as proposed by (Sultan et al., 2004), is unlikely to have much impact on climate for this reason also.
2.2.2 Aqueous flow
15
Pore water flow has the potential to determine the distribution of hydrates within the sediment column. One source of fluid flow is the compaction of sediment as it is buried and subjected to increasing lithostatic pressure. The degree of compaction of sediment grains is a conserved diagnostic of the maximum lithostatic pressure they have endured (Flemings et al., 2003). Subducting sediments in active margins expel water more
20
quickly than passive margins. Formation of hydrates at the surface and dissolution at depth apparently also acts as a source of upward flowing pore fluid at Hydrate Ridge (Suess et al., 1999).
Pore water flow can be focused by layers of high permeability in sediments (Aoki et al., 2000; Flemings et al., 2003; Hovland et al., 1997). Lateral flow steered by
sedi-25
BGD
4, 993–1057, 2007 Methane hydrate stability and anthropogenic climate change D. Archer Title Page Abstract Introduction Conclusions References Tables Figures ◭ ◮ ◭ ◮ Back Close Full Screen / EscPrinter-friendly Version Interactive Discussion ment permeability predicts expulsion of fluid near the base of the continental slope off
of New Jersey, consistent with the observed patterns of porewater seeps, and leading to nucleation of landslides from the base of the slope, consistent with the observation of submarine canyons on continental margins (Dugan and Flemings, 2000). Fluid flow of methane-bearing porewater might be regulated by the formation of authigenic
car-5
bonate, blocking and steering the channels of flow (Luff et al., 2005). Focused fluid effluent from the sediment into the ocean generates a structure known as a mud vol-cano (Dimitrov, 2002). There are approximately 1800 mud volvol-canos around the world, above and below sea level, mostly centered in a belt called the mud volcano belt be-ginning in the Mediterranean Sea and winding across Asia to Indonesia. Submarine
10
mud volcanos are often associated with methane hydrates (see below). 2.2.3 Gas migration
In addition to pore water flow, methane is able to move as a gas. In cohesive sedi-ments, bubbles expand by fracturing the sediment matrix, resulting in elongated shapes (Boudreau et al., 2005). Bubbles tend to rise because they are less dense than the
wa-15
ter they are surrounded by, even at the 200+ atmosphere pressures in sediments of the deep sea. If the pressure in the gas phase exceeds the lithostatic pressure in the sediment, fracture and gas escape can occur (Flemings et al., 2003). Modeled and measured (Dickens et al., 1997) pressures in the sediment column at Blake Ridge indicate that this may be going on.
20
There is a differential-pressure mechanism which begins to operate when the bub-bles occupy more than about 10% of the volume of the pore spaces (Hornbach et al., 2004). If a connected bubble spans a large enough depth range, the pressure of the pore water will be higher at the bottom of the bubble than it is at the top, because of the weight of the pore water over that depth span. The pressure inside the bubble
25
will be more nearly constant over the depth span, because the compressed gas is not as dense as the pore water is. This will result in a pressure gradient at the top and the bottom of the bubble, tending to push the bubble upward. Hornbach et al. (2004)
BGD
4, 993–1057, 2007 Methane hydrate stability and anthropogenic climate change D. Archer Title Page Abstract Introduction Conclusions References Tables Figures ◭ ◮ ◭ ◮ Back Close Full Screen / EscPrinter-friendly Version Interactive Discussion postulated that this mechanism might be responsible for allowing methane to escape
from the sediment column, and calculated the maximum thickness of an interconnected bubble zone, before the bubbles would break through the overlying sediment column. In their calculations, and in in stratigraphic deposits (they refer to them as “basin set-tings”) the thickness of the bubble column increases as the stability zone gets thicker.
5
It takes more pressure force to break through a thicker stability zone, so a taller column of gas is required. In compressional settings, where the dominant force is directed sideways by tectonics, rather than downward by gravity, the bubble layer is never as thick, reflecting an easier path to methane escape.
There are multiple lines of evidence that gas can be transported through the
hy-10
drate stability zone, without freezing into hydrate. Seismic studies at Blake Ridge have observed the presence of bubbles along faults in the sediment matrix (Taylor et al., 2000). Faults have been correlated with sites of methane gas emission from the sea floor (Aoki et al., 2000; Zuhlsdorff and Spiess, 2004; Zuhlsdorff et al., 2000). Seismic studies often show “wipeout zones” where the bubble zone beneath the hydrate
sta-15
bility zone is missing, and all of the layered structure of the sediment column within the stability zone is smoothed out. These are interpreted to be areas where gas has broken through the structure of the sediment to escape to the ocean (Hill et al., 2004; Riedel et al., 2002; Wood et al., 2002). Bubbles associated with seismic wipeout zones are observed within the depth range which should be within the hydrate stability zone,
20
assuming that the temperature of the sediment column is the steady-state expression of the local average geothermal gradient (Gorman et al., 2002). This observation has been explained by assuming that upward migration of the fluid carries with it heat, main-taining a warm channel where gas can be transported through what would otherwise be thermodynamically hostile territory (Taylor et al., 2000; Wood et al., 2002).
25
The potential for gas migration through the stability zone is one of the more signifi-cant uncertainties in forecasting the ocean hydrate response to anthropogenic warming (Harvey and Huang, 1995).
BGD
4, 993–1057, 2007 Methane hydrate stability and anthropogenic climate change D. Archer Title Page Abstract Introduction Conclusions References Tables Figures ◭ ◮ ◭ ◮ Back Close Full Screen / EscPrinter-friendly Version Interactive Discussion 2.3 Physical chemistry of methane hydrate
2.3.1 Thermodynamics
If the methane dissolved concentration reaches the saturation value for hydrate forma-tion at the local temperature and pressure condiforma-tions, methane and water will freeze together into methane hydrate or clathrate deposits. Thermodynamically, the stability
5
of hydrate is determined by the temperature and by the availability of methane. The phase boundary is usually drawn assuming the presence of bubbles of pure methane, so that the partial pressure of methane is determined by the total fluid pressure. The partial pressure of methane dissolved in oxic seawater is vanishingly small, but if hy-drate would be stable given the presence of methane bubbles, we call that the phase
10
boundary of hydrate stability in Fig. 4. At atmospheric pressure, hydrate is never stable at Earth surface temperatures. At water depths of 100 m, hydrate would form at about –20◦C, while at 500 m depth, the melting temperature approaches in situ temperatures.
This minimum stability depth is somewhat shallower in the high-latitude oceans, about 200 m in the Arctic Ocean, because the upper water column is colder (Fig. 4). In some
15
locations, such as under the sealed-off ice complex in Siberia, or in rapidly depositing or low permeability sediments, the fluid pressure can be influenced by the weight of solids, and the fluid pressure will approach the lithostatic pressure rather than the hy-drostatic pressure. The stability depth for hydrate in permafrost in the lithostatic case is about 200 m (Buffett, 2000), but hydrate has been inferred to exist shallower than that,
20
sealed into “ice-bonded” permafrost (Dallimore and Collett, 1995). 2.3.2 Kinetics
Hydrate can persist metastably, several degrees above its thermodynamic melting tem-perature, because of the energy barrier of nucleating small bubbles of methane gas (Buffett and Zatsepina, 1999). Rapid depressurization such as occurs during core
re-25
trieval does lead to melting of hydrate (Circone et al., 2000). The dissolution of hydrates 1005
BGD
4, 993–1057, 2007 Methane hydrate stability and anthropogenic climate change D. Archer Title Page Abstract Introduction Conclusions References Tables Figures ◭ ◮ ◭ ◮ Back Close Full Screen / EscPrinter-friendly Version Interactive Discussion appears to be diffusion controlled (Rehder et al., 2004). In general, kinetic effects are
probably of secondary importance for predicting the hydrate response to anthropogenic climate change, because the thermal forcing takes place on such long time scales.
Lab experiments show that hydrate can nucleate from the pure aqueous phase, with no bubbles required, helping the creation of hydrate from advective or biogenic
5
methane (Buffett and Zatsepina, 2000). Several studies (Clennell et al., 2000; Clennell et al., 1999; Lorenson, 2000) predict inhibition of hydrate formation in fine-grained sed-iment caused by the high activation energy of forming small crystals in the hydrophobic small cavities of the pore water. This would explain the characteristic textures of hy-drate: as pore-filling cement in coarse-grained sediment, but as irregularly shaped
10
masses of pure hydrate in fine-grained sediment, and predicts that hydrates should form first or predominantly in sandy sediments (Lorenson, 2000; Winters et al., 2004). 2.4 Mechanisms of methane release
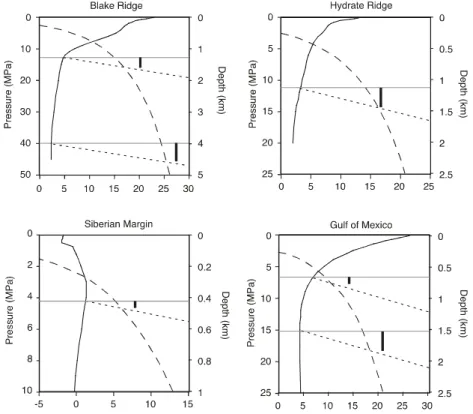
2.4.1 Deep ocean temperature change
The time-dependence of changes in the inventory of methane in the hydrate reservoir
15
depends on the time scales of temperature and chemical processes acting. Figure 5 shows the approximate time scales for altering the temperatures of the ocean, as a function of depth. There is evidence from paleotracers (Martin et al., 2005) and from modeling (Archer et al., 2004) that the temperature of the deep sea is sensitive to the climate of the Earth’s surface. In general, the time scale for changing the temperature
20
of the ocean increases with depth. There are significant regional variations in the ventilation time of the ocean, and in the amount of warming that might be expected in the future. As has already been mentioned, the Arctic is expected to warm particularly strongly, because of the albedo feedback from melting Artic ice cap. Temperatures in the North Atlantic appear to be sensitive to changes in ocean circulation such as during
25
Dansgaard Oeschger climate events (Dansgaard et al., 1989).
As described above, the top of the hydrate stability zone is at 200-600 m water depth, 1006
BGD
4, 993–1057, 2007 Methane hydrate stability and anthropogenic climate change D. Archer Title Page Abstract Introduction Conclusions References Tables Figures ◭ ◮ ◭ ◮ Back Close Full Screen / EscPrinter-friendly Version Interactive Discussion depending on the temperature of the water column and the solubility of the hydrate
un-der the local chemical conditions (sulfide, hydrocarbons). Within the sediment column, the temperature increases with depth along the geothermal temperature gradient, 30– 50◦C/km (Harvey and Huang, 1995). The shallowest sediments that could contain
hy-drate only have a thin hyhy-drate stability zone, and the stability zone thickness increases
5
with water depth. A change in the temperature of the deep ocean will act as a change in the upper boundary condition of the sediment temperature profile. Warming of the overlying ocean does not put surface sediments into undersaturation, but the warmer overlying temperature propagates downward until a new profile with the same geother-mal temperature gradient can be established. How long this takes is a strong (second
10
order) function of the thickness of the stability zone, but the time scales are in general long. In 1000 years the temperature signal should have propagated about 180 m in the sediment (Fig. 3). In the steady state, an increase in ocean temperature will decrease the thickness of the stability zone. Dickens et al. (2001) calculated that the volume of the stability zone ought to decrease by about a factor of 2 with a temperature increase
15
of 5◦C.
After an increase in temperature of the overlying water causes hydrate to melt at the base of the stability zone, the fate of the released methane is difficult to predict. The increase in pore volume and pressure could provoke gas migration through the stability zone (see Gas Migration section) or a landslide, or the bubbles could remain
20
enmeshed in the sediment matrix. Hydrate is carried to the base of the stability zone by the accumulation of sediment at the sea floor, so melting of hydrate at the stability zone takes place continuously, not just associated with ocean warming.
2.4.2 Pockmarks
The sediment surface of the world’s ocean has holes in it called pockmarks (Hill et
25
al., 2004; Hovland and Judd, 1988), interpreted to be the result of catastrophic or continuous escape of gas to the ocean. Pockmarks off of Norway are accompanied by authigenic carbonate deposits associated with anerobic oxidation of methane (Hovland
BGD
4, 993–1057, 2007 Methane hydrate stability and anthropogenic climate change D. Archer Title Page Abstract Introduction Conclusions References Tables Figures ◭ ◮ ◭ ◮ Back Close Full Screen / EscPrinter-friendly Version Interactive Discussion et al., 2005). Pockmarks range in size from meters to kilometers (Hovland et al., 2005),
with one 700 km2example on the Blake Ridge (Kvenvolden, 1999). If the Blake Ridge pockmark is the result of a catastrophic explosion, it might have released less than a Gton C as methane (assuming a 500 m thick layer of 4% methane yields 1 Gton). Pockmark methane emission is most significant as an ongoing “chronic” source rather
5
than single “catastrophic” releases. 2.4.3 Landslides
Another mechanism for releasing methane from the sediment column is by submarine landslides. These are a normal, integral part of the ocean sedimentary system (Hamp-ton et al., 1996; Nisbet and Piper, 1998) . Submarine landslides are especially
preva-10
lent in river deltas, because of the high rate of sediment delivery, and the presence of submarine canyons. The tendency for slope failure can be amplified if the sediment accumulates more quickly than the excess porosity can be squeezed out. This can lead to instability of the sediment column, causing periodic Storegga-type landslides off the coast of Norway (see below), in the Mediterranean Sea (Rothwell et al., 2000) or
15
potentially off the East coast of the United States (Dugan and Flemings, 2000). Maslin et al. (2004) find that 70% of the landslides in the North Atlantic over the last 45 kyr occurred within the time windows of the two meltwater peaks 15–13 and 11–8 kyr ago. These could have been driven by deglacial sediment loading or warming of the water column triggering hydrate melting.
20
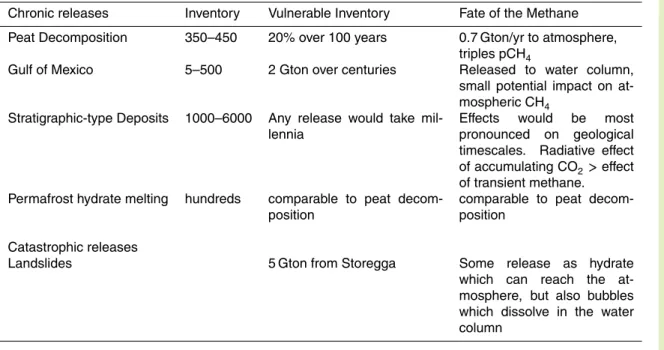
Warming temperatures or sea level changes may trigger the melting of hydrate de-posits, provoking landslides (Driscoll et al., 2000; Kvenvolden, 1999; Vogt and Jung, 2002). Paul (1978) calculates that landslides can release up to about 5 Gton C as methane, enough to alter the radiative forcing by about 0.2 W/m2. The origin of these estimates is discussed in the section on the Storegga Slide, below.
25
BGD
4, 993–1057, 2007 Methane hydrate stability and anthropogenic climate change D. Archer Title Page Abstract Introduction Conclusions References Tables Figures ◭ ◮ ◭ ◮ Back Close Full Screen / EscPrinter-friendly Version Interactive Discussion 2.4.4 Fate of methane released as bubbles
Methane released from sediments in the ocean may reach the atmosphere directly, or it may dissolve in the ocean. Bubbles are not generally a very efficient means of trans-porting methane through the ocean to the atmosphere. (Rehder et al., 2002) compared the dissolution kinetics of methane and argon, and found enhanced lifetime of methane
5
bubbles below the saturation depth in the ocean, about 500 meters, because a hydrate film on the surface of the methane bubbles inhibited gas exchange. Bubbles dissolve more slowly from petroleum seeps, where oily films on the surface of the bubble in-hibits gas exchange, also changing the shapes of the bubbles (Leifer and MacDonald, 2003). On a larger scale, however, (Leifer et al., 2000) diagnosed that the rate of
bub-10
ble dissolution is limited by turbulent transport of methane-rich water out of the bubble stream into the open water column. The magnitude of the surface dissolution inhibition seems small; in the (Rehder et al., 2002) study a 2 cm bubble dissolves in 30 m above the stability zone, and only 110 m below the stability zone. Acoustic imaging of the bubble plume from Hydrate Ridge showed bubbles surviving from 600–700 m water
15
depth where they were released to just above the stability zone at 400 m (Heeschen et al., 2003). One could imagine hydrate-film dissolution inhibition as a mechanism to concentrate the release of methane into the upper water column, but not really as a mechanism to get methane through the ocean directly to the atmosphere.
Methane can reach the atmosphere if the methane bubbles are released in waters
20
that are only a few tens of meters deep, as in the case of melting ice complex per-mafrost in Siberia (Shakhova et al., 2005; Washburn et al., 2005; Xu et al., 2001) or during time periods of lower sea level (Luyendyk et al., 2005). If the rate of methane release is large enough, the rising column of seawater in contact with the bubbles may saturate with methane, or the bubbles can be larger, potentially increasing the escape
25
efficiency to the atmosphere.
BGD
4, 993–1057, 2007 Methane hydrate stability and anthropogenic climate change D. Archer Title Page Abstract Introduction Conclusions References Tables Figures ◭ ◮ ◭ ◮ Back Close Full Screen / EscPrinter-friendly Version Interactive Discussion 2.4.5 Fate of methane hydrate in the water column
Pure methane hydrate is buoyant in seawater, so floating hydrate is another potential way to deliver methane from the sediment to the atmosphere (Brewer et al., 2002). In sandy sediment, the hydrate tends to fill the existing pore structure of the sediment, potentially entraining sufficient sediment to prevent the hydrate / sediment mixture from
5
floating, while in fine-grained sediments, bubble and hydrate grow by fracturing the co-hesion of the sediment, resulting in irregular blobs of bubbles (Boudreau et al., 2005; Gardiner et al., 2003) or pure hydrate. Brewer et al. (2002) and Paull et al. (2003) tried the experiment of stirring surface sediments from Hydrate Ridge using the mechanical arm of a submersible remotely operated vehicle, and found that hydrate did manage
10
to shed its sediment load enough to float. Hydrate pieces of 0.1 m survived a 750 m ascent through the water column. Paull et al. (2003) described a scenario for a subma-rine landslide, in which the hydrates would gradually make their way free of the turbidity current comprised of the sediment/seawater slurry.
2.4.6 Oxidation of dissolved methane in the ocean
15
Methane is unstable to bacterial oxidation in oxic seawater. Rehder et al. (1999) in-ferred an oxidation lifetime of methane in the high-latitude North Atlantic of 50 years. Clark et al. (2000) correlated methane emission from Coal Point in California with a methane maximum in the water column extending into the Pacific Ocean. Methane ox-idation is faster in the deep ocean near a particular methane source where its
concen-20
tration is higher (turnover time 1.5 years), than in the surface ocean (turnover time of decades) (Valentine et al., 2001). Water column concentration and isotopic measure-ments indicate complete water-column oxidation of the released methane at Hydrate Ridge (Grant and Whiticar, 2002; Heeschen et al., 2005).
An oxidation lifetime of 50 years leaves plenty of time for methane gas to evaporate
25
into the atmosphere. Typical gas-exchange time scales for gas evasion from the sur-face ocean would be about 3–5 m per day. A sursur-face mixed layer 100 m deep would
BGD
4, 993–1057, 2007 Methane hydrate stability and anthropogenic climate change D. Archer Title Page Abstract Introduction Conclusions References Tables Figures ◭ ◮ ◭ ◮ Back Close Full Screen / EscPrinter-friendly Version Interactive Discussion approach equilibrium (degas) in about a month. Even a 1000-m thick winter mixed layer
would degas about 30% during a three-month winter window. The ventilation time of subsurface waters depends on the depth and the fluid trajectories in the water (Luyten et al., 1983), but 50 years is enough time that a significant fraction of the methane dissolving from bubbles might reach the atmosphere before it is oxidized.
5
2.5 Stratigraphic-type sedimentary hydrate deposits
The most common hydrate deposits on Earth are in the ocean, and are the product of largely one-dimensional processes of organic carbon burial, bacterial methanogenesis, and methane transport in slow fluid flow. Following the terminology of Milkov (2002), we will refer to these as stratigraphic-type hydrate deposits.
10
In the steady state, the maximum concentration of hydrate is found at the base of the stability zone, with bubbles found below (Davie and Buffett, 2001). Typical con-centrations of hydrate are a few percent of pore volume, and the amount of bubbles below the stability zone is also a few percent by volume. The layer of bubbles is clearly apparent in seismic sections of the subsurface sediment. Temperature contours within
15
the sediment column tend to parallel the sea floor, and so the layer of bubbles tends to parallel the sea floor as well. For this reason, the bubble layer below the base of the stability zone is referred to as a “bottom simulating reflector” or BSR. Because it is remotely detectable, the distribution of the BSR is one of the best indications of the distribution of hydrates in sediments.
20
Most of the hydrate deposits on Earth correspond to the stratigraphic type, and hence the estimates of the global inventory of hydrates are based on the physics or on the ob-served distribution of these types of deposits. Estimates range from 500 to 10 000 Gton C as methane in hydrate globally. The estimates can be compared according to two metrics. One is the area of the sea floor where hydrates can be found, and the other is
25
the inventory of methane, as hydrate and in some tabulations as bubbles, per square meter. Milkov (2004) does a detailed and very thorough comparison of these charac-teristics of estimates, leaving no need for more than a summary of his results here.
BGD
4, 993–1057, 2007 Methane hydrate stability and anthropogenic climate change D. Archer Title Page Abstract Introduction Conclusions References Tables Figures ◭ ◮ ◭ ◮ Back Close Full Screen / EscPrinter-friendly Version Interactive Discussion The first piece of the estimate is the area of the sea floor, between 500 and 3000 m
depth, that has high concentration of hydrates. MacDonald (1990) assumed a high-hydrate slope area fraction of 10%. Borowski et al. (1999) estimate that 30% of this area could contain hydrates, based on the proportion of cores where porewater sulfate reaches zero within 50 m of the sea floor. Milkov (2004) views Borowski’s 30% as
5
an upper limit, and takes 10% as his best estimate of the high-hydrate slope area fraction. The Buffett and Archer (2004) model predicts nonzero column inventories of methane hydrate or bubbles in 16% of the area between 500–3000 m, but in much of that area the abundance of methane is unmeasurably small. (Its presence is of interest thermodynamically, however.) If we take>0.25% over 200 m as a detectability cutoff,
10
the model predicts 13% of the sea floor to fit that definition.
Many studies estimate the area containing hydrates based on the organic carbon concentration of surface sediments. The critical cutoff organic carbon concentration is typically taken as 1% (Kvenvolden, 1999) or 0.5% (Harvey and Huang, 1995), which correspond respectively to about 15% or 30% of the area of sea floor between 500 and
15
3000 m (based on results from the sediment diagenesis model (Archer et al., 2002) used in (Buffett and Archer, 2004). Gornitz and Fung (1994) used high chlorophyll concentrations from CZCS images as correlates to the 0.5–1% organic carbon con-centration in sediments. This assumption neglects the role of depth and oxygen in determining the organic carbon degradation, but the satellite data generates a map
20
that looks very similar to sedimentary organic carbon maps. The areas of the sea floor represented by the CZCS cutoffs was 13% and 32%, similar to the organic carbon ar-eas for>1% and >0.5%. The surface organic carbon method is appealing because
of the general correspondence between surface organic carbon and seismic indica-tions of hydrates below, but there are some caveats. The critical quantity in the Buffett
25
and Archer (2004) model is the advective flux of organic carbon to the methanogene-sis zone, which increases with increasing carbon concentration, but also depends on sedimentation rate, a boundary condition which must be accounted for in some way. Sediment surface organic carbon concentrations neglects the possibility that
BGD
4, 993–1057, 2007 Methane hydrate stability and anthropogenic climate change D. Archer Title Page Abstract Introduction Conclusions References Tables Figures ◭ ◮ ◭ ◮ Back Close Full Screen / EscPrinter-friendly Version Interactive Discussion tions might have changed in the millions of years it takes for surface sediments to be
advected to the methanogenesis zone (Fehn et al., 2000). In spite of these caveats, sediment organic carbon concentrations capture the general trend from oligotrophic to eutrophic, nearshore to pelagic, in the ocean that also drive methane hydrate formation. Another metric by which global methane inventory estimates can be compared is
5
the volume fraction of methane hydrate, within the porewater, averaged over the depth range of the hydrate stability zone. Kvenvolden (1988) assumed 10%. Milkov argues for a value of 1.2%. The Buffett and Archer (2004) predicts about 1.5%. Data from the Blake Ridge range from 2–4% (Borowski, 2004; Paull et al., 2000). Values from Hydrate Ridge are lower, closer to 1%. The current data is probably too sparse to
10
distinguish between 1% and say 3% as a global average hydrate porewater volume fraction, but the 10% volume fraction assumed in earlier studies like the influential Kvenvolden (1988) now seems to be high, if Blake Ridge or Hydrate Ridge is taken to be representative of the broader ocean.
There are two studies, Buffett and Archer (2004), and Klauda and Sandler (2005),
15
based on mechanistic models of the sedimentary methane cycle. Both studies are based on the 1-D column model of Davie and Buffett (2001). The two studies differ in their global estimates by a factor of twenty. Klauda and Sandler (2005) estimate 76 000 Gton C in hydrate, while Buffett and Archer (2004) predict 3000 Gton C in hy-drate (plus 2000 Gton C in bubbles). Both studies show a reasonable fit to data from
20
the Blake Ridge. The difference can be traced to differences in the sediment accu-mulation rate, and carbon conversion efficiencies, by the two studies. The Klauda and Sandler (2005) calculation assumes a uniform accumulation rate of sediment through-out the entire ocean, of 10 cm/yr, too high for the deep sea by an order of magnitude and more. For this reason, the Klauda and Sandler (2005) model predicts that most of
25
the hydrates in the ocean ought to exist in abyssal sediments, rather than restricted to the continental margins, as observed (in seismic studies, for example).
Uncertainty in the areal coverage of methane hydrate sediment results in a factor of three uncertainty in our estimate of the global hydrate reservoir size. The average
BGD
4, 993–1057, 2007 Methane hydrate stability and anthropogenic climate change D. Archer Title Page Abstract Introduction Conclusions References Tables Figures ◭ ◮ ◭ ◮ Back Close Full Screen / EscPrinter-friendly Version Interactive Discussion drate fraction is also unknown to within a factor of three, resulting in perhaps a factor of
ten overall. A potential range of hydrate inventories must span about 500–3000 Gton C, with the inclusion of bubble methane adding perhaps a similar amount. The uncertainty range will be reduced in the future by (1) improvement in techniques for estimating the concentration of methane, both as hydrate and as bubbles, ideally by seismic methods
5
that provide regional coverage, and (2) by continued deep core sampling within hydrate regions, to constrain the variability in methane concentrations.
For comparison, the inventory of fossil fuels, mostly coal, is thought to be about 5000 Gton C (Rogner, 1997), comparable to the hydrate reservoir. The inventory of dissolved oxidized carbon in the ocean (CO2, HCO−3, and CO
=
3) is about 38 000 Gton
10
C. This sounds comfortably larger than the hydrate reservoir, but an addition of CO2 of this magnitude on a fast time scale would be a sizable perturbation to the pH of the ocean (Archer et al., 1997). The ocean contains about 2× 10¹⁷moles of oxygen, which could be completely depleted by reaction with about 1000 Gton C in methane.
2.6 Structural-type sedimentary hydrate deposits
15
In stratographic-type hydrate deposits, hydrate concentration is highest near the base of the stability zone, often hundreds of meters below the sea floor. In shallower wa-ters, where the stability zone is thinner, models predict smaller inventories of hydrate. Therefore, most of the hydrates in stratographic-type deposits tend to be deep. In con-trast with this, in a few parts of the world, transport of presumably gaseous methane
20
through faults or permeable channels, results in hydrate deposits that are abundant at shallow depths in the sediment column, closer to the sea floor. These “structural-type” deposits could be vulnerable to temperature-change driven melting on a faster time scale than the stratographic deposits are expected to be.
The Gulf of Mexico is basically a leaky oil field (MacDonald et al., 1994, 2002, 2004;
25
Milkov and Sassen, 2000, 2001, 2003; Sassen et al., 2001a, 2003; Sassen and Mac-Donald, 1994). Natural oil seeps leave slicks on the sea surface that can be seen from space. Large chunks of methane hydrate have been found on the sea floor in
BGD
4, 993–1057, 2007 Methane hydrate stability and anthropogenic climate change D. Archer Title Page Abstract Introduction Conclusions References Tables Figures ◭ ◮ ◭ ◮ Back Close Full Screen / EscPrinter-friendly Version Interactive Discussion contact with seawater (Macdonald et al., 1994). One of the three chunks they saw
had vanished when they returned a year later; presumably it had detached and floated away.
Collett and Kuuskraa (1998) estimate that 500 Gton C might reside as hydrates in the Gulf sediments, but Milkov (2001) estimates only 5 Gton C. In the CCSM model
5
under doubled CO2 (after 80 years of 1%/year CO2 increase, from C. Bitz, personal
communication), waters at 500 m depth in the Gulf warm about 0.75◦C, and 0.2◦ at
1000 m. In situ temperatures at 500 m are much closer to the melting temperature, so the relative change in the saturation state is much more significant at 500 m than deeper. The equilibrium temperature change in the deep ocean to a large, 5000 Gton
10
C fossil fuel release could be 3◦C (Archer et al., 2004). Milkov and Sassen (2003)
sub-jected a 2-dimensional model of the hydrate deposits in the Gulf to a 4◦C temperature
increase and predicted that 2 Gton C from hydrate would melt. However, there no ob-servations to suggest that methane emission rates are currently accelerating. Sassen et al. (2001b) find no molecular fractionation of gases in near-surface hydrate deposits
15
that would be indicative of partial dissolution, and suggests that the reservoir may in fact be growing.
Other examples of structural deposits include the summit of Hydrate Ridge (Torres et al., 2004; Trehu et al., 2004b) and the Niger Delta (Brooks et al., 2000). The distribution of hydrate at Hydrate Ridge indicates up-dip flow along sand layers (Weinberger et al.,
20
2005). Gas is forced into sandy layers where it accumulates until the gas pressure forces it to vent to the surface (Trehu et al., 2004a). Trehu et al. (2004b) estimate that 30–40% of pore space in occupied by hydrate, while gas fractions are 2–4%. Methane emerges to the sea floor with bubble vents and subsurface flows of 1 m/s, and in regions with bacterial mats and vesicomyid clams (Torres et al., 2002). Further examples of
25
structural deposits include the Peru Margin (Pecher et al., 2001) and Nankai Trough (Nouze et al., 2004).
BGD
4, 993–1057, 2007 Methane hydrate stability and anthropogenic climate change D. Archer Title Page Abstract Introduction Conclusions References Tables Figures ◭ ◮ ◭ ◮ Back Close Full Screen / EscPrinter-friendly Version Interactive Discussion 2.6.1 Mud volcanos
As described above, mud volcanos are produced by focused upward fluid flow into the ocean. Mud volcanos often trap methane in hydrate deposits that encircle the chan-nels of fluid flow (Milkov, 2000; Milkov et al., 2004). The fluid flow chanchan-nels associated with mud volcanoes are ringed with the seismic images of hydrate deposits, with
au-5
thigenic carbonates, and with pockmarks (Dimitrov and Woodside, 2003) indicative of anoxic methane oxidation. Milkov (2000) estimates that mud volcanoes contain at most 0.5 Gton C of methane in hydrate; about 100 times his estimate of the annual supply. 2.7 Land deposits
The term permafrost is intended to distinguish whether water is frozen, but it is defined
10
in terms of temperature: a two-year mean annual temperature below 0◦C. It has been
estimated that permafrost covers 20% of the terrestrial surface of the Earth. High-latitude northern permafrost is observed to be warming (Smith et al., 2005) and thaw-ing (Camill, 2005; Payette et al., 2004). Ice near the surface can melt in the summer, in what is called the “active zone”. Observations show that the active zone is getting
15
thicker (Sazonova et al., 2004). When surface ice melts, soils collapse in a process called thermokarst (Nelson et al., 2002), and buildings fall down (Stockstad, 2004). This process has had a dizzying impact on the subarctic landscape (Kolbert, 2005; Pearce, 2005; Stockstad, 2004). Model projects 30–40% increase in active zone thick-ness by 2100 (Stendel and Christensen, 2002), and a comparable decrease in the total
20
area of permafrost soils (Anisimov and Nelson, 1996). Melting is projected to be most intense in the marginal permafrost zone in the south (Anisimov and Nelson, 1996) and along the Arctic ocean (Nelson et al., 2002).
BGD
4, 993–1057, 2007 Methane hydrate stability and anthropogenic climate change D. Archer Title Page Abstract Introduction Conclusions References Tables Figures ◭ ◮ ◭ ◮ Back Close Full Screen / EscPrinter-friendly Version Interactive Discussion 2.7.1 Peat decomposition
Permafrost soils contain relict organic matter which survived decomposition because of the freezing temperatures. Fossil mammoths, still edible after all these years, are examples of this phenomenon (Herz, 1904). Peat deposits are a substantial reservoir of carbon, are estimated to be 350–450 Gton C (Stockstad, 2004). With a thaw will
5
come accelerated decomposition of this organic matter, increasing the flux of CO2
and CH4 (Liblik et al., 1997; Rivkina et al., 2004; Rivkina et al., 2000). Soil that has been frozen for thousands of years still contains viable populations of methanotrophic bacteria (Rivkina et al., 2004). The flux of methane from peat soils to the atmosphere also depends on the location of the water table, which controls the thickness of the oxic
10
zone (Bubier et al., 1995, 2005; Liblik et al., 1997).
If 20% of the peat reservoir converted to methane, released over 100 years, this would release 0.7 Gton C per year, doubling the atmospheric methane concentration. 2.7.2 Melting hydrates
There is also the possibility that methane is trapped in hydrate deposits, and might
15
potentially be released upon melting of the permafrost. Permafrost soil need not nec-essarily be continuous filled ice, it must simply be below the freezing point of pure water. If the pores are open, in contact with the atmosphere, the pressure in the pore spaces will be hydrostatic with the fluid being the atmosphere. In this case, it will be virtually impossible to achieve high enough pressures of methane to form hydrates
un-20
der any reasonable temperature. However, if the pore space is closed, sealed, by ice most likely, then the lithostatic pressure will come to bear on the pore spaces, and any region of high-purity methane in the gas phase will be stable for hydrates. Minable nat-ural gas deposits are often at high pressure, for this reason. The Messoyakh gas field, producing gas for 13 years in Western Siberia, is thought to be mostly hydrate (Krason,
25
2000). A profile of permafrost from the Mackenzie Delta showed massive, visible hy-drate at ∼350 m, and inferred invisible pore-water hyhy-drate crystals as shallow as about
BGD
4, 993–1057, 2007 Methane hydrate stability and anthropogenic climate change D. Archer Title Page Abstract Introduction Conclusions References Tables Figures ◭ ◮ ◭ ◮ Back Close Full Screen / EscPrinter-friendly Version Interactive Discussion 120 m, in solidly ice-bonded sediment (Dallimore and Collett, 1995). The stability zone
is below ∼250 m here. Total amounts of hydrate methane in permafrost soils are very poorly known, with estimates ranging from 7.5 to 400 Gton C (estimates compiled by (Gornitz and Fung, 1994).
There is a special case called the ice complex in Siberia (Gavrilov et al., 2003;
Hub-5
berten and Romanovskii, 2001; Romankevich, 1984). The ice complex is a sealed horizon of ice that was formed when sea level was as much as 120 m lower than today, during the last glacial maximum. Liquid ground water flowing through the permafrost froze, creating a sealed layer up to 60–80 m thick, onshore and offshore under as much as 100 m water depth. Bottom water temperatures are near freezing in these locations,
10
and so they currently do not provide much impetus to melt at the surface, although surface melting may accelerate with future high-latitude warming. However, 0◦C is
considerably warmer than surface air temperatures during glacial time. A geotherm projected down from 0◦C intersects the melting temperature at a much shallower depth
than would a geotherm from a glacial surface temperature. For this reason, most of
15
the melting of the submerged ice complex since deglaciation has been on the bottom of the ice, not on the top.
Melting is also driven by lateral invasion of the coastline, a melt-erosion process called thermokarst erosion (Gavrilov et al., 2003). The ice melts where it is exposed to the ocean along the coast, collapsing the land into the sea and leaving more ice
20
exposed to melting. The Siberian coast has receded by 100–500 km in 7500 years (Hubberten and Romanovskii, 2001), after the sea level finished its deglacial rise (see Fig. 6 in Hubberten and Romanovskii, 2001). Entire islands have melted within his-torical times in the past centuries (Romankevich, 1984). Emission of hydrate-melt methane has been documented along the Siberian coastline. Coastal melting has
re-25
sulted in 2500% supersaturation concentrations of methane relative to the atmosphere in Siberian shelf waters (Shakhova et al., 2005). Two surveys of methane concentra-tion, taken 1 year apart, differed in their methane inventory by a factor of five. Whether this difference is due to differences in water circulation or methane degassing is
BGD
4, 993–1057, 2007 Methane hydrate stability and anthropogenic climate change D. Archer Title Page Abstract Introduction Conclusions References Tables Figures ◭ ◮ ◭ ◮ Back Close Full Screen / EscPrinter-friendly Version Interactive Discussion known. Surface waters over the North Slope of Alaska were similarly supersaturated
(Kvenvolden, 1999). The potential for methane release to the environment from per-mafrost hydrate melting has not been extensively discussed, but given the magnitude of the potential hydrate reservoir, and the long time scale for melting, one could imag-ine a chronic, ongoing release of methane that would rival the release of methane from
5
decomposing peat (Table 1). 2.8 Hydrates as fossil fuel
Another pathway by which hydrate carbon might reach the atmosphere to affect climate is if it is combusted as a fossil fuel. Estimates of the total inventory of methane in hy-drate deposits globally are very high, but probably only a small fraction of the hyhy-drate
10
reservoir would be extractable (Milkov and Sassen, 2002). The largest methane reser-voir, the stratographic disseminated deposit, is the least attractive economically. The concentration of methane is generally too low for economical extraction. The sediments of the Blake Ridge are impermeable (Kvenvolden, 1999), making extraction even more unlikely, while sediments in the Nankia Trough are more permeable and hence easier
15
to extract (Milkov and Sassen, 2002), which the Japanese intend to do (Kerr, 2004). The other class of oceanic deposits is the structurally focused deposits, such as found in the Gulf of Mexico (Milkov and Sassen) and mud volcanos (Milkov, 2000). Milkov and Sassen (2001) estimates that the Gulf of Mexico contains 40 times as much hydrate methane as conventional subsurface reservoir methane in that area.
20
The most likely near-term targets for methane hydrate extraction are deposits associ-ated with permafrost soils on land and in the shallow ocean. The Soviets drilled at least 50 wells in a field called Messoyakha, in which thermogenic methane is trapped under a dome of 450-m thick permafrost, one-third of it frozen into hydrates (Krason, 2000). The Soviets extracted gas from Messoyakha for 13 years, injecting hot water and/or
so-25
lutes (methanol and CaCl2) to destabilize hydrate and release methane. Subsequently,
an international consortium lead by the Japanese drilled a series of wells on the north coast of Alaska, in a field called Mallik (Chatti et al., 2005; Kerr, 2004). Hydrates here
BGD
4, 993–1057, 2007 Methane hydrate stability and anthropogenic climate change D. Archer Title Page Abstract Introduction Conclusions References Tables Figures ◭ ◮ ◭ ◮ Back Close Full Screen / EscPrinter-friendly Version Interactive Discussion are in a sandstone layer 1000 m down, below mudstones. The hydrate-bearing
sed-iments were more permeable there than had been expected so that methane could be extracted most economically by simply reducing the pressure. Methane moved via fractures, and more fractures could be broken with pressure spiking.
The prognosis for methane hydrate mining is that perhaps hydrate methane could
5
supply order 10% of methane extration rate in order 10 years, by analogy to coal-bed methane 30 years ago (Grauls, 2001; Kerr, 2004). Methane hydrates could be a significant source of fossil energy, but not limitless as might be inferred from the large estimates of total methane inventory in the global hydrate reservoir. Most of the hydrates are probably impractical to extract.
10
The possibility of geological hazard from methane drilling has been discussed in a general way (Chatti et al., 2005; Grauls, 2001; Kvenvolden, 1999) but the likelihood of methane extraction causing slope instability still seems rather speculative. Some have considered replacing CH4 hydrates with CO2 hydrates, sequestering CO2 and maintaining the stability of the continental slope in the process (Warzinski and Holder,
15
1998). The Storegga slide (next section) was investigated in order to determine the safety of extracting gas from the Ormen Lange gas field within the Storegga slide area.
3 Observations from the past
3.1 The Storegga landslide 3.1.1 Observations
20
One of the largest exposed submarine landslides in the ocean is the Storegga Slide in the Norwegian continental margin (Bryn et al., 2005; Mienert et al., 2000, 2005]. The slide excavated on average the top 250 m of sediment over an swath hundreds of kilometers wide, stretching half-way from Norway to Greenland. There have been comparable slides on the Norwegian margin every approximately 100 kyr, roughly
syn-25
BGD
4, 993–1057, 2007 Methane hydrate stability and anthropogenic climate change D. Archer Title Page Abstract Introduction Conclusions References Tables Figures ◭ ◮ ◭ ◮ Back Close Full Screen / EscPrinter-friendly Version Interactive Discussion chronous with the glacial cycles (Solheim et al., 2005). The last one, Storegga proper,
occurred about 8150 years ago, after deglaciation. It generated a tsunami in what is now the United Kingdom (Smith et al., 2004). The Storegga slide area contains methane hydrate deposits as indicated by a seismic BSR (Bunz and Mienert, 2004; Mienert et al., 2005; Zillmer et al., 2005a, b) corresponding to the base of the HSZ at
5
200–300 m, and pockmarks (Hovland et al., 2005) indicating gas expulsion from the sediment.
3.1.2 Inferences
The slide was presumably triggered by an Earthquake, but the sediment column must have been destabilized by either or both of two mechanisms. One is the rapid
accu-10
mulation of glacial sediment shed by the Fennoscandian ice sheet (Bryn et al., 2005). As explained above, rapid sediment loading traps pore water in the sediment column faster than it can be expelled by the increasing sediment load. At some point, the sedi-ment column floats in its own porewater (Dugan and Flemings, 2000). This mechanism has the capacity to explain why the Norwegian continental margin, of all places in the
15
world, should have landslides synchronous with climate change.
The other possibility is the dissociation of methane hydrate deposits by rising ocean temperatures. Rising sea level is also a player in this story, but a smaller one. Rising sea level tends to increase the thickness of the stability zone, by increasing the pres-sure. A model of the stability zone shows this effect dominating for deeper in the water
20
column (Vogt and Jung, 2002); the stability zone is shown increasing by about 10 m for sediments in water depth below about 750 m. Shallower sediments are more impacted by long-term temperature changes, reconstructions of which show warming of 5–6◦C
over a thousand years or so, 11–12 kyr ago. The landslide occurred 2–3 kyr after the warming (Fig. 6 from Mienert et al., 2005). The slide started at a few hundred meters
25
water depth, just off the continental slope, just where Mienert calculates the maximum change in HSZ. Sultan et al. (2004) predict that warming in the near-surface sediment would provoke hydrate to dissolve by increasing the saturation methane concentration.
BGD
4, 993–1057, 2007 Methane hydrate stability and anthropogenic climate change D. Archer Title Page Abstract Introduction Conclusions References Tables Figures ◭ ◮ ◭ ◮ Back Close Full Screen / EscPrinter-friendly Version Interactive Discussion This form of dissolution differs from heat-driven direct melting, however, in that it
pro-duces dissolved methane, rather than methane bubbles. Sultan et al. (2004) assert that melting to dissolved methane increases the volume, although laboratory analyses of volume changes upon this form of melting are equivocal, an in any case the volume changes are much smaller than for thermal melting that produces bubbles.
5
The amount of methane released by the slide can be estimated from the volume of the slide and the potential hydrate content. Hydrate just outside the slide area has been estimated by seismic methods to fill as much as 10% of the pore water volume, in a layer about 50 m thick near the bottom of the stability zone (Bunz and Mienert, 2004). If these results were typical of the entire 104km2 area of the slide, the slide
10
could have released 1–2 Gton C of methane in hydrate. Paul (1978) assumed 10% hydrate fraction and predicted 5 Gton C methane released. If 5 Gton C CH4reached the
atmosphere all at once, it would raise the atmospheric concentration by about 2.5 ppm of methane, relative to a present-day concentration of about 1.7 ppm, trapping about 0.2 W/m2of greenhouse heat. The methane radiative forcing would subside over a time
15
scale of a decade or so, as the pulse of released methane is oxidized to CO2, and the
atmospheric methane concentration relaxes toward the long-term steady state value. The radiative impact of the Storegga landslide would then be comparable in magnitude but opposite in sign to the eruption of a large volcano, such as the Mt. Pinatubo eruption (–2 W/m2), but it would last for longer (10 years for methane and 2 for a volcano).
20
It is tantalizing to a paleoclimatologist to wonder if there could be any connection between the Storegga landslide and the 8.2 kyr climate event (Alley and Agustsdottir, 2005), which is presumed to have been triggered by fresh water release to the North Atlantic. However, ice cores record a 0.75 ppm drop in methane concentration during the 8.2 k event, not a rise. The shutdown of convection in the North Atlantic would
25
have, if anything, cooled the overlying waters.