HAL Id: hal-00301957
https://hal.archives-ouvertes.fr/hal-00301957
Submitted on 13 Jul 2006HAL is a multi-disciplinary open access
archive for the deposit and dissemination of sci-entific research documents, whether they are pub-lished or not. The documents may come from teaching and research institutions in France or abroad, or from public or private research centers.
L’archive ouverte pluridisciplinaire HAL, est destinée au dépôt et à la diffusion de documents scientifiques de niveau recherche, publiés ou non, émanant des établissements d’enseignement et de recherche français ou étrangers, des laboratoires publics ou privés.
The contribution of anthropogenic bromine emissions to
past stratospheric ozone trends: a modelling study
B.-M. Sinnhuber, N. Sheode, M. Sinnhuber, M. P. Chipperfield, W. Feng
To cite this version:
B.-M. Sinnhuber, N. Sheode, M. Sinnhuber, M. P. Chipperfield, W. Feng. The contribution of an-thropogenic bromine emissions to past stratospheric ozone trends: a modelling study. Atmospheric Chemistry and Physics Discussions, European Geosciences Union, 2006, 6 (4), pp.6497-6524. �hal-00301957�
ACPD
6, 6497–6524, 2006 The contribution of bromine to stratospheric ozone trends B.-M. Sinnhuber et al. Title Page Abstract Introduction Conclusions References Tables Figures J I J I Back CloseFull Screen / Esc
Printer-friendly Version Interactive Discussion
Atmos. Chem. Phys. Discuss., 6, 6497–6524, 2006 www.atmos-chem-phys-discuss.net/6/6497/2006/ © Author(s) 2006. This work is licensed
under a Creative Commons License.
Atmospheric Chemistry and Physics Discussions
The contribution of anthropogenic
bromine emissions to past stratospheric
ozone trends: a modelling study
B.-M. Sinnhuber1, N. Sheode1, M. Sinnhuber1, M. P. Chipperfield2, and W. Feng2
1
Institute of Environmental Physics, University of Bremen, Bremen, Germany
2
School of Earth and Environment, University of Leeds, Leeds, UK
Received: 17 May 2006 – Accepted: 6 June 2006 – Published: 13 July 2006 Correspondence to: B.-M. Sinnhuber ([email protected])
ACPD
6, 6497–6524, 2006 The contribution of bromine to stratospheric ozone trends B.-M. Sinnhuber et al. Title Page Abstract Introduction Conclusions References Tables Figures J I J I Back CloseFull Screen / Esc
Printer-friendly Version Interactive Discussion Abstract
Bromine compounds play an important role in the depletion of stratospheric ozone. We have calculated the changes in stratospheric ozone in response to changes in the halogen loading over the past decades, using a two-dimensional (latitude/height) model constrained by source gas mixing ratios at the surface. Model calculations of the 5
decrease of total column ozone since 1980 agree reasonably well with observed ozone trends, in particular when the contribution from very short-lived bromine compounds is included. Model calculations with bromine source gas mixing ratios fixed at 1959 levels, corresponding approximately to a situation with no anthropogenic bromine emissions, show an ozone column reduction between 1980 and 2005 at northern hemisphere mid-10
latitudes of only ≈55% compared to a model run including all halogen source gases. In this sense anthropogenic bromine emissions are responsible for ≈45% of the model estimated column ozone loss at northern hemisphere mid-latitudes. The chemical ef-ficiency of bromine relative to chlorine for global total ozone depletion from our model calculations, expressed by the so called α-factor, is about 73 on an annual average. 15
This value is much higher than previously published results. Updates in reaction rate constants can explain only part of the differences in α. The inclusion of bromine from very short-lived source gases has only a minor effect on the global mean α-factor.
1 Introduction
Bromine compounds play an important role in the depletion of stratospheric ozone 20
(World Meteorological Organization, 2003). Anthropogenic emissions of bromine containing source gases have resulted in more than a doubling of the atmospheric bromine loading from methyl bromide and the halons between 1980 and the late 1990s (Montzka et al.,2003). There is now a lot of evidence that also short-lived bromine com-pounds, mainly of natural origin, contribute significantly to the stratospheric bromine 25
loading (e.g., Pfeilsticker et al., 2000;Sinnhuber et al.,2002, 2005; Schofield et al., 6498
ACPD
6, 6497–6524, 2006 The contribution of bromine to stratospheric ozone trends B.-M. Sinnhuber et al. Title Page Abstract Introduction Conclusions References Tables Figures J I J I Back CloseFull Screen / Esc
Printer-friendly Version Interactive Discussion
2004; Salawitch et al., 2005). Bromine from short-lived compounds may have con-tributed to the stratospheric ozone decrease even if there is no trend in the contribution from short-lived compounds due to the coupling between bromine and chlorine contain-ing catalytic ozone loss cycles.Salawitch et al.(2005) have shown that a few parts per trillion by volume (pptv) of additional bromine from short-lived compounds can result in 5
a significantly larger calculated downward ozone trend, resulting in a better agreement between modelled and observed ozone trends. Recently, Feng et al. (2006) used a three-dimensional (3-D) chemical transport model to investigate the impact of an en-hanced bromine loading due to short-lived species on stratospheric ozone. They found that for an additional 5 pptv of bromine from short-lived species mid-latitude column 10
ozone decreases by about 10 Dobson units (DU) but the impact on ozone trends is small, except for periods of enhanced aerosol loading following large volcanic erup-tions.
Here we now address the converse question: by how much have anthropogenic bromine emissions contributed to the decrease of stratospheric ozone over the past 15
decades, taking into account the additional background of bromine from short-lived compounds. We do this by performing a set of calculations with a two-dimensional (2-D) model with interactive chemistry, radiation and transport. The model calculations shown here are part of a set of model runs we performed in support of the upcoming 2006 WMO/UNEP Ozone Assessment. Here we show a set of transient model calcu-20
lations over the past decades with different bromine source gas scenarios employed, as well as results from a set of sensitivity runs that allow us to specify the relative e ffec-tiveness of bromine compared to chlorine for stratospheric ozone depletion. Ultimately one would wish to perform this kind of calculations with coupled 3-D chemistry-climate-models due to their better representation of dynamics and transport. In particular, 3-D 25
models will have a better representation of the interaction of transport and chemistry in the high-latitude stratosphere where spring-time ozone loss is due to combined chlo-rine and bromine chemistry, and they will provide a much more realistic description of the changes in dynamics and transport as a result of changing concentrations of
ACPD
6, 6497–6524, 2006 The contribution of bromine to stratospheric ozone trends B.-M. Sinnhuber et al. Title Page Abstract Introduction Conclusions References Tables Figures J I J I Back CloseFull Screen / Esc
Printer-friendly Version Interactive Discussion
greenhouse gases. However, 3-D chemistry-climate-models are computationally very expensive, compared to 2-D models, and are just beginning to become available for assessment studies. Consequently, past WMO/UNEP Ozone Assessments have re-lied largely on the results of 2-D models and the upcoming 2006 WMO/UNEP Ozone Assessment will still make use of results from these models.
5
2 Model and source gas scenarios
The model used in this study is the 2-D transport, chemistry and radiation model most recently described by Chipperfield and Feng (2003). It uses the dynamical core of the so called “two-and-a-half-dimensional” THINAIR model (Kinnersley,1996) together with the chemistry scheme from the SLIMCAT model (Chipperfield,1999). It extends 10
from the ground to about 100 km altitude with a vertical resolution of about 3.5 km and a horizontal resolution of 9.5◦. The stratospheric dynamics are forced by the ampli-tudes of waves 1 to 3 of the Montgomery potential at the 380 K isentrope (essentially the same as the amplitudes of the 100 hPa geopotential waves). Here we use the daily Montgomery potential from meteorological analyses with a repeating annual cycle for 15
the period of May 1980 to April 1981. There is no quasi biennial oscillation (QBO) in the model, i.e., the modelled tropical stratospheric wind is always in a weak easterly state. Kinnersley(1998) andKinnersley and Tung (1998) showed by using a different version of this model that inclusion of the interannual variability of extratropical plan-etary wave activity as well as inclusion of the equatorial QBO led to an interannual 20
variability of ozone that resembled many features of the observed interannual vari-ability. As we have used no interannual variability in the dynamical forcing here, all interannual variability comes from changes in the source gases and aerosol surface area. Stratospheric temperatures, dynamics and transport are calculated interactively using the modelled concentrations of the radiatively active gases ozone (O3), carbon 25
dioxide (CO2), methane (CH4), nitrous oxide (N2O), and nitrogen dioxide (NO2). Sur-face temperatures follow a specified annual cycle and are held constant during the
ACPD
6, 6497–6524, 2006 The contribution of bromine to stratospheric ozone trends B.-M. Sinnhuber et al. Title Page Abstract Introduction Conclusions References Tables Figures J I J I Back CloseFull Screen / Esc
Printer-friendly Version Interactive Discussion
model integrations.
Source gas surface mixing ratios and the stratospheric aerosol surface area were specified according to the WMO/UNEP model scenario. The aerosol surface area density was calculated from measurements by the SAGE I, SAGE II, SAM II, and SME satellite instruments (D. B. Considine, personal communication, 2005). Reaction 5
rate constants and photolysis cross sections are taken from a preliminary version of the JPL-05 recommendations provided for the 2006 WMO/UNEP Ozone Assessment which is an update of the JPL-02 recommendations (Sander et al.,2002).
Although we calculate chemistry down to the surface, there is no detailed tropo-spheric chemistry included in the model calculations presented here. This – together 10
with the fact that tropospheric transport processes are highly simplified in a 2-D model – means that modelled changes in tropospheric ozone will probably not be realistic.
Figure 1 shows the chlorine and bromine loading from the specified scenario. An-thropogenic emissions have led to a large increase of bromine over the past about 25 years. The bromine loading due to methyl bromide (CH3Br), Halon-1301 (CBrF3), 15
and Halon-1211 (CBrClF2) have increased by about 7 pptv between 1980 and 2005, compared to an increase of the chlorine loading by about 1000 pptv over the same period. Note that in accord with the 2006 WMO/UNEP Ozone Assessment scenario no other halons than Halon-1301 and Halon-1211 are considered here. Halon-2402 (CBrF2CBrF2) has increased from less than 0.1 pptv in the late 1970s to more than 20
0.4 pptv by the end of the 1990s (World Meteorological Organization,2003); the con-tribution from Halon-1202 (CBr2F2) on the other hand is probably very small. I.e., the specified scenario probably underestimates the peak contribution of bromine from an-thropogenic emissions by about 1 pptv (about 10–15%).
As mentioned above, there is now a lot of evidence that short-lived bromine source 25
gases, mainly from natural sources, are contributing to the stratospheric bromine load-ing. Measurements of bromine monoxide (BrO) in the stratosphere suggest that the current total stratospheric bromine loading is somewhere around 21 pptv (Pfeilsticker et al.,2000;Sinnhuber et al.,2002,2005;Salawitch et al.,2005), indicating that there
ACPD
6, 6497–6524, 2006 The contribution of bromine to stratospheric ozone trends B.-M. Sinnhuber et al. Title Page Abstract Introduction Conclusions References Tables Figures J I J I Back CloseFull Screen / Esc
Printer-friendly Version Interactive Discussion
must be a contribution from short-lived gases to the stratospheric bromine loading (ei-ther by direct source gas injection or by product gas injection) of the order of 5 to 6 pptv. The exact contribution of the very short-lived gases to the total bromine loading in the real atmosphere is still unclear at present. Although the individual values for the in-ferred bromine loading differ considerably between the individual studies, a contribution 5
of 5 to 6 pptv from short-lived source gases appears to be the most likely value taking into account the quoted uncertainties from the individual studies. Following the recom-mendations for a sensitivity calculation of the impact of short-lived bromine compounds on ozone trends as part of the 2006 WMO/UNEP Ozone Assessment (R. Salawitch et al., personal communication, 2005), we have also considered a scenario with addi-10
tional bromine from the two short-lived compounds methylene bromide (CH2Br2) and bromoform (CHBr3). Tropospheric washout of inorganic bromine was switched off in these sensitivity runs to allow all bromine from the two short-lived compounds to enter the stratosphere. The surface mixing ratio of CH2Br2was set to 1 pptv, i.e., contributing to the stratospheric bromine loading by 2 pptv. This is in reasonable agreement with 15
the measurements of CH2Br2in the stratosphere by Wamsley et al. (1998). The sur-face mixing ratio of bromoform was specified at 1.33 pptv, resulting in a contribution of bromoform to the stratospheric bromine loading of 4 pptv. This value is at the high end of previous estimates. The modelling studies ofDvortsov et al.(1999) andNielsen and Douglass (2001) both suggested that bromoform may contribute about 1 pptv to the 20
stratosphere. Sinnhuber and Folkins(2006) estimated that bromoform may contribute between about 0.5 and 3 pptv to stratospheric bromine, depending on the rate and mechanism of removal of bromoform’s degradation products in the troposphere and tropopause layer. Since very little is known about possible trends in the contribution of the short-lived bromine compounds to the stratospheric bromine loading we have 25
assumed a constant contribution of 6 pptv here.
Three transient model calculations were performed that differed in the specified bromine source gas scenario: (a) A base run that includes the contribution due to CH3Br, Halon-1301, and Halon-1211, (b) one model run that includes additional 6 pptv
ACPD
6, 6497–6524, 2006 The contribution of bromine to stratospheric ozone trends B.-M. Sinnhuber et al. Title Page Abstract Introduction Conclusions References Tables Figures J I J I Back CloseFull Screen / Esc
Printer-friendly Version Interactive Discussion
of bromine due to CH2Br2 and CHBr3 and (c) one model run that includes the addi-tional 6 pptv of bromine from short-lived compounds but keeps the bromine loading fixed at 1959 levels, i.e., without anthropogenic bromine emissions. These transient model runs were initialized in 1959 and integrated until the year 2100. However, here we will only focus on the period between 1980 and 2005. This is the period were most 5
of the increase in bromine due to anthropogenic emissions occurred and it coincides with the period over which satellite measurements of global ozone are available.
In addition we performed a set of sensitivity calculations to estimate the ozone loss effectiveness of bromine relative to chlorine, following as closely as possible the methodology described by Daniel et al.(1999). For these sensitivity calculations the 10
model was integrated over 11 years starting from 1998 conditions with fixed source gas concentrations. Only the last year of these 11-year integrations was then used for the analyses.
3 Results and discussion
3.1 The contribution of bromine to ozone trends 15
Figure 2 shows the evolution of total ozone at northern hemisphere mid-latitudes (30◦N–60◦N) for three model runs: the base run, the run with enhanced bromine from short-lived compounds and the model run with fixed 1959 bromine loading (i.e., “no anthropogenic bromine”). Shown are the changes of the annual mean ozone columns relative to the 1980 annual mean. For comparison also the evolution from observa-20
tions of the merged Total Ozone Mapping Spectrometer (TOMS) / Solar Backscatter Ultraviolet (SBUV) data set is shown. The merged TOMS/SBUV total ozone data set is from Version 8, Revision 02, available from the NASA Goddard Space Flight Center (http://code916.gsfc.nasa.gov/Data services/merged).
At northern hemisphere mid-latitudes the model shows a decrease of total ozone of 25
about 3% between 1980 and 2005, with the evolution of total ozone agreeing generally 6503
ACPD
6, 6497–6524, 2006 The contribution of bromine to stratospheric ozone trends B.-M. Sinnhuber et al. Title Page Abstract Introduction Conclusions References Tables Figures J I J I Back CloseFull Screen / Esc
Printer-friendly Version Interactive Discussion
well with the TOMS observations. The model run with enhanced bromine due to short-lived compounds leads to an increased downward ozone trend, in agreement with the model calculations ofSalawitch et al.(2005). The model shows a slow increase in total ozone since the late 1990s as a result of the slight reductions in the specified chlorine and bromine loading. The question if and when ozone will recover to its pre-1980 levels 5
will also critically depend on the increase of greenhouse gases during the next decades (Chipperfield and Feng,2003).
Both model and observations show the largest ozone reductions in the years 1992 and 1993, as a result of the increased aerosol surface area following the eruption of the Mt. Pinatubo volcano in June 1991. For this period with enhanced aerosol 10
surface area there is also the largest difference found between the model runs with and without additional bromine from short-lived compounds. Although the model calculation with enhanced bromine loading agrees in general better with the observations, the model still underestimates the magnitude of the observed ozone reduction in 1993. Part of the ozone reductions in 1993 may have resulted from changes in dynamics 15
and transport (e.g.,Hadjinicoaou et al., 1997) not captured by our model. Similarly, the increase of observed total ozone after the mid-1990s may be partly the result of changes in dynamics and transport as a result of increases in the planetary wave activity (Dhomse et al.,2006). An interesting question here is whether the eruption of Mt. Pinatubo may have injected additional bromine into the stratosphere. BrO has been 20
observed in volcanic plumes (Bobrowski et al.,2003) and it has been suggested that the eruption of Mt. Pinatubo in 1991 could have been an important source of bromine to the stratosphere (Bureau et al.,2000). However, there are currently no indications for a significant increase in the stratospheric bromine loading following the Mt. Pinatubo eruption in 1991, so this issue remains speculative at present.
25
The model run with fixed 1959 bromine loading (“no anthropogenic bromine”) shows a much smaller downward ozone trend and a more rapid increase of ozone over the past years. For 2005 the modelled ozone loss without anthropogenic bromine is only about 55% of the total modelled loss at northern hemisphere mid-latitudes. In this
ACPD
6, 6497–6524, 2006 The contribution of bromine to stratospheric ozone trends B.-M. Sinnhuber et al. Title Page Abstract Introduction Conclusions References Tables Figures J I J I Back CloseFull Screen / Esc
Printer-friendly Version Interactive Discussion
sense, anthropogenic bromine emissions are responsible for ≈45% of the modelled column ozone loss at northern hemisphere mid-latitudes. (Note that since a large frac-tion of the bromine induced ozone loss is due to the combined BrO/ClO catalytic cycle (e.g.Daniel et al.,1999), the effect of bromine would have been smaller in the absence of anthropogenic chlorine emissions.) Although the increase in the total bromine load-5
ing was only about 1/140 that of the increase in the total chlorine loading over the period 1980 to 2005 (about 7 pptv compared to about 1000 pptv, respectively), includ-ing the bromine increase nearly doubled the modelled downward ozone trend. This means that on a per molecule basis bromine is about a hundred times more effective in destroying ozone at northern hemisphere mid-latitudes. This effectiveness results 10
partly from the quicker release of bromine from its source gases as compared to chlo-rine and partly from the greater chemical effectiveness (as expressed by the so-called
α factor). We discuss this in more detail in Sect.3.2below.
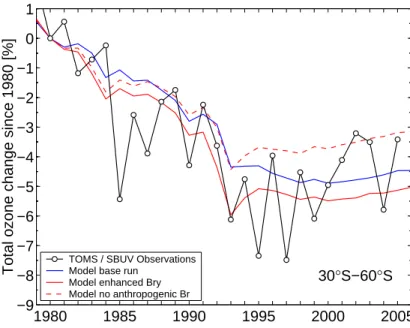
Figures 3–5 shows similar results as Fig. 2, but for southern hemisphere mid-latitudes (30◦S–60◦S), the tropics (30◦N–30◦S) and the region from 60◦S–60◦N, re-15
spectively.
Both modelled and observed ozone reductions are larger over the southern hemi-sphere mid-latitudes compared to the northern hemihemi-sphere. While for the northern hemisphere the model underestimates the ozone reduction following the eruption of Mt. Pinatubo, this is not the case for the southern hemisphere. The reason for the 20
very different behaviour of the Pinatubo ozone anomalies for the two hemispheres is still unclear at present. However, in general the model reproduces well the observed ozone trend. For the southern hemisphere mid-latitudes the model run with no an-thropogenic bromine produces an ozone depletion of 65% of the total modelled loss between 1980 and 2005. I.e., the relative contribution of anthropogenic bromine emis-25
sions to the trend in total ozone is a bit smaller for the southern hemisphere than it is for the northern hemisphere.
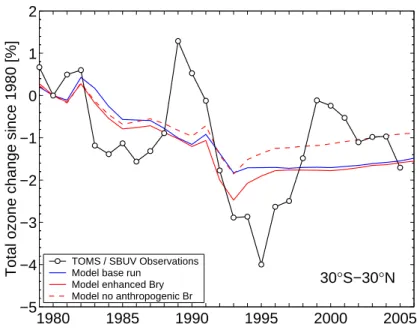
Even in the tropics there is reasonable agreement between the modelled and ob-served total ozone trend (Fig. 4). Interestingly, there appears to be a relatively large
ACPD
6, 6497–6524, 2006 The contribution of bromine to stratospheric ozone trends B.-M. Sinnhuber et al. Title Page Abstract Introduction Conclusions References Tables Figures J I J I Back CloseFull Screen / Esc
Printer-friendly Version Interactive Discussion
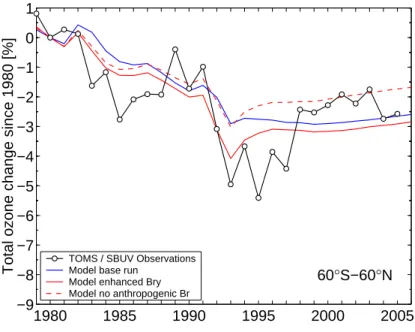
solar signal present in the tropical total ozone observations, with reduced levels of ozone during the minimum periods of solar activity in the middle of the 1980s and the 1990s and with enhanced ozone during solar maximum periods. There is no solar cy-cle effect included in the model calculations presented here. Figure5summarizes the results for the overall region between 60◦S and 60◦N.
5
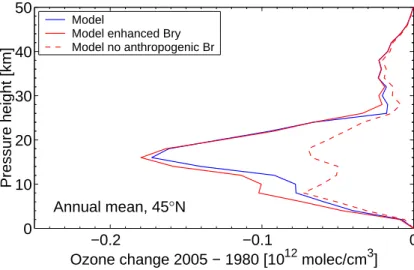
Figure6shows the profile of the modelled ozone change between 1980 and 2005 for northern hemisphere mid-latitudes (45◦N). There is a relatively large modelled ozone decrease in the tropopause region, as a result of the model calculating some chlorine activation in this region (corresponding to ClO noon values of about 50 pptv). Again, it is not clear how realistic the results are for the upper troposphere and the tropopause 10
region, given the model’s limitations in these regions.
It is evident from Fig. 6 that anthropogenic bromine emissions have a very large effect on the ozone trend in the stratosphere between the tropopause and about 25 km altitude. Above 30 km altitude the effect of bromine is small. Except for the lowermost stratosphere, the inclusion of enhanced bromine due to short-lived source gases has 15
only a minor effect on the calculated ozone decrease. The picture changes, however, for periods of enhanced aerosol surface area. Figure7 shows the calculated ozone change for March between 1980 and 1993. Under these conditions the enhanced bromine loading leads to a significant increase in modelled downward ozone trends over much of the lower stratosphere, in qualitative agreement with the calculations by 20
Salawitch et al.(2005). 3.2 Bromine α
As noted above, the greater effectiveness of bromine compared to chlorine for ozone destruction is the result of two effects: (a) most of the bromine source gases have a shorter stratospheric lifetime than the chlorine source gases, so that the ratio of 25
inorganic bromine (Bry) to inorganic chlorine (Cly) in the lower stratosphere is larger than the ratio of total bromine to total chlorine, and (b) bromine is chemically more effective than chlorine in destroying ozone. The chemical effectiveness of bromine
ACPD
6, 6497–6524, 2006 The contribution of bromine to stratospheric ozone trends B.-M. Sinnhuber et al. Title Page Abstract Introduction Conclusions References Tables Figures J I J I Back CloseFull Screen / Esc
Printer-friendly Version Interactive Discussion
relative to chlorine for ozone destruction is given by the so-called α-factor. Locally in the stratosphere the α-factor is defined as the change in ozone due to a change in bromine per inorganic bromine molecule, divided by the change in ozone due to chlorine per inorganic chlorine molecule (Daniel et al.,1999):
α= ∆O3−Bry /∆Bry
∆O3−Cly/∆Cly
.
5
An effective value of αcolumn for column ozone loss can be defined by the change in column ozone due to bromine per inorganic bromine molecule, divided by the change in column ozone due to chlorine per inorganic chlorine molecule:
αcolumn= ∆O3−column−Bry
/∆Bry
∆O3−column−Cly/∆Cly
,
assuming that the ratio∆Cly/∆Bry is constant with altitude. Similarly one can define 10
also an effective value of αglobal for global ozone loss. FollowingDaniel et al. (1999) we have calculated α here by performing three model runs: (a) a standard run, (b) a model run with increased chlorine loading by increasing CFC-11 as the reference gas, and (c) a model run with increased bromine loading by including an artifical source gas with the same life time as CFC-11 but which releases bromine instead of chlorine. 15
This procedure ensures that the ratio of∆Cly/∆Bry is constant throughout the model stratosphere. Technically, we have increased chlorine and bromine by 50% over the base run. However, previous model calculations showed no significant difference in α for bromine and chlorine increases varied between 10 and 50%.
We have calculated α for two scenarios: The standard scenario without bromine 20
from short-lived compounds and the other scenario with CH2Br2and CHBr3 included. For both scenarios α is calculated in the same way by increasing bromine from the CFC-11-like tracer. Moreover, we have also performed yet another set of model runs to calculate α using JPL-97 reaction rate recommendations (and without bromine from
ACPD
6, 6497–6524, 2006 The contribution of bromine to stratospheric ozone trends B.-M. Sinnhuber et al. Title Page Abstract Introduction Conclusions References Tables Figures J I J I Back CloseFull Screen / Esc
Printer-friendly Version Interactive Discussion
short-lived compounds) to allow a quantitative comparison with the results of Daniel et al. (1999).
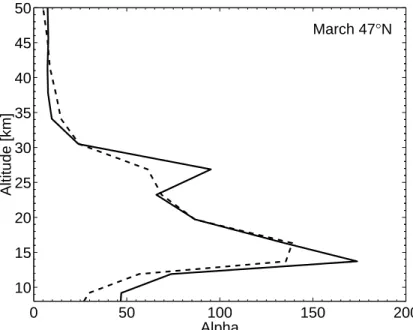
Figure 8 shows the profile of the local α-factor for March at 47◦N. The profile of α looks qualitatively similar to the results shown byDaniel et al.(1999), but also shows some differences: The peak value of α of about 170 at 15 km is much larger than 5
the value shown by Daniel et al. (1999). Secondly, while the calculations of α by Daniel et al.(1999) continuously increased towards the tropopause and into the upper troposphere, our α shows lower values again in the tropopause region, probably as a result of the calculated chlorine activation in the tropopause region.
Figure 8 shows that for spring-time conditions the enhanced bromine loading due 10
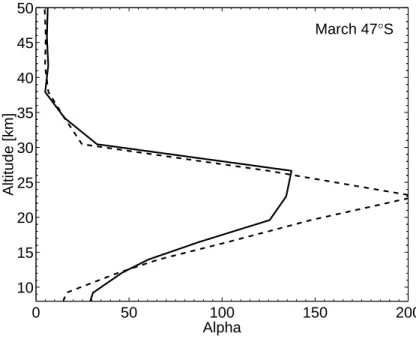
to short-lived compounds actually decreases the profile of α slightly. The reason for this is probably that the additional bromine from short-lived compounds provides a reaction partner for the chlorine, making ozone loss due to chlorine more effective (and thus reducing the relative effectiveness of bromine). However, as can be seen in Fig.9for March at 47◦S, during other seasons the enhanced bromine from short-lived 15
compounds can also increase local α.
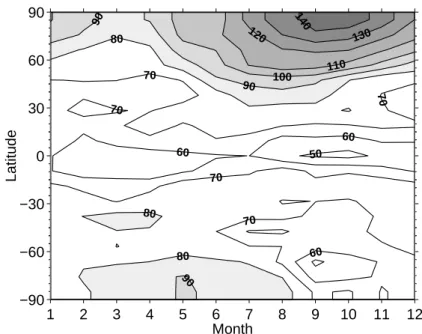
Effective αcolumn values as a function of month and latitude are shown in Fig. 10. These calculations were done with the most recent reaction rate recommendations and in the presence of enhanced bromine from short-lived compounds. As can be seen, there is a minimum in column α in the tropics with values around 50 to 60, and 20
higher values of around 70 to 80 in the mid-latitudes of both hemispheres. Very large values of α are reached in the high latitudes during summer and autumn, in particular in the northern hemisphere, with values as high as 140. These high values of column
α in the summer/autumn high latitudes are in accordance with very high local values
(α≥300) at around 25 km altitude. They correspond to situations where ozone loss is 25
mainly controlled by nitrogen oxides (NOx) and result from the fact that an increase of chlorine will lead to a decrease in NOx, compensating the effect of the chlorine increase for ozone loss, while an increase in bromine has no significant effect on NOx.
ACPD
6, 6497–6524, 2006 The contribution of bromine to stratospheric ozone trends B.-M. Sinnhuber et al. Title Page Abstract Introduction Conclusions References Tables Figures J I J I Back CloseFull Screen / Esc
Printer-friendly Version Interactive Discussion
The global annual mean value of α from these model runs is αglobal=73, a value that is considerably larger than the value of αglobal=45 given by Daniel et al. (1999). For the scenario without the short-lived bromine source gases the global α reduces to
αglobal=71. Changes in reaction rates since JPL-97 have contributed to an increase in
the calculated value of α. For the scenario using JPL-97 reaction rate recommenda-5
tions and without additional bromine from short-lived compounds we get a global value
of αglobal=64 (Fig.11). At least part of the increase in α between JPL-97 and JPL-05 is
due to a decrease in the effectiveness of chlorine induced ozone loss, as a result of a decrease in modelled ClO and a decrease in the rate constant for the reaction of ClO with HO2.
10
Recently, updated values of α were calculated in support of the 2006 WMO/UNEP Ozone Assessment also with the University of Illinois at Urbana-Champaign (UIUC) 2-D model and with the AER 2-D model. Both models calculate a global mean α of 61 using the preliminary JPL-05 kinetics in the presence of the 6 pptv of additional bromine from short-lived compounds (D. Wuebbels and D. Weisenstein, personal com-15
munication, 2006). With a previous version of the AER model using JPL-97 kinetics Ko et al. (1998) calculated a bromine efficiency factor for CH3Br of 58. Assuming a fractional release factor of 1.12 for CH3Br relative to CFC-11 (World Meteorological Organization,2003, Table 1-4) this corresponds to αglobal=52. These results thus pro-vide further epro-vidence that the value of α may indeed be significantly higher than the 20
previously used value of 45 and suggest that there could be relatively large differences in calculated α values among different models.
4 Summary and conclusions
We have calculated the changes in stratospheric ozone over the period 1980 to 2005 for specified changes in the halogen loading, using a 2-D model. The modelled ozone 25
trend agrees reasonably well with the observed trend in column ozone derived from the merged TOMS/SBUV data set, over both the northern and southern hemisphere.
ACPD
6, 6497–6524, 2006 The contribution of bromine to stratospheric ozone trends B.-M. Sinnhuber et al. Title Page Abstract Introduction Conclusions References Tables Figures J I J I Back CloseFull Screen / Esc
Printer-friendly Version Interactive Discussion
A large fraction of the modelled downward ozone trend at mid-latitudes is due to an-thropogenic bromine emissions. E.g., the model run with the fixed 1959 bromine load-ing, corresponding to a situation without anthropogenic bromine emissions, produces a downward trend in northern hemisphere mid-latitude total ozone that is only ≈55% of the modelled ozone trend including all halogen increases. In this sense anthropogenic 5
bromine emissions are responsible for ≈45% of the modelled northern hemisphere mid-latitude ozone reduction between 1980 and 2005. Because the contribution of Halon-2402 was not considered in the present source gas scenario, the increase in bromine loading due to anthropogenic emissions is probably underestimated here by about 10–15%. This means that the contribution of anthropogenic bromine emissions 10
to the ozone trend could be even larger, with bromine responsible for about half of the halogen-induced downward ozone trend at northern hemisphere mid-latitudes.
The impact of bromine on ozone depletion is largest in the lower stratosphere. The addition of bromine from short-lived source gases increases the modelled downward ozone trend and is particularly important for periods of enhanced stratospheric aerosol 15
loading following volcanic eruptions. The chemical effectiveness of bromine relative to chlorine for stratospheric ozone destruction, expressed by the α-factor, increases slightly on a global average if the enhanced stratospheric bromine loading due to short-lived source gases is taken into account. The global annual mean α from our model cal-culations increases from 71 for the scenario without short-lived bromine source gases 20
to 73 including short-lived bromine source gases. These values of α are considerably higher than the currently used value of 45 (Daniel et al.,1999). Updates of reaction rate recommendations have contributed to the increase in α but can not explain all the differences between our calculations and previously published results. Because α is directly used in the calculation of ozone depletion potentials for bromine source gases 25
a better understanding of the reasons for the differences in α between different models is important. One of the next steps needed is a study that compares calculations of α for a collection of independent models to assess the possible range of α.
Acknowledgements. Parts of this work were supported by the EU project SCOUT-O3 and
ACPD
6, 6497–6524, 2006 The contribution of bromine to stratospheric ozone trends B.-M. Sinnhuber et al. Title Page Abstract Introduction Conclusions References Tables Figures J I J I Back CloseFull Screen / Esc
Printer-friendly Version Interactive Discussion by the Helmholtz Virtual Institute Pole-Equator-Pole. We thank M. Ko, D. Weisenstein and
D. Wuebbels for sharing their α results prior to publication and for helpful comments.
References
Bobrowski, N., H ¨onninger, G., Galle, B., and Platt, U.: Detection of bromine monoxide in a volcanic plume, Nature, 423, 273–276, 2003. 6504
5
Bureau, H., Keppler, H., and M ´etrich, N.: Volcanic degassing of bromine and iodine: Experi-mental fluid/melt partitioning data and applications to stratospheric chemistry, Earth Planet. Sci. Lett., 183, 51–60, 2000. 6504
Chipperfield, M. P.: Multiannual simulations with a three-dimensional chemical transport model, J. Geophys. Res., 104, 1781–1805, 1999. 6500
10
Chipperfield, M. P. and Feng, W.: Comment on: Stratospheric Ozone Depletion at northern mid-latitudes in the 21st century: The importance of future concentrations of greenhouse gases nitrous oxide and methane, Geophys. Res. Lett., 30, doi:10.1029/2002GL016353, 2003. 6500,6504
Daniel, J. S., Solomon, S., Portmann, R. W., and Garcia, R. R.: Stratospheric ozone
destruc-15
tion: The importance of bromine relative to chlorine, J. Geophys. Res., 104, 23 871–23 880, 1999. 6503,6505,6507,6508,6509,6510
Dhomse, S., Weber, M., Wohltmann, I., Rex, M., and Burrows, J. P.: On the possible causes of recent increases in northern hemispheric total ozone from a statistical analysis of satellite data from 1979 to 2003, Atmos. Chem. Phys., 6, 1165–1180, 2006. 6504
20
Dvortsov, V. L., Geller, M. A., Solomon, S., Schauffler, S. M., Atlas, E. L., and Blake, D. R.: Rethinking reactive halogen budgets in the mid-latitude lower stratosphere, Geophys. Res. Lett., 26, 1699–1702, 1999. 6502
Feng, W., Chipperfield, M. P., Dorf, M., and Pfeilsticker, K.: Mid-latitude ozone changes: Studies with a 3-D CTM forced by ERA-40 analyses, Atmos. Chem. Phys. Discuss., in press, 2006.
25
6499
Hadjinicolaou, P., Pyle, J. A., Chipperfield, M. P., and Kettleborough, J. A.: Effect of interannual meteorological variability on mid-latitude ozone, Geophys. Res. Lett., 24, 2993–2996, 1997.
6504
ACPD
6, 6497–6524, 2006 The contribution of bromine to stratospheric ozone trends B.-M. Sinnhuber et al. Title Page Abstract Introduction Conclusions References Tables Figures J I J I Back CloseFull Screen / Esc
Printer-friendly Version Interactive Discussion Kinnersley, J. S.: The climatology of the stratospheric THIN AIR model, Q. J. R. Meteorol. Soc.,
122, 219–252, 1996. 6500
Kinnersley, J. S. and Tung, K.-K.: Modeling the global interannual variability of ozone due to the equatorial QBO and to extratropical planetary wave variability, J. Atmos. Sci., 55, 1417–1428, 1998. 6500
5
Kinnersley, J. S.: Interannual variability of stratospheric zonal wind forced by the northern lower-stratospheric large-scale waves, J. Atmos. Sci., 55, 2270–2283, 1998. 6500
Ko, M. K. W., Sze, N.-D., Scott, C., Rodriguez, J. M., Weisenstein, D. K., and Sander, S. P.: Ozone depletion potential of CH3Br, J. Geophys. Res., 103, 28 187–28 195, 1998. 6509
Montzka, S. A., Butler, J. H., Hall, B. D., Mondeel, D. J., and Elkins, J. W.: A decline in
tropo-10
spheric organic bromine, Geophys. Res. Lett., 30, 1826, doi:10.1029/2003GL017745, 2003.
6498
Nielsen, J. E. and Douglass, A. R.: A simulation of bromoform’s contribution to stratospheric bromine, J. Geophys. Res., 106, 8089–8100, 2001. 6502
Pfeilsticker, K., Sturges, W. T., B ¨osch, H., Camy-Peyret, C., Chipperfield, M. P., Engel, A.,
15
Fitzenberger, R., M ¨uller, M., Payan, S., and Sinnhuber, B.-M.: Lower stratospheric organic and inorganic bromine budget for the arctic winter 1998/99, Geophys. Res. Lett., 27, 3305– 3308, 2000. 6498,6501
Salawitch, R. J., Weisenstein, D. K., Kovalenko, L. J., Sioris, C. E., Wennberg, P. O., Chance, K., Ko, M. K. W., and McLinden, C. A.: Sensitivity of ozone to bromine in the lower stratosphere,
20
Geophys. Res. Lett., 32, L05811, doi:10.1029/2004GL021504, 2005. 6499, 6501, 6504,
6506
Sander, S. P., Finlayson-Pitts, B. J., Friedl, R. R., et al.: Chemical Kinetics and Photochemical Data for Use in Stratospheric Modeling, Evaluation No. 14, NASA JPL Publication 02-25, 2002. 6501
25
Schofield, R., Kreher, K., Connor, B. J., Johnston, P. V., Thomas, A., Shooter, D., Chip-perfield, M. P., Rodgers, C. D., and Mount, G. H.: Retrieved tropospheric and strato-spheric BrO columns over Lauder, New Zealand, J. Geophys. Res., 109, D14304, doi:10.1029/2003JD004463, 2004. 6498
Sinnhuber, B.-M., Arlander, D. W., Bovensmann, H., et al.: Comparison of measurements
30
and model calculations of stratospheric bromine monoxide, J. Geophys. Res., 107, 4398, doi:10.1029/2001JD000940, 2002. 6498,6501
Sinnhuber, B.-M., Rozanov, A., Sheode, N., et al.: Global observations of stratospheric bromine
ACPD
6, 6497–6524, 2006 The contribution of bromine to stratospheric ozone trends B.-M. Sinnhuber et al. Title Page Abstract Introduction Conclusions References Tables Figures J I J I Back CloseFull Screen / Esc
Printer-friendly Version Interactive Discussion monoxide from SCIAMACHY, Geophys. Res. Lett., 32, L20810, doi:10.1029/2005GL023839,
2005. 6498,6501
Sinnhuber, B.-M. and Folkins, I.: Estimating the contribution of bromoform to stratospheric bromine and its relation to dehydration in the tropical tropopause layer, Atmos. Chem. Phys. Discuss., 5, 12 939–12 956, 2005. 6502
5
Wamsley, P. R., Elkins, J. W., Fahey, D. W., et al.: Distribution of halon-1211 in the upper troposphere and lower stratosphere and the 1994 total bromine budget, J. Geophys. Res., 103, 1513–1526, 1998. 6502
World Meteorological Organization: Scientific Assessment of Ozone Depletion: 2002, Global Ozone Research and Monitoring Project – Report No. 47, Geneva, 2003. 6498,6501,6509
10
ACPD
6, 6497–6524, 2006 The contribution of bromine to stratospheric ozone trends B.-M. Sinnhuber et al. Title Page Abstract Introduction Conclusions References Tables Figures J I J I Back CloseFull Screen / Esc
Printer-friendly Version Interactive Discussion 1960 1970 1980 1990 2000 0 500 1000 1500 2000 2500 3000 3500 CH 3Cl CFC−11 CFC−12 CFC−113 CCl 4 CH 3CCl3 (a) Year
Total chlorine loading [pptv]
1960 1970 1980 1990 2000 0 5 10 15 20 25 (b) CH3Br Halon−1301 Halon−1211 CHBr 3 (?) CH2Br2 (?) Year
Total bromine loading [pptv]
Fig. 1. Source gas scenario (global mean surface mixing ratios) used in the model calculations. (a) Chlorine compounds. The difference between the contribution from the indicated source gases and the total chlorine loading (heavy line) is due to HCFCs and other minor CFCs. (b) Total bromine loading due to CH3Br, Halon-1301, and Halon-1211 only (thick solid line), as well as the assumed additional contribution due to the very short-lived source gases CHBr3 and CH2Br2 (thick dashed line). The exact contribution of the very short-lived gases to the total bromine loading in the real atmosphere is still unclear at present. Note that the model calculations here did not include any other halons such as Halon-2402.
ACPD
6, 6497–6524, 2006 The contribution of bromine to stratospheric ozone trends B.-M. Sinnhuber et al. Title Page Abstract Introduction Conclusions References Tables Figures J I J I Back CloseFull Screen / Esc
Printer-friendly Version Interactive Discussion 1980 1985 1990 1995 2000 2005 −9 −8 −7 −6 −5 −4 −3 −2 −1 0 1 30°N−60°N
Total ozone change since 1980 [%] TOMS / SBUV ObservationsModel base run
Model enhanced Bry Model no anthropogenic Br
Fig. 2. Change in northern hemisphere mid-latitude (30◦N–60◦N) column ozone since 1980.
ACPD
6, 6497–6524, 2006 The contribution of bromine to stratospheric ozone trends B.-M. Sinnhuber et al. Title Page Abstract Introduction Conclusions References Tables Figures J I J I Back CloseFull Screen / Esc
Printer-friendly Version Interactive Discussion 1980 1985 1990 1995 2000 2005 −9 −8 −7 −6 −5 −4 −3 −2 −1 0 1 30°S−60°S
Total ozone change since 1980 [%] TOMS / SBUV ObservationsModel base run
Model enhanced Bry Model no anthropogenic Br
Fig. 3. As for Fig.2but for southern hemisphere mid-latitudes (30◦S–60◦S).
ACPD
6, 6497–6524, 2006 The contribution of bromine to stratospheric ozone trends B.-M. Sinnhuber et al. Title Page Abstract Introduction Conclusions References Tables Figures J I J I Back CloseFull Screen / Esc
Printer-friendly Version Interactive Discussion 1980 1985 1990 1995 2000 2005 −5 −4 −3 −2 −1 0 1 2 30°S−30°N
Total ozone change since 1980 [%] TOMS / SBUV ObservationsModel base run
Model enhanced Bry Model no anthropogenic Br
Fig. 4. As for Fig.2but for the tropics (30◦S–30◦N). Note the change in scale compared to
Figs.2,3, and5.
ACPD
6, 6497–6524, 2006 The contribution of bromine to stratospheric ozone trends B.-M. Sinnhuber et al. Title Page Abstract Introduction Conclusions References Tables Figures J I J I Back CloseFull Screen / Esc
Printer-friendly Version Interactive Discussion 1980 1985 1990 1995 2000 2005 −9 −8 −7 −6 −5 −4 −3 −2 −1 0 1 60°S−60°N
Total ozone change since 1980 [%] TOMS / SBUV ObservationsModel base run
Model enhanced Bry Model no anthropogenic Br
Fig. 5. As for Fig.2but for global ozone between 60◦S and 60◦N.
ACPD
6, 6497–6524, 2006 The contribution of bromine to stratospheric ozone trends B.-M. Sinnhuber et al. Title Page Abstract Introduction Conclusions References Tables Figures J I J I Back CloseFull Screen / Esc
Printer-friendly Version Interactive Discussion −0.2 −0.1 0 0 10 20 30 40 50 Annual mean, 45°N
Ozone change 2005 − 1980 [1012 molec/cm3]
Pressure height [km]
Model
Model enhanced Bry Model no anthropogenic Br
Fig. 6. Modelled annual mean ozone change at 45◦N between 1980 and 2005 in
molecules/cm3.
ACPD
6, 6497–6524, 2006 The contribution of bromine to stratospheric ozone trends B.-M. Sinnhuber et al. Title Page Abstract Introduction Conclusions References Tables Figures J I J I Back CloseFull Screen / Esc
Printer-friendly Version Interactive Discussion −10 −0.8 −0.6 −0.4 −0.2 0 0.2 10 20 30 40 50 March 45°N
Ozone change 1993 − 1980 [1012 molec/cm3]
Pressure height [km]
Fig. 7. Same as for Fig.6but for modelled ozone differences between March 1980 and March
1993. This illustrates that the effect of additional bromine from very short-lived source gases is largest during periods of enhanced stratospheric aerosol loading.
ACPD
6, 6497–6524, 2006 The contribution of bromine to stratospheric ozone trends B.-M. Sinnhuber et al. Title Page Abstract Introduction Conclusions References Tables Figures J I J I Back CloseFull Screen / Esc
Printer-friendly Version Interactive Discussion 0 50 100 150 200 10 15 20 25 30 35 40 45 50 Alpha Altitude [km] March 47°N
Fig. 8. Calculated bromine α as a function of altitude during March at 47◦N. The solid line
is from the standard model run while the dashed line is from the model run with enhanced bromine loading due to very short-lived source gases.
ACPD
6, 6497–6524, 2006 The contribution of bromine to stratospheric ozone trends B.-M. Sinnhuber et al. Title Page Abstract Introduction Conclusions References Tables Figures J I J I Back CloseFull Screen / Esc
Printer-friendly Version Interactive Discussion 0 50 100 150 200 10 15 20 25 30 35 40 45 50 Alpha Altitude [km] March 47°S
Fig. 9. Same as Fig.8but for 47◦S.
ACPD
6, 6497–6524, 2006 The contribution of bromine to stratospheric ozone trends B.-M. Sinnhuber et al. Title Page Abstract Introduction Conclusions References Tables Figures J I J I Back CloseFull Screen / Esc
Printer-friendly Version Interactive Discussion 1 2 3 4 5 6 7 8 9 10 11 12 −90 −60 −30 0 30 60 90 Month Latitude 90 80 70 60 70 70 70 60 80 80 90 60 50 70 90 100 110 120 130 140
Fig. 10. Calculated αcolumn from the model run with enhanced bromine loading due to very
short-lived source gases as function of latitude and season. Values larger than 80 are shaded.
ACPD
6, 6497–6524, 2006 The contribution of bromine to stratospheric ozone trends B.-M. Sinnhuber et al. Title Page Abstract Introduction Conclusions References Tables Figures J I J I Back CloseFull Screen / Esc
Printer-friendly Version Interactive Discussion 1 2 3 4 5 6 7 8 9 10 11 12 −90 −60 −30 0 30 60 90 Month Latitude 100 90 80 70 60 50 40 50 60 70 60 60
Fig. 11. As Fig.10but for JPL-97 kinetics and without additional Bry from short-lived
com-pounds.