HAL Id: insu-01821831
https://hal-insu.archives-ouvertes.fr/insu-01821831
Submitted on 4 Jan 2021HAL is a multi-disciplinary open access archive for the deposit and dissemination of sci-entific research documents, whether they are pub-lished or not. The documents may come from teaching and research institutions in France or abroad, or from public or private research centers.
L’archive ouverte pluridisciplinaire HAL, est destinée au dépôt et à la diffusion de documents scientifiques de niveau recherche, publiés ou non, émanant des établissements d’enseignement et de recherche français ou étrangers, des laboratoires publics ou privés.
Does convection-permitting simulate better rainfall
distribution and extreme over Guinean coast and
surroundings?
Kouakou Kouadio, Sophie Bastin, Abdourahamane Konare, Vincent Ajayi
To cite this version:
Kouakou Kouadio, Sophie Bastin, Abdourahamane Konare, Vincent Ajayi. Does convection-permitting simulate better rainfall distribution and extreme over Guinean coast and surroundings?. Climate Dynamics, Springer Verlag, 2020, 55, pp.153-174. �10.1007/s00382-018-4308-y�. �insu-01821831�
Climate Dynamics
Does convection-permitting simulate better rainfall distribution and extreme over
Guinean coast and surroundings?
--Manuscript Draft--Manuscript Number: CLDY-D-17-00719R2
Full Title: Does convection-permitting simulate better rainfall distribution and extreme over Guinean coast and surroundings?
Article Type: S.I. : Advances in Convection-Permitting Climate Modeling
Keywords: high resolution, WRF, West Africa monsoon, Parameterization, Rainfall, convection permitting
Corresponding Author: kouakou kouadio, Ph.D
Universite Felix Houphouet-Boigny Abidjan, abidjan CÔTE D'IVOIRE Corresponding Author Secondary
Information:
Corresponding Author's Institution: Universite Felix Houphouet-Boigny Corresponding Author's Secondary
Institution:
First Author: kouakou kouadio, Ph.D
First Author Secondary Information:
Order of Authors: kouakou kouadio, Ph.D Sophie Bastin
Abdourahamane Konare Vincent O. Ajayi
Order of Authors Secondary Information:
Funding Information: German Federal Ministry of Higher Education and Research (BMBF), WASCAL
Dr. kouakou kouadio
France Government through the Service de Cooperation et d’Action Culturelle (SCAC)
(SCAC/2014/BE/002)
Dr. kouakou kouadio
Abstract: This research work focuses on the problem of climate simulation of rainfall over West Africa and particularly over coastal countries of the Gulf of Guinea by Regional Climate Models (RCMs). The sensitivities of Weather Research and Forecasting (WRF) Model were tested for changes in horizontal resolution (convection permitting versus
parameterized) on the replication of West African monsoon for year 2014. Sensitivity test was also performed for response of rainfall to changes in microphysics (MP) and planetary boundary layer (PBL) schemes. Generally, the result shows that WRF are able to replicates rainfall distribution with an adequate representation of the dynamical features of West African monsoon system. The high-resolution (wrf-4km) shows dry bias along the coast of the Gulf of Guinea but generally outperforms wrf-24km run especially in replication of the extreme rainfall distribution. The dry bias along the coastal area is suggested to not only related to convection but mostly to microphysics and PBL parameterisation schemes.
Differences were noticed between the dynamics of WRF and ERA-interim outputs despite the use of spectral nudging in the experiment which then suggest strong interactions between scales. These differences were observed to be restricted mainly to the low-layer monsoon flow in JJA. Both runs at 24km and 4km hardly simulate the typical diurnal distribution of rainfall. The sensitivity of WRF to MP (only sophisticated MP were tested) and PBL reveals a stronger impact of PBL than MP on rainfall distribution and the most significant added value over the Guinean coast and
surroundings area was provided by the configurations using non-local PBL scheme (as ACM2). The changes in MP and PBL schemes in general seem to have less effect on the explicit runs (wrf-4km) in the replication of the rainfall over the Gulf of Guinea and the surroundings seaboard.
Revision 2
I would like to appreciate all the contribution from the reviewer to improve this work.
COMMENTS FOR THE AUTHOR:
Reviewer #1: Second review of the paper:
Does convection-permitting climate simulation improve the replication of rainfall distribution and extreme over Guinean coast and surroundings? by Kouadio et al.
First, I would like to thank the authors that addressed part of my previous recommendations. The paper is improved. Nevertheless, after a careful second read, I have some main comments that require substantial modifications. I recommend major revision before accepting this study. Please see below my main recommendations.
Comments about the previous review:
1- About the answers of the previous revision. The authors reply only to my question without any modification of the text. These questions are not for my personal interest but reveal a lack in the explanations and should imply clarification in the text. The authors must have to reconsidere some of these previous points and clarify the main document. This is, for example, for the comments L31, L326 …
- L31: what "representations" means here? forecasted? please clarify
This question has been addressed in the first line of the abstract.
Then, the first sentence has been modified from: “This research work focuses on the problem of representation of rainfall over West Africa and particularly over coastal countries of the Gulf of Guinea by Regional Climate Models (RCMs).” To:
This research work focuses on the problem of climate simulation of rainfall over West Africa and particularly over coastal countries of the Gulf of Guinea by Regional Climate Models (RCMs).
Authors' response to reviewers' comments Click here to download Authors' response to reviewers' comments View Letter_kk2.docx
- Paragraph starting L247 and Figure 3: The authors discuss the results over the sea, but I am more curious concerning the explanations of the intense dipole E/W over the continent. This is maybe more important than over the Ocean because it affects directly the population.
The term Guinean Coast includes all the countries around the coast. It spread till 8N. Thus, the discussion is not only about across sea but concerns the surrounding countries. The question of dipole maybe addressed in multi-years works.
The text has been modified (L284 – 305).
“This figure 3 thus shows that indeed, the run at high resolution generally, outperforms the run at 24-km resolution over the Guinean band and southern Sahel, i.e. presents an upscaled added-value. There is however, some area where the high-resolution run seems to degrade the information instead of improving the simulation, especially over Ivorian coast, south-west of Guinea and Sierra Leone. One of the main reason would be related to the fact that the better skills of the explicit run are expected at daily and sub-daily scales and for extreme values while this AV is computed over 9 months. At seasonal scale, variability is mainly driven by large-scale dynamics that is not necessary improved by the higher resolution. On the other hand, Figure 2 has shown that in comparison to TRMM and CHIRPS datasets, WRF has good performance across near-Sahel and Sahel (north of 8°N), but strongly underestimates precipitation across the coastal area of the surrounding countries of the Gulf of Guinea and mainly over the sea during the pre-onset period and at the end of the rainy season. This leads to strong dry bias from the sea to about 6N (beyond the coast) during the rainy season over Sahel. One may suggest that the introduction of this dry bias along the Gulf of Guinea seaboard toward the equator (from 5°N and equatorward) into the model simulations (either parameterized and explicit convection), may be directly related to the forcing conditions. Moreover, previous works as Meynadier et al. (2010 and Marsham et al. (2013) revealed that the southward bias in the simulation of rainfall across West Africa, is an inherent problem for RCMs. Thus, model parameterisation schemes can be point out. Furthermore, convection-permitting simulation seems not to be able to correct effectively the dry bias. Therefore, convective parameterization alone may not be enough to
explain this dry bias. Klein et al. (2015) found a similar dry bias in a cumulus, microphysics and boundary layer parameterization ensemble analysis of WRF version 3.5.1 and related it to the driving conditions.”
- L268: gridded data means observed here? please clarify
The paragraph has been removed.
However, it was related to: “reliable and long-term daily observed gridded data”
- Paragraph starting L268 and Figure 4: The direct comparison between station datasets….
The section has been removed. The suggested plot can be seen in figure 5.
- Paragraph starting L316 useless and questionable, I recommend to remove it
The section has been removed as suggested
- L324: Please clarify the reason of this specific box
This clarification can be found in the text: L213-L318;
“This box is based (1) on the availability of ground-based observation which did not spread over the whole region and also (2) to allow for better comparison of previous works as Klein et al. (2015) and those that focused on onset like Sultan and Janicot (2000, 2003).”
- L326: 25th percentile of the rainy days (conditional) or of all the days?
The answer can be found in the text at line: L322-L324;
“It is worth noting that all the non-rain events have been beforehand removed in order to consider only the statistics based on effective rain events.”
- L328: Could the authors explain how the regrid of the data can generate positive then negative changes of precipitation depending the hours of the day. It is not clear to me.
The section has been modified: L313-364
- Paragraph starting L332 is too descriptive.
- Subsection 3.4 is also too descriptive. Please synthesize.
The section has been modified and figure changed: Subsection 3.3
- L383: The authors write "it provides more realistic estimations over the Sahel and
emphasizes the benefit of the high-resolution simulation." But this is too speculative. The justifications are too few and based only on one figure that is not well adapted, and on one specific quantile.
The graph has been adapted to support the statement section 3.3
- L394: This is too specula
The graph has been adapted to support the statement. section 3.3
- Paragraph starting L397: I recommend to remove this paragraph.
removed previously
- L454 Ivory Coast
Corrected: L500, L279, L280
2- About the scientific results and the impacts of the resolution. I am still convinced that most of the difference in term of precipitation values between WRF-24km and WRF-4km are explained by the size of each cells associated with each grid point (i.e. downscaling effect and not
necessary a physical impact of the schemes). The authors should reconsider their methodologies to better prove these impacts. For example, what are the results of the new Fig. 5 if the authors would use the same resolution (by upscaling the WRF-4km simulation). Will they find results significantly different?
Figure 5 has been repeated with the regridded wrf-24km and wrf-4km into TRMM dataset grid scale. It is noticed from the analysis marginal differences between WRF native and regridded rainfall output at daily scale. The discussion can be found in the text at: L423-L432. The figure is added just after
Similar analysis has been made at diurnal scale (L313:L364), and the result indicate that: upscaling WRF outputs into the grid scale of TRMM dataset has an effect on the number of the events regardless of the range of rainfall intensity, however, the timing is preserved.
Thus, results may suggest a combination of both grid scale factors and physics on the observed differences between the runs at 24km (parameterized convection) and 4km (convection-permitting).
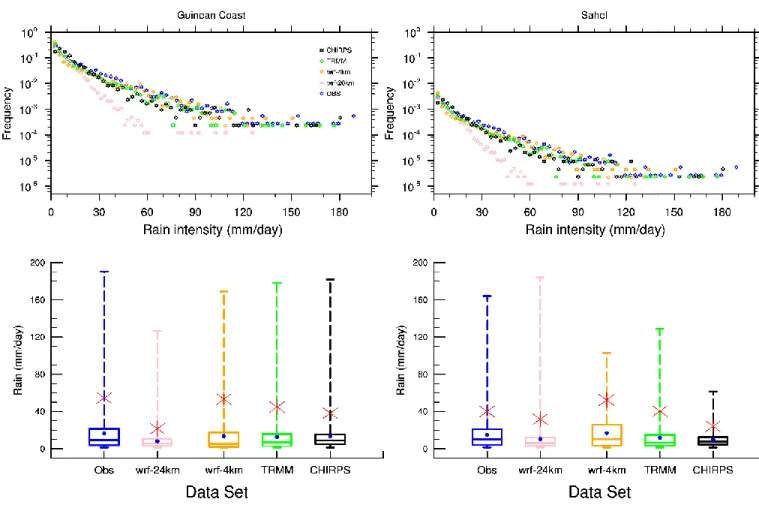
Empirical probability distribution functions of daily precipitation (top) daily. Boxplots of the daily precipitation (Bottom) respectively from the ground-based observations, 24km, wrf-4km, TRMM and CHIRPS data sets over the Guinean coast (left) and the Sahelian (right) regions. The boxes indicate respectively from the bottom to the top the first, second and third interquartile ranges and the whiskers stretch to minimum and maximum values of each data set. Blue dots and the red stars represent respectively the mean value and the 95th percentile of
the precipitation for each data set. Wrf-24km, wrf-4km and CHIRPS datasets have been upscale into TRMM grid scale.
This comment seems more important in this second round since the difference between the two simulations in the new Fig. 6 and 7 are not very different. By the way, are these differences significant?
3- Despite some main comments of the previous review, some figures (see details below) have a too low quality relative to the standard of this journal. The authors have to improve most of them, and should be careful with the titles, axis, captions.
Main comments on the new document:
Abstract: To me the justification of this study, and more specifically why only PBL and MP schemes are the only schemes analysed, is not well exposed. Also, the authors are still using some speculative, or at least not justified, conclusions such as 'fairly replicates', 'good
simulation'. These conclusions should be better assessed with significant test. As a reminder, this study uses only one year that reduces considerably the significance of the results, the authors should be as cautious as possible.
The limitation of the study related to the specific year has been mentioned at the end of the conclusion and the abstract has been revised.
Section 3.1:
Still too long and descriptive. For example, paragraph starting L284 must be simplified. L 293: 'Moreover, ERAI allocated shows its maximum precipitation toward the south' sounds weird to me
Paragraph L226-L239 of the previous version has been removed and the section has been modified to consider among other remarks the upscale of wrf-4km aspect.
Paragraph starting L284 has been modified. L270-L297
Section 3.2:
There are some confusions when the authors discussed the quantiles of precipitation (Q95). Sometimes they are using the value of Q95 in the observation, sometimes they are using this thresholds for each dataset. Please avoid mixing up the two methods.
The section has been modified and it also consider the upscale of wrf-4km.
Only L338-L340 mentioned Q95 using wrf-24km to discuss about the marginal occurrence of intense rain events with wrf-24km.
L349. No ERAI is not used any more in this figure, please correct.
This has been corrected: L355
L363: The underestimation of the model (especially with the 24-km resolution) is quite logic. That should be mentioned.
Paragraph starting L363 and Figure 5. To me, the effect of the downscaling effect of the
precipitation is the main driver of the results. The authors should compare the precipitation at the same resolution.
All the datasets have been upscaled to TRMM grid scale. The plot shows negligible changes and the result has been discussed on the text: L409:418. See figure added in this report.
Section 4.1 and figure 6 and 7. Could the authors check carefully what they plot and discus. In the title, caption and in the text, they mention the difference, but to me it is not. Please reconsider all this part.
The section has been modified L426-477. Differences can be observed between ERAI and WRF outputs especially at lower levels. For example, in the northern extend and intensity of monsoon flow, the intensity of African easterly Jet and the location and intensity of deep convection.
Less important differences are observed between wrf-24km and wrf-4km and wrf-4km seems closer to ERAI.
At the end of the section 4.1, what are the conclusion of these difference. Do they authors consider the WRF-4 is better than WRF-24. This section is still too descriptive, general comments and main conclusions are missing.
The differences between wrf-24km and wrf-4km are not pronounced enough to fully consider that wrf-4km is better wrf-24km however, the explicit run shows result closer to the ERAI.
Paragraph starting 517: To me the results are mainly explained by the resolution of each product. Please use the same resolution to fairly compared these datasets.
Figure 8 has been rebuilt using the regridded wrf-24km and wrf-4km into TRMM dataset grid scale. As figure 5 there is marginal changes and we have same conclusion.
Empirical probability distribution functions of daily precipitation (top) daily. Boxplots of the daily precipitation (Bottom) over the Guinean coast (left) and the Sahelian (right) regions. Boxplots of the daily precipitation over the Guinean coast respectively from the ground-based observation, TRMM, ERA-interim and wrf-24km, wrf-4km from each ensemble group
members of the different configurations. The boxes indicate respectively from the bottom to the top the first, second and third interquartile ranges and the whiskers stretch to minimum and maximum values of each data set. Blue dots and the red stars represent respectively the mean value and the 95 percentiles of the precipitation for each data set. Wrf-24km, wrf-4km and CHIRPS datasets have been upscale into TRMM grid scale.
Figures:
Fig 4: The quality of these figures could be improved. No need of title for each panel (this should be indicated in the caption). Legend not readable and only one is required.
The figure has been modified
Figure 5, where are the numbers mentioned at the end of the caption
Corrected
Figure 6 and 7 Difference, are you sure?
Already answer in previous comments
Figure 7 Please keep the same structure as in Fig 6 (first column ERAI, second WRF-4, third WRF-24)
The figures 6 and 7 have modified accordingly (first column ERAI, second 4, third WRF-24)
Figure 9 and 10 not readable, low quality, need to be synthesized
The Figures 9 and 10 give detail information about the ensembles.It therefore going to be difficult to regroup them without missing the information. The quality of the graphs has been improved.
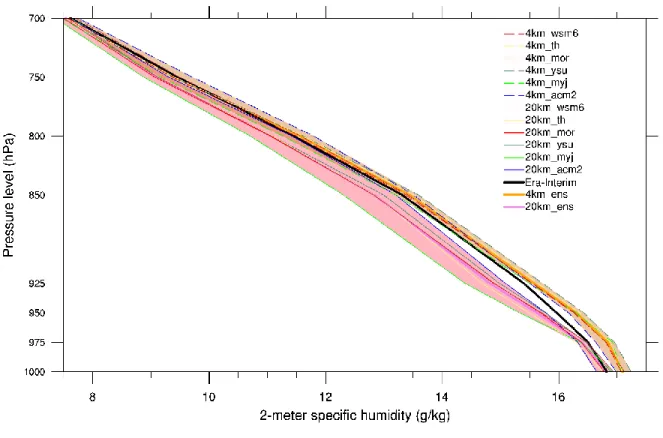
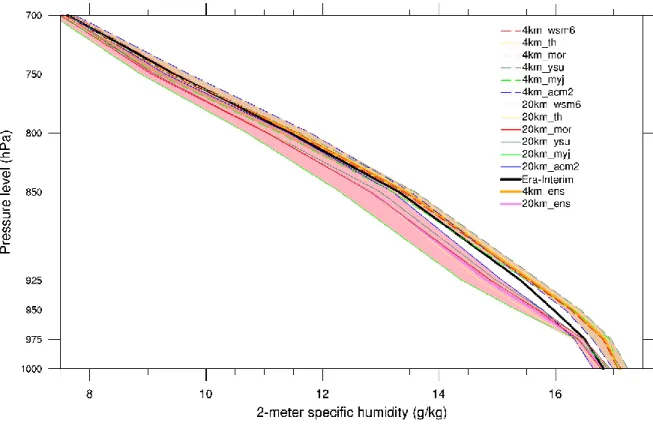
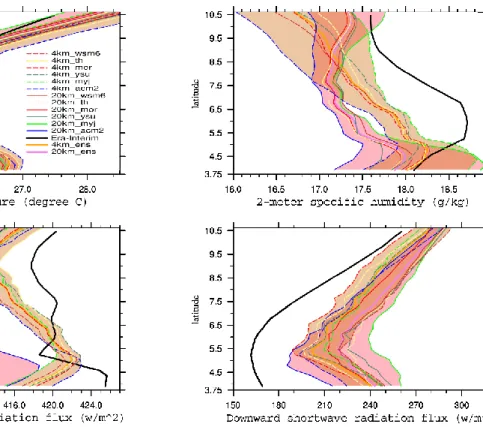
Fig. 9 Vertical profiles of specific humidity from wrf-20km and 4km sub-ensembles group
members and Era-interim data set. All the values are averaged from 10W to 5E. The pink and orange coloured areas mark the range of value respectively with wrf-24km and wrf4km.
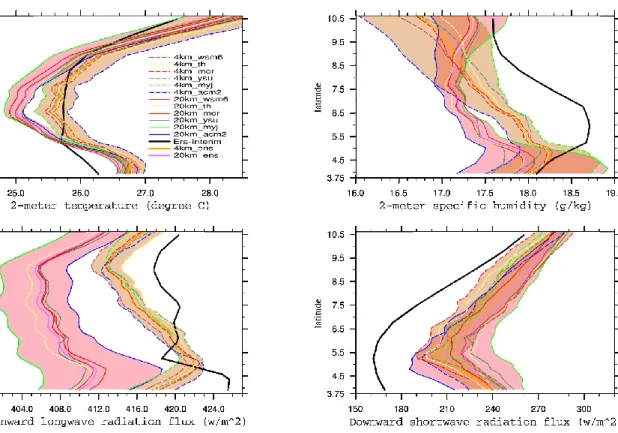
Fig. 10 Meridional evolution of 2-meter temperature, specific humidity, downward shortwave
and longwave radiation fluxes from wrf-20km and 4km ensemble group members and from Era-interim data set. All the values are averaged from 10W to 5 E. The pink and orange coloured areas mark the range of value respectively with wrf-24km and wrf4km.
Figure 12 is mentioned very briefly, consider to remove it.
1 Does convection-permitting simulate better rainfall distribution and extreme over Guinean coast 1
and surroundings? 2
KOUADIO1*, Kouakou., Sophie BASTIN2,Abdourahamane KONARE1., Vincent O. AJAYI3 3
1- Sciences des Structures de la Matière et de Technologie (SSMT), Université Felix Houphouët-4
Boigny, Abidjan, Côte d’Ivoire 5
2- LATMOS/IPSL, UVSQ Université Paris-Saclay, UPMC Univ. Paris 06, CNRS, Guyancourt, 6
France 7
3- WASCAL Graduate Research Program on West African Climate System (WACS)/Federal 8
University of Technology, Akure (FUTA), Nigeria 9
* Corresponding author’s address : 10
Kouakou KOUADIO 11
Sciences des Structures de la Matière et de Technologie (SSMT), Université Felix Houphouët-Boigny, 12
Abidjan, Côte d’Ivoire. / 01 BP 10578 Abidjan 01 13
E-mail : [email protected]/ 14
Acknowledgements 15
We gratefully acknowledge the full scholarship and financial support from the German Federal 16
Ministry of Higher Education and Research (BMBF) under the West African Science Service on Climate 17
Change and Adapted Land Use (WASCAL) Doctoral Programme. 18
We acknowledge the computing resources for the simulations supported by the IPSL group for 19
regional climate and environmental studies, with granted access to the HPC resources of GENCI/IDRIS 20
(under allocation i2015016313) and IPSL mesocenter CLIMSERV. 21
Additional support was provided by France Government through the Service de Cooperation et d’Action 22
Culturelle under reference SCAC/2014/BE/002. 23
We also acknowledge African Monsoon Multidisciplinary Analysis (AMMA) project for most of the 24
ground-based data used in the study. 25
We thank Laboratoire Atmosphères, Milieux, Observations Spatiales, France (LATMOS) and all the entire 26
staff for providing computing resources and other necessary supports. 27
I appreciate prof. A. KONARE of blessed memory for being an extraordinary mentor and for working under
28
his directive during this research work. Thank him again for all the supports, opportunities and facilities he
29
provided.
30
Finally, the authors are really grateful and thank the anonymous reviewers who contributed to improve this
31
work.
32
Manuscript Click here to download Manuscript kouadio_et_al_rev2.docx
2 Abstract
33
This research work focuses on the problem of climate simulation of rainfall over West Africa and
34
particularly over coastal countries of the Gulf of Guinea by Regional Climate Models (RCMs).
35
The sensitivities of Weather Research and Forecasting (WRF) Model were tested for changes in 36
horizontal resolution (convection permitting versus parameterized) on the replication of West 37
African monsoon for year 2014. Sensitivity test was also performed for response of rainfall to 38
changes in microphysics (MP) and planetary boundary layer (PBL) schemes. Generally, the result 39
shows that WRF are able to replicates rainfall distribution with an adequate representation of the 40
dynamical features of West African monsoon system. The high-resolution (wrf-4km) shows dry 41
bias along the coast of the Gulf of Guinea but generally outperforms wrf-24km run especially in 42
replication of the extreme rainfall distribution. The dry bias along the coastal area is suggested to
43
not only related to convection but mostly to microphysics and PBL parameterisation schemes.
44
Differences were noticed between the dynamics of WRF and ERA-interim outputs despite the use 45
of spectral nudging in the experiment which then suggest strong interactions between scales. These 46
differences were observed to be restricted mainly to the low-layer monsoon flow in JJA. Both runs 47
at 24km and 4km hardly simulate the typical diurnal distribution of rainfall. The sensitivity of 48
WRF to MP (only sophisticated MP were tested) and PBL reveals a stronger impact of PBL than 49
MP on rainfall distribution and the most significant added value over the Guinean coast and 50
surroundings area was provided by the configurations using non-local PBL scheme (as ACM2). 51
The changes in MP and PBL schemes in general seem to have less effect on the explicit runs (wrf-52
4km) in the replication of the rainfall over the Gulf of Guinea and the surroundings seaboard. 53
54
Key words: high resolution, WRF, West Africa monsoon, Parameterization, Rainfall, convection 55
permitting 56
3 1. Introduction
57
The West African region which extends from the Gulf of Guinea to the Sahel is an area 58
which is subjected to alternating dry and wet seasons mainly linked to the monsoon, which 59
influences the majority of annual precipitation. This region is an important source of aerosols and 60
energy, which contributes to the formation of tropical cyclones. Therefore, this region greatly 61
interacts with the Earth climate system and has been subject of numerous studies (Fontaine and 62
Philippon 2000; Trenberth et al. 2000 ; Ali et al. 2005 ; Abiodun et al. 2008 ; Konare et al. 2008 63
; Druyan et al. 2010 Moufouma-Okia and Rowell 2010 ; Sylla et al. 2010b ; Flaounas et al. 2012). 64
West African region has also been identified as one of the poorest region in the world which 65
depends mainly on rain-fed agriculture and one of the most vulnerable to climate change and 66
climate variability (IPCC 2007). This vulnerability is aggravated by the interaction of ‘multiple 67
stresses’ (drought frequency and duration, frequency of extreme events, among others), occurring 68
at various levels, and the low adaptive capacity (IPCC 2007). Several studies (Omotosho et al. 69
2000; Sultan and Janicot 2000, 2003; Hagos and Cook 2007; Omotosho 2008; Pm. Ruti 2009; 70
Janicot et al. 2010; Oettli et al. 2011) have argued that seasonal forecast of rainfall is crucial for 71
socio-economic development in this sub-region. This is in the aim to (i) prevent extreme events 72
like floods in the southern part, (ii) management of climate risk in agriculture (better preparedness 73
for rain-fed agricultural activities), (iii) forestall outbreak of diseases in the Sahel region etc. 74
Although many studies have focused on the prediction of the rainfall, there exists 75
challenges of reliable seasonal forecast due to several forcings. For example, the climate of this 76
region is influenced by the interactions of various complex mechanisms (topography, ocean-77
atmosphere interactions, atmosphere-biosphere exchanges etc.). In order to address these issues, 78
several studies investigated the patterns of inherent variability in the West African monsoon at 79
intra-seasonal, seasonal and interannual scales with the purpose to better understand the West 80
African Monsoon (WAM) mechanisms (Adedoyin 1989; Nicholson 2001; Brooks 2004; Okumura 81
and Xie 2004; 2004, Steiner et al. 2009 ; De Coëtlogon et al. 2010 ; Fink et al. 2010 ; Gbobaniyi 82
et al. 2014 ; Meynadier et al. 2014) and precipitation characteristics (location, intensity, duration 83
etc). 84
The relationship between rainfall and regional or large-scale dynamics over West Africa 85
has been reported by earlier studies (Nicholson and Grist 2003; Sultan et al. 2003). The onset of 86
4 the monsoon is associated with the intensification of the Tropical Easterly Jet (TEJ), a northward 87
shift and a weakening of the African Easterly Jet (AEJ), which is associated with a decrease of 88
African Easterly Waves (AEWs) activity (Lavaysse et al. 2006; Sylla et al. 2010b). These results 89
are in agreement with observation of Omotosho (2008) which found a stronger AEJ during dry 90
years than during wet ones. Air-sea (through the Sea Surface Temperature (SST) in the Gulf of 91
Guinea) interactions also play an active role in the amount of precipitation, its spatial distribution 92
and northward migration (Leduc-Leballeur et al. 2013). (Vizy 2002) investigated the influence of 93
the Gulf of Guinea’s SST anomalies (SSTAs) on the climatology of the WAM and found an 94
increase in rainfall over the Guinean coast area as a result of an increment in the lower tropospheric 95
water vapour content due to increased evaporation over the warm SSTAs. This was accompanied 96
by a decrease in rainfall over the southern Sahel. More generally, (Gaetani et al. 2017) have shown 97
that the SST warming affects the Sahelian precipitation through modifications in the global tropical 98
atmospheric dynamics, reducing the importance of the regional drivers. (Flaounas et al. 2012) and 99
(Mohino et al. 2011) also linked the onset and the different phases of precipitation over West 100
Africa to the convection over India and Indian ocean that generates Rossby waves which favors 101
the occurrence of dry air intrusion over West Africa, inhibiting convective activity. And finally, 102
the heat low dynamics has been shown to strongly influence the onset of the monsoon and its intra-103
seasonal variability (Lavaysse et al. 2009, 2010a, b), but also its variability at longer time scales 104
due to radiative effects of water vapor that affect the regional dynamics (Evan et al. 2015). The 105
increase of CO2 in the atmosphere also affects the precipitation at regional scale (Gaetani et al.
106
2017). An overview of the monsoon and its relationship with the climate system of the region is 107
provided by Nicholson (2013). 108
All these efforts in addition to constant progress of models are expected to allow adequate 109
representation of the WAM. However, at present day, models still have many difficulties to 110
simulate the West African climate features. Several reasons are suggested to justify these 111
underperformances ranging from the physics of the models, scale interactions, lacks of reliable 112
and dense observation data suited to the resolution of the models. For example, Chang (2011) 113
proposed that the limitation of climate models to reproduce the diurnal, seasonal and annual cycles 114
of the rainfall over West Africa is related to a limited capacity of meteorological services in getting 115
observations data set, and human and informatics resources. Indeed, the complex coupled systems 116
that modulate climate system of the region are not well incorporated in current models, and one 117
5 reason is that in most studies, precipitation is considered at monthly and regional scales, while 118
precipitation over this area have a very strong variability when looking at higher temporal and 119
spatial scales, with most of events occurring in the tails of classical precipitation distribution (either 120
very intense events, either dry periods). Furthermore, Intergovernmental Panel on Climate Change 121
(IPCC) acknowledged on its Third Assessment Report (TAR) that a model run at coarse resolution 122
does not allow detailed extreme rainfall evaluation (Griggs and Noguer 2002). Then the simulation 123
of the WAM at very high resolution is suggested to have a positive impact on the representation 124
of the West African Climate, not only because the physical processes will likely be better 125
represented but also because the explicit convection may help in the reproduction of this kind of 126
distribution (Ban et al. 2014; Prein et al. 2015). However, some model improvements are likely 127
necessary but the lack of observations to well define the distribution does not make the task easy. 128
Some earlier studies (Gallée et al. 2004; Doi et al. 2012; Holloway et al. 2012; Patricola et 129
al. 2012; Marsham et al. 2013; Moufouma-Okia and Jones 2014; Small et al. 2014; Harlaß et al. 130
2017) showed an improvement of their simulations using high resolution simulation. Marsham et 131
al. (2013)investigated the role of the moist convection over West Africa throughout a comparative 132
study based on a horizontal resolution’s cascade simulations using the UK Met Office Unified 133
Model (UM). The runs are composed of grid spacing’s of 4 and 12 km for 25 July to 4 August 134
2006. The first run is done with a convective parameterization and the second with an explicit 135
convection. They found a better representation of the WAM with the explicit run. The major 136
improvements come from a more realistic estimation of the latent and radiative heating in the 137
northern part of West Africa and a better representation of the diurnal cycle of the rainfall. They 138
noticed that these representations weaken the monsoon flow, the Sahel-Sahara pressure gradient, 139
delaying the related diurnal cycle and modifying the interaction between monsoon and the 140
boundary layer convection. They further reported that this result raises the importance of the 141
interaction between monsoon and convection. In addition to the explicitly resolving of deep 142
convection, convection-permitting run also allow a better representation of fine-scale orography 143
and variations of surface fields. This is really important in mountainous regions and in areas with 144
heterogeneous land surfaces like coastal and urban regions, wetlands, and patchy land covers. 145
Therewith, resolving fine-scale surface heterogeneity is also of paramount importance due to the 146
fact that it is an important forcing for deep convection (Prein et al. 2015). 147
6 However, the high-resolution simulation of the WAM remains largely under explored 148
because such type of high resolution modelling works requires high computational resources, 149
innumerable computing time, and processors to high storage capacity. As a consequence, the 150
studies conducted on the analysis of the WAM at high resolution are still too short (e.g. 11 days 151
for Marsham et al. (2013)) to fully make a conclusion for a model in a climate mode, when the 152
impact of the initial state will be cancelled. Therefore, the analysis of the WAM at very high 153
resolution remains an important concern. In addition, the prevention of events with high social, 154
economic and environmental impacts remains a constant challenge over the region. There is a 155
need for identification of accurate models with optimal parameterizations for better understanding 156
of the processes which allow a better prediction of West African rainfall variability and extreme 157
and then provide the best way of using of regional dynamical model as a forecast tool and 158
overcoming the difficulties of explaining the detailed rainfall and intense rainfall process over the 159
West African region and particularly along the Guinean Coast and surrounding. 160
The study presented here evaluates the added-value of performing a convective permitting 161
simulation in a climate mode, covering a longer period than a case study (several months) for the 162
representation of rainfall distribution over Guinean coast, with a focus on heavy rainfall. Several 163
combinations of parameterization schemes are compared in this explicit convective climate mode 164
and the best combinations for replication of high rainfall events over Guinean Coast and 165
surroundings are proposed. Section 2 describes the model and experiments which are compared 166
and evaluated in section 3. Section 4 assesses the role of dynamics and physics in the performance 167
of the different simulations. Finally, section 5 concludes the study. 168
169
2. Model Description and Experiments 170
Weather Research and Forecasting (WRF) Model is used in this study to first assess the 171
capability of High-Resolution Regional simulation (convective-permitting) of West African 172
Climate. 173
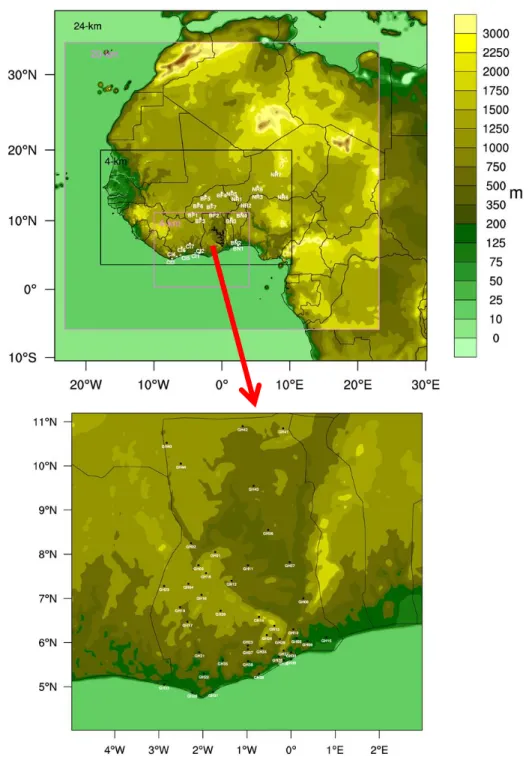
The first set of simulations uses two nested domains over the West African region (Fig.1) 174
from March to September 2014. The coarser domain extends from 25°W to 30°E and from 10°S 175
to 40°N with 24km horizontal resolution. The inner domain is one-way nested from 17°W to 10°E 176
7 and from 4°N to 20°N run at 4km horizontal resolution (figure 1, black rectangle). Lateral 177
boundaries of the 24km domain are forced with Centre for Medium-Range Weather Forecasts 178
(ECMWF) reanalyses interim (Dee et al. 2011) and it is spectrally nudged towards ERA-179
interim for wavelength of 1680 km in the zonal direction and of 1576 km in the meridional one to 180
avoid unrealistic departures from the driving fields due to the size of the domain (Stauffer and 181
Seaman 1990; Salameh et al. 2010; Omrani et al. 2012). The nudging concerns zonal and 182
meridional wind and the temperature above the boundary layer. The configuration of WRF model 183
includes 51 vertical layers extending up to 50 hPa, and uses the Yonsei University (YSU) planetary 184
boundary layer scheme (Hong et al. 2006), the Noah land-surface model (Chen and Dudhia 2001), 185
the Rapid Radiative Transfer Model for Global models (RRTMG) for shortwave (Dudhia 1989) 186
and longwave (Mlawer et al. 1997) and the single-moment six-class (WSM6) grid-scale 187
microphysics scheme (Hong and Lim 2006). Both domains share the same physics 188
parameterizations except that in the nested domain, cumulus (CU) parameterization is not activated 189
to allow explicit convection. The Kain–Fritsch (KF) convective scheme is used in the coarse 190
domain with activation of interaction with RRTMG to take into account subgrid-scale radiative 191
effects of clouds according to Alapaty et al. (2012), Herwehe et al. (2014). 192
The second set of runs is performed to focus on the physical processes of rainfall over the 193
Guinean Coast, particularly on the influence of microphysics and boundary layer processes on the 194
simulation of intense precipitations. These experiments consist of an ensemble of runs combining 195
different boundary layer and microphysics schemes. Nudging is used in the coarse domain to 196
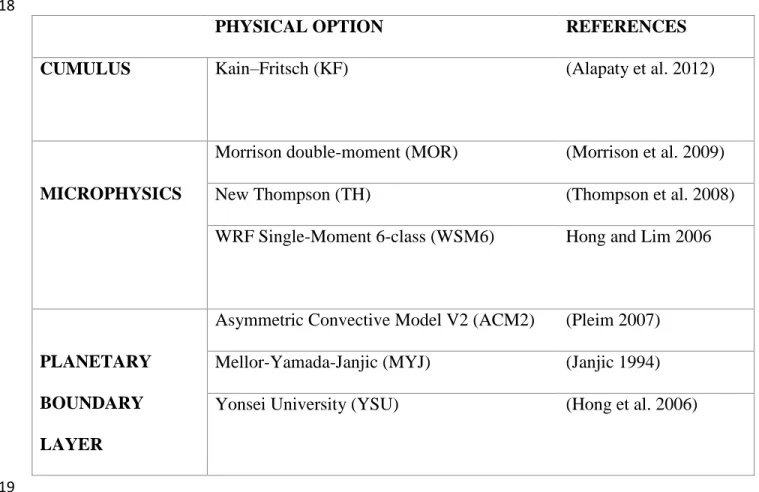
ensure that the large-scale dynamics is the same in all the simulations of the ensemble. Table 1 197
provides a summary of the schemes used and the different experiments. For this second set of 198
simulations, only one month is run (June 2014), over the domains shown by pink boxes in Fig.1. 199
Resolutions of the two nested domains are 20 km and 4km respectively. The nested domain focuses 200
on the southern coastal area of West Africa. 201
An inter-comparison of the model outputs from these different configurations versus 202
observation data is performed to find the best configuration that may provide an optimal 203
representation of rainfall/heavy rain over West Africa in general and particularly over the Guinean 204
Coast area. Observations come from satellites, based stations and reanalyses. The ground-205
based data used here are daily records of temperature and precipitation over 74 stations across 206
West Africa where the data are available for the year 2014 and selected according to the 207
8 geographical position. The precipitation product from Tropical Rainfall Measuring Mission 208
(TRMM) version 3B42V7 (3-hourly, daily) allows to cover the entire area with a 0.25° spatial 209
resolution (Huffman et al. 2007). In addition to TRMM data set, the Climate Hazards Group 210
InfraRed Precipitation with Station data (CHIRPS) rainfall dataset is used. This dataset is spanning 211
50°S-50°N (and all longitudes), starting in 1981 to near-present, CHIRPS incorporates 0.05° 212
resolution satellite imagery with in-situ station data to create gridded rainfall (Funk et al. 2015). 213
Specific humidity and temperature at 2-m, shortwave and longwave downward radiation 214
fluxes are also compared with ERA-Interim (at 0.75°x0.75° spatial resolution). Because of the 215
limitation of the precipitation derived from ERAI as discussed by Di Giuseppe et al. (2013), the 216
results with this dataset is not shown in the following graphs. 217
3. Evaluation of the estimated rainfall 218
3.1 Seasonal analysis 219
220
The simulation of rainfall by Regional Climate Model (RCM) over West Africa is still a 221
full challenge as reported in many previous studies such as Marsham et al. (2013) ; Meynadier et 222
al. (2014) ; Birch et al. (2014) and Panitz et al. (2014). Laprise et al. (2008) and Di Luca et al. 223
(2012) stated that the initial concept of the nesting technique is to use RCMs like sophisticated 224
“magnifying glasses” where ‘‘the generated small scales accurately represent those that would be 225
present in the driven data if they were not limited by resolution’’. In this section of the work, the 226
general improvement in the simulation of rainfall over West African region is assessed. Hereafter 227
the terms wrf-24km and wrf-4km are used to identify respectively results from runs at 24km and 228
4km respectively. 229
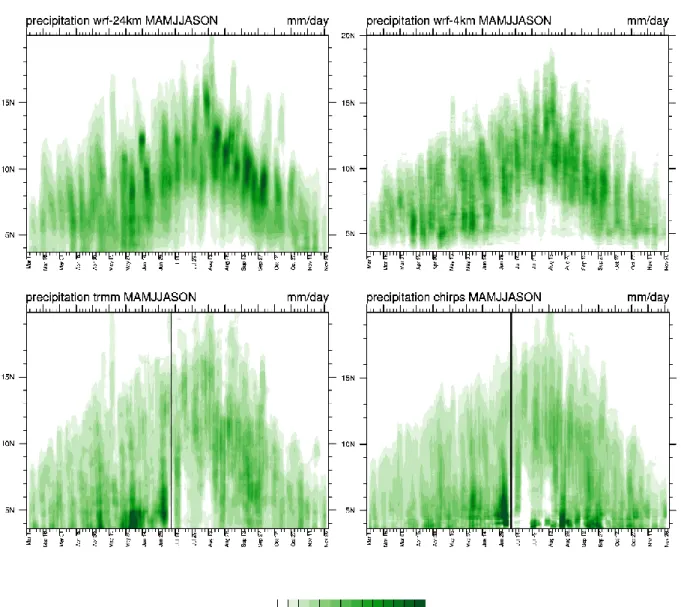
The seasonal evolution of the rain belt is displayed on Figure 2 as a time-latitude diagram 230
of 5-days run mean of precipitation averaged between 10ºW-10ºE. The date of the onset is 231
determined here by the transitional phase when precipitation decrease over the southern area 232
around 5°N followed by its intensification northwards as indicated by Sultan and Janicot (2000, 233
2003) and followed by Flaounas et al. (2012). It can be more or less pronounced, depending on 234
the year. 235
9 The proposed oceanic phase by De Coëtlogon et al. (2010) and Leduc-Leballeur et al. (2011, 2013) 236
is shown in both TRMM and CHIRPS dataset. From April to end of May, maxima of precipitation 237
are generally located to the south 5ºN and moved to around 5ºN belt till it jumps northwards in 238
mid-July. This first phase of the monsoon latitudinal and seasonal displacement is not well 239
reproduced by both as WRF outputs estimate the maxima of rainfall over land even during spring. 240
This premature inland incursion of rainfall belt generates wet bias over land and dry bias over the 241
ocean and coastal region during spring and June. After the pre-onset period, both CHIRPS and 242
TRMM show a weakening of the rainfall in early July and it is followed by a fair recovery with a 243
maxima core around 7ºN before moving northward. Thus, July 9th can reasonably be chosen as 244
Sahelian onset date with TRMM and CHIRPS. In WRF, the monsoon rainfall belt moves 245
northwards but lower than CHIRPS and TRMM data. It is then difficult to define a day for the 246
onset with the model simulations. The farthest inland penetration is observed August 15th and this
247
is replicated by both the observational datasets and WRF simulation. It is pertinent to note that the 248
observations (especially CHIRPS) show that during this period of maximum precipitation over 249
Sahel, there is a significant precipitation events along the Guinean Coast while WRF simulation 250
replicates a dry condition. After this date, the rainfall belts retreat gradually equatorward. 251
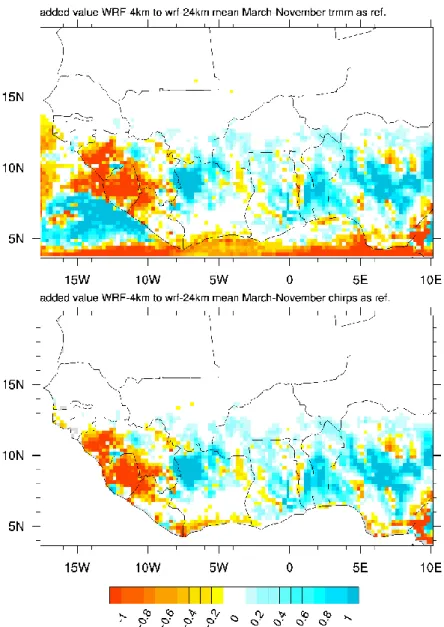
To assess the spatial value addition of the high resolution run as again the ‘coarse 252
resolution run’ and both WRF simulations as against ERA-interim (not shown), we computed the 253
added value (AV) based on the equation (1) proposed by Di Luca et al. (2013) and modified by 254 Dosio et al. (2014): 255 𝐴𝑉 = (𝑋𝑚𝑜𝑑1−𝑋𝑂𝐵𝑆)2−(𝑋𝑚𝑜𝑑2−𝑋𝑂𝐵𝑆)2 𝑀𝑎𝑥((𝑋𝑚𝑜𝑑1−𝑋𝑂𝐵𝑆)2,(𝑋𝑚𝑜𝑑2−𝑋𝑂𝐵𝑆)2)(1) 256 257
10 where X is the tested variable (here precipitation), the index mod1 is for the model with the coarser 258
resolution, the index mod2 for the simulation at higher resolution and OBS for Observations from 259
TRMM and CHIRPS. The AV is computed over the 9 months and all data are regridded over the 260
same grid (TRMM). Then the average value of AV for each grid point over the total period is 261
plotted on Figure 3. AV is positive where model#2’s squared error is smaller than the model#1’s 262
one and negative otherwise. The positive values (cool colours) suggest an improvement of 263
representation by the model#2 and the negative (warm colours) indicate where model#2 degrades 264
the information provided by the model#1. In this figure, the added value of wrf-4km to wrf-24km 265
is computed using both TRMM (top)and CHIRPS (bottom) as reference dataset. The value 266
addition of the wrf-4km as against wrf-24km which allows the evaluation of the usefulness of 267
convective-permitting run, indicates an improvement of the simulation of average rainfall using 268
the explicit run in comparison to wrf-24km in the half north of Ivory Coast, Ghana, Benin and part 269
of Nigeria. On the contrary, the area westwards of Ivory Coast towards southwards of Senegal 270
indicate that WRF-24km performs better. Above 14°N, the signal is too weak to allow a 271
conclusion. There is a very good agreement between the value added computed based on either on 272
TRMM or CHIRPS dataset. 273
This figure 3 thus shows that indeed, the run at high resolution generally, outperforms the
274
run at 24-km resolution over the Guinean band and southern Sahel, i.e. presents an upscaled
added-275
value. There is however, some area where the high-resolution run seems to degrade the information
276
instead of improving the simulation, especially over Ivorian coast, south-west of Guinea and Sierra
277
Leone. One of the main reason would be related to the fact that the better skills of the explicit run
278
are expected at daily and sub-daily scales and for extreme values while this AV is computed over
279
9 months. At seasonal scale, variability is mainly driven by large-scale dynamics that is not 280
necessary improved by the higher resolution. On the other hand, Figure 2 has shown that in
281
comparison to TRMM and CHIRPS datasets, WRF has shown result closed to the observation
282
across near-Sahel and Sahel (north of 8°N), but strongly underestimates precipitation across the
283
coastal area of the surrounding countries of the Gulf of Guinea and mainly over the sea during the
284
pre-onset period and at the end of the rainy season. This leads to strong dry bias from the sea to
285
about 6N (beyond the coast) during the rainy season over Sahel. One may suggest that the
286
introduction of this dry bias along the Gulf of Guinea seaboard toward the equator (from 5°N and
287
equatorward) into the model simulations (either parameterized and explicit convection), may be
11
directly related to the forcing conditions. Moreover, previous works as Meynadier et al. (2010 and
289
Marsham et al. (2013) revealed that the southward bias in the simulation of rainfall across West
290
Africa, is an inherent problem for RCMs. Thus, model parameterisation schemes can be point out.
291
Furthermore, convection-permitting simulation seems not to be able to correct effectively the dry
292
bias. Therefore, convective parameterization alone may not be enough to explain this dry bias.
293
Klein et al. (2015) found a similar dry bias in a cumulus, microphysics and boundary layer
294
parameterization ensemble analysis of WRF version 3.5.1 and related it to the driving conditions.
295
Here, if this dry bias could be related to a narrow north-south extent of the rain belt in WRF 296
specially in WRF-24km as discussed in Klein et al. (2015) it may be mostly related to the 297
microphysics and boundary layer parameterizations and not only to cumulus parameterization as 298
already suggested in Flaounas, et al. (2011) and Klein et al. (2015). This result motivated the 299
second set of runs, but this will be discussed later because we will first evaluate the impact of 300
convective-permitting simulations at higher time scales. 301
3.2 Rainfall diurnal cycle 302
Figure 4 shows the diurnal cycle of rainfall occurrences over the Gulf of Guinea sub region 303
for different categories of events based on their intensity. The 3-hourly average rainfall of each 304
dataset is computed over the considered region (4N-8N; 10W-10E). This box is based (1) on the
305
availability of ground-based observation which did not spread over the whole region and also (2)
306
to allow better comparison with previous works as Klein et al. (2015) and those that focused on
307
onset like Sultan and Janicot (2000, 2003). The obtained rainfall distributions have been divided 308
into three subsets according to the TRMM distribution which is considered as the reference here: 309
the light rain when the rain value is below or equal to the 25th percentile of the TRMM distribution 310
(3.46 mm/3hr), the medium rain with values between 25th and 75th (6.50 mm/3hr) percentiles, the
311
intense rain events for values above or equal the 95th percentile (9.50 mm/3hr). It is worth noting
312
that all the non-rain events have been beforehand removed in order to consider only the statistics
313
based on effective rain events. Since the resolution of the dataset can impact the number of events, 314
we computed these numbers using (1) the native grid of each dataset (solid line) and (2) the 315
regridded datasets on the TRMM grid (dashed line). 316
12
Lighter rain events occur mostly between mid-night and 12 UTC (note that local time in 317
JJA over this sub-region is close to time UTC) than during the second half of the day, with a 318
maximum of occurrence at 12 UTC according to TRMM observation dataset. Both WRF, in their
319
native grids, replicate the shape of the diurnal cycle of light rain events with a sudden decrease at 320
12 UTC, but the occurrence of events is strongly overestimated in the parameterized run. If the
321
explicit run capture well the timing of the maxima of the light rains, wrf-24km shows a 3-hours
322
early peak of light rain events. On the other hand, wrf-4km either with its native grid or the
323
regridded underestimates night lighter rain events. As of wrf-24km, the regridded data shows
324
more lighter rain events than its native data.
325
In the range of medium rain events, the diurnal cycle is of less variation in TRMM even 326
though a maximum is observed at 15 UTC and a minimum between 03 and 12 UTC. WRF-4km,
327
in its native grid spacing, shows a more pronounced peak of the maxima of medium rain events
328
and a wide rain events under the observation while its regridded product almost continuous less
329
rain events related to the native wrf-4km. However, native and regridded grid from wrf-4km
330
indicated the maxima of medium rain events at 15 UCT. Wrf-24km shows same pattern of diurnal
331
cycles of the occurrence of the medium rain events either for the native and the regridded data.
332
Nonetheless, a reduction in the number of rain events is noticed with the reggrided product. All
333
datasets agree on the timing of occurrence of minimum medium rainfall events in between 03 and
334
12 UCT. Yet, wrf-24km displays the maximum events in the interval 15 and 18 UTC. 335
According to TRMM observation data set, intense rain events can occur anytime with 336
nearly the same probability but none of the simulations reproduces this. The explicit run exhibits 337
intense rain occurrence mainly from the evening to early morning with a maximum around 00 338
UTC. The same timing of the diurnal cycle is retrieved with the regridded wrf-4km with more
339
intense rain events.
340
The relative absence of intense rain events with wrf-24km is related to the lower value of 341
the 95th percentile obtained by this convective parameterized run. The analysis of the occurrences
342
of intense rain based on the 95th percentile of wrf-24km (figure not shown) demonstrates that this 343
parameterized run mostly locates its maxima rain events in the afternoon (maximum at 15 UTC). 344
This occurrence of maxima of intense rain events at 15 UTC with the parameterized run is mainly
345
due to the fact that convection is generally high when net radiative energy is at its maximum at
13
about 15 UTC. The observed natural characteristics of rainfall are hardly replicated by models. 347
This has been earlier highlighted in previous studies and suggested to be due to parameterisation 348
of convection in the models (Marsham et al., 2013, Dirmeyer et al., 2012, Stephens et al., 2010). 349
Wrf-4km seems to produce maximum of rain independently to the peak of the net radiative energy, 350
except for medium rain-rates. In term of diurnal mean amount and timing of rain events, wrf-4km 351
depicts results closest to the observations in comparison to wrf-24km. 352
Reggriding WRF outputs into the grid scale of TRMM dataset has an effect on the number
353
of the events regardless of the range of rainfall intensity, however, the timing is preserved.
354
3.3 Summary of the skill of the simulations on rainfall 355
Figure 5 shows the daily Empirical Probability Distribution Functions and the boxplots of 356
daily wrf-24km and wrf-4km precipitation compared to the ground-based observations, TRMM 357
and CHIRPS data sets. Based on the available data and the regime of the rainy season, the area has 358
been divided into two zones: the Guinean Coast (4°N-8°N and 10°W-10°E) and the Sahelian 359
region including the near Sahel (10°N-18°N and 10°W-10°E). Only the available stations of each 360
sub region are considered (CI1-7, BN1-3, GH2-5, GH7-8, GH12-62 for the Guinean Coast zone 361
and GH1, GH6, GH9-11, BF1-7, NR1-7, GH40-44 for the Sahel region). For all datasets, the 362
amount of precipitation at the nearest grid point of each station has been extracted. Following Lind 363
et al. (2016), the PDF(fig.5, top) gives a detail on the spread/intensity of the daily rainfall for each 364
of the dataset while the box plot (fig.5, bottom) for its part shows the summary of the distribution 365
of rainfall (extremes, mean state). The percentiles on the box plots have been computed by 366
considering only the wet days (the day where rainfall is above the threshold 1mm) over the period 367
March-November. For each dataset, the number of events which overpass the 95th percentile of 368
ground-based observations is also indicated. The numbers on the figure provides a clear view of 369
the ability of the model to statistically replicate intense rain events. They indicate the occurrence 370
of intense rain events with the specifics dataset. 371
Over the Guinean Coast area, there is a relative underestimation of the overall rainfall 372
tendency by both TRMM and CHIRPS estimation compared to the ground-based observations. 373
They show value generally below the ground-based observation(top). The box plots (summary) 374
show only 2.95% of rain events for TRMM and CHIRPS as intense and also 95% of the rain 375
14 intensities are below 39 mm/day for TRMM and ~35mm/day for CHIRPS). There are marginal 376
differences between both satellite-based dataset as the exhibit very close frequency occurrence 377
pattern of rainfall and similar summary in both Guinean Coast area and Sahel. Across both sub-378
domain (Guinea Coast and Sahel), WRF-24km shows also less intense rain events as indicated 379
with the PDF, the small boxes and the low value of its mean rainfall amount. In Guinea Coast, 380
95% of the rain events are less than 21.78 mm/day and only 0.18% of the rain events are intense, 381
while the ground-based observation shows the 95th percentile at 54.5 mm/day and a mean value of
382
about 16.45 mm/day. The statistics displayed by the observations are well replicated by the wrf-383
4km, which shows 13.45 mm/day as mean value, and 4.66% of values are above the threshold of 384
54.4 mm/day. Thus, the explicit convection run, despite its dry bias at seasonal scale along the 385
Guinean coastal area during the Sahelian phase of the monsoon, replicates more realistic 386
precipitation extremes and qualitative distributions compared to the convective parametrized 387
convection run. 388
Over the Sahelian region, the explicit run shows daily rainfall frequency distribution closer 389
to TRMM, CHIRPS and the ground-based observation. The summary provides more intense rain 390
events where 95% of the rain are up to 52.31 mm/day and the simulation runs at 24km shows less 391
intense rain events compared to the ground-based observation. 2.95% (wrf-24km) and 11.61% 392
(wrf-4km) of rain events are above the threshold of 40 mm/day corresponding to 95th percentile of 393
rainfall in the Sahelian region. The numbers of rain events based on wrf-4km are 4416 in the Gulf 394
of Guinea; and 1499 in the Sahel. This matches better those of the observation with 3683 in the 395
Gulf of Guinea; and 1119 in the Sahel than wrf-24km which shows 8250 in the Gulf of Guinea; 396
and 2455in the Sahel. Even though wrf-4km overestimates the number of intense rains and the 397
intensity, it provides more realistic estimations precipitation extreme across both Guinea Coast 398
and Sahel and emphasizes the benefit of the high-resolution simulation. 399
The low value of the occurrence of intense rain with wrf-24km compared to the high-400
resolution run may be explained by the difference of the size of the grid scale. With a coarser grid 401
scale, there is a higher probability that sub grid scale rainfall events might not be captured. (Chen 402
and Knutson 2008). Previous studies (Emori et al. 2005; Iorio et al. 2004; Kharin et al. 2005) which 403
assessed climate models by using ground-based stations data concludes that it is not a simple task 404
to make a comparison between model output and station data set. They also reported that rainfall 405
15 extreme indices might be influenced by the model resolution. The station records are essentially 406
point estimates while the model output represents the rainfall variability over a wider spatial scales. 407
Chen and Knutson (2008) also argued that Regional climate models are able to dynamically 408
downscale extreme precipitation events to a spatial scale that is more comparable with observed 409
rainfall analysis or station data. The grid scaling issues should be then reduced. Furthermore, even 410
though it is not easy to cut off the physics from the pure resolution effect behind the differences 411
between the runs at 24km and 4km, it nevertheless emphasizes the usefulness of running the model 412
at higher resolution at least to focus on the extreme events. On the other hand, both rainfall from
413
wrf-24km and wrf-4km have been upscaled to TRMM dataset grid scale to assess the impact of
414
the downscaling effect in the differences between those two (2) WRF outputs. Similar analysis as
415
figure 5 has been made with the reggrided data and the results (figure not shown) indicated
416
marginal changes between the native and reggrided rainfall. For example, the comparison of the
417
value of the 95th percentile with native and regridded shows is a reduction of about 7.41% (Gulf
418
of Guinea) and 5.3% (Sahel) for wrf-24km while wrf-4km indicates a decrease of 7% (Gulf of
419
Guinea) and 2.5% (Sahel). This result may suggest a combination of both grid scale factors and
420
physics on the observed differences between the runs at 24km (parameterized convection) and
421
4km (convection-permitting).
422
4. Dynamical and physical role of the West African Monsoon 423
4.1 Dynamics of the monsoon and moisture flux 424
The link between the dynamics of the WAM and its associated rainfall has been variously 425
investigated and emphasized the role of the atmospheric circulation and specifically the Moisture 426
Flux Convergence (MFC) (Cook, 1999; Druyan et al., 2010 ; Fontaine et al., 2008 ; Fontaine & 427
Philippon, 2000 ; Lebel et al., 2003 ; Nicholson, 2008, 2009, 2013 ; Nicholson et al., 2012 ; Sylla 428
et al., 2010). 429
Figures 6 shows cross sections of the zonal wind from March-May (MAM), June-August
430
(JJA) and September-November (SON) and averaged from 10°W to 10°E. The first column
431
represents the seasonal mean, while the second and third columns represent respectively the
432
seasonal mean bias of wrf-4km and wrf-24km related to Era-Interim. Figure 7 shows seasonal
16
mean of vertical profiles of the MFC, superimposed by the meridional-vertical wind vectors (v,w).
434
For a better comparison, all data have been interpolated to the wrf-24km dataset. 435
The atmospheric circulations related to the WAM, characterized by the monsoon flow, the 436
African Easterly Jet (AEJ) and the Tropical Easterly Jet (TEJ) are clearly replicated by the model 437
outputs. 438
During spring (MAM), the core of the monsoon flow as shown by ERA-interim is ~ 4m.s-1
439
while WRF is showing higher monsoon flow toward the coast (wrf-24km: up to 5m/s and wrf-4km
440
up to 3m/s) and lower flow in the north (up to 4m/s bellow for both wrf-24km and wrf-4km) (Fig.
441
6). Deep convection, associated with strong updrafts corresponding to the ascending branch of the 442
Hadley cell, occurs between 6°N to 10°N and 800 hPa to 200 hPa. This feature is well reproduced 443
by the model outputs either wrf-24km or wrf-4km (Fig. 7). 444
During the summer (JJA), ERA-interim shows two distinguished cores of the monsoon flow. 445
The major one is located around 15°N and the minor one at roughly 5°N. Wrf-4km reproduces
446
these two cores; however, the cores have the same intensity, the southern one is located further
447
north than for ERA-interim, around 7.5°N, while the second one is around 13°N (figure not
448
shown). The AEJ is stronger in ERA-interim than in WRF simulations, while TEJ is weaker
449
(Fig.6).Wrf-4km is showing difference up to 1m/s while wrf-24km reaches 2m/s in term of AEJ.
450
Both WRF output show similar replication of TEJ (up to 2m/s lower). As expected, the area of 451
deep convection has now moved to more northerly position from its position during the spring 452
(MAM). Both model outputs replicate this feature with more inland penetration (up to 15N) than
453
Era- Interim (below 13N and less pronounced (Fig. 7). This inland location of the deep convection
454
is also coherent with the distribution of rainfall with WRF. A subsidence is observed around 5°N
455
with wrf-24km and wrf-4km while in ERA-interim, it is located further beyond the equator (around 456
2ºS). All these differences are coherent with the more southward position of the maximum of 457
rainfall in ERA-interim (Figs. 2 and 3) and explain the dry bias of ERA-interim over Sahel which 458
17 is consistent with stronger AEJ and weaker TEJ ((Omotosho 2008)) and the dry bias of WRF above 459
the sea. Indeed, the subsidence at 5°N generates a zone of strong divergence around the coastline 460
(1000-800 hPa, 2°N-8°N) in the simulation, which is weaker and more to the south in ERA-461
interim. Note also that just above this layer, a layer of weak convergence around 700 hPa is 462
simulated with northerly wind and likely corresponds to the low-level shallow circulation (LLSC) 463
induced by the Saharan heat low and discussed by (Zhang et al. 2006). This LLSC is not captured 464
by the reanalysis. 465
During fall (SON), the configuration is similar to the spring one with less intensity. The
466
southwesterly monsoon flow is confined southwards of 5°N with Era-Interim and stronger in WRF
467
with more inland penetration. Wrf-24km shows more intense monsoon flow with a bias up to
4-468
5m/s and the explicit run shows bias below 3m/s relative to Era-Interim.
469
To conclude on the dynamics at seasonal and regional scales, several features can explain the 470
differences in the seasonal precipitation patterns between ERA-interim and WRF simulations, 471
despite the spectral nudging. This result reveals more or less important interactions between scales 472
over this area and an impact of regional/local processes in the dynamics of this region. Therefore, 473
the impact of physical processes seems not negligible in the representation of all elements of the 474
WAM. The differences between the two WRF domains, which share the same physics but not
475
convection, are mainly reduced to the low-level circulation, which has a stronger zonal component
476
in WRF-24km than in WRF-4km. It affects the intensity of moisture convergence between 5 and 477
10°N. Furthermore, wrf-4km shows less deviation from Era-Interim than wrf-24km in the
478
replication of the main features of the WAM. However, these differences generally less
479
pronounced or even marginal. Next section investigates the impact of physical processes by 480
performing several simulations with different physics using the same large scale forcing. 481
4.2 Impact of physical processes 482
483
One of the major challenge of the current Convection-Permitting Models (CPMs) are the fact 484
that they are still relying in older and traditional approach parametrization developed for 485
18 boundary layer turbulent in mesoscale models. Furthermore, they are running at grid spacing that 486
are not large enough to be in mesoscale model regime nor fine enough to be fallen into large-487
scale eddy simulation regime as discussing in Tao and Moncrieff (2009) 488
4.2.1 Sensitivity of WRF parametrizations on precipitation over the southern coastal area 489
490
The aim in this section is to identify configurations that would be suitable for a better 491
representation of intense rain events over the Guinean coast area. The past conducted works like 492
Flaounas et al. (2011); Pohl et al. (2011); Klein et al. (2015), used parameterized convection. Prein 493
et al. (2015) in a review CPMs underlined the limitation of our understanding about the 494
microphysical processes and their interaction with resolved cumulus dynamics while Tao and 495
Moncrieff (2009) indicated the grid spacing issue in the representation of boundary layer turbulent. 496
The current work focuses on the sensitivity of microphysics and PBLs to the resolved cumulus and 497
contribute to the understanding of the microphysics processes and their interaction with resolved 498
cumulus dynamics. Even though, the change of the convection scheme may modify the results, 499
this will need too much resources and beyond the scope of this paper. 500
A second set of experiments has thus been performed but with smaller domains due to 501
computing resources. The inner domain has been reduced to the Guinean coast area extending 502
from the Ivory Coast to the Republic of Benin (Figure 1, pink rectangles). The period of the 503
experiment is June 2014 when many flood events have been recorded along the littoral of the Gulf 504
of Guinea and especially in Abidjan. The following different experiments use the configuration of 505
the first set except for the microphysics (MP) and planetary boundary layer (PBL) schemes, which 506
contribute to the vertical and horizontal distributions of moisture, which is a key issue in the 507
Tropics for rainfall processes ((Neelin et al. 2009); (Holloway and Neelin 2009). Nine 508
combinations of MP_PBL have been tested, using 3 different PBL schemes and 3 different MP 509
schemes. These 9 combinations are thus associated with the Kain-Fritsch convective scheme in 510
the coarser domain and with explicit convection in the inner domain. Since these parameterizations 511
manage the atmospheric moisture distribution based on the same large-scale information provided 512
by same lateral boundary conditions and the use of spectral nudging for wind and temperature, this 513
protocol is well suited to understand the role of the physical processes in the simulated rainfall 514
estimate over this specific area. 515