HAL Id: hal-00317119
https://hal.archives-ouvertes.fr/hal-00317119
Submitted on 1 Jan 2003
HAL is a multi-disciplinary open access
archive for the deposit and dissemination of
sci-entific research documents, whether they are
pub-lished or not. The documents may come from
teaching and research institutions in France or
abroad, or from public or private research centers.
L’archive ouverte pluridisciplinaire HAL, est
destinée au dépôt et à la diffusion de documents
scientifiques de niveau recherche, publiés ou non,
émanant des établissements d’enseignement et de
recherche français ou étrangers, des laboratoires
publics ou privés.
Interhemispheric comparison of spectral width boundary
as observed by SuperDARN radars
K. Hosokawa, E. E. Woodfield, M. Lester, S. E. Milan, N. Sato, A. S.
Yukimatu, T. Iyemori
To cite this version:
K. Hosokawa, E. E. Woodfield, M. Lester, S. E. Milan, N. Sato, et al.. Interhemispheric comparison
of spectral width boundary as observed by SuperDARN radars. Annales Geophysicae, European
Geosciences Union, 2003, 21 (7), pp.1553-1565. �hal-00317119�
Annales
Geophysicae
Interhemispheric comparison of spectral width boundary as
observed by SuperDARN radars
K. Hosokawa1, E. E. Woodfield2, M. Lester2, S. E. Milan2, N. Sato3, A. S. Yukimatu3, and T. Iyemori4
1Department of Geophysics, Graduate School of Science, Kyoto University, Kyoto, Japan 2Department of Physics and Astronomy, University of Leicester, Leicester, UK
3National Institute of Polar Research, Tokyo, Japan
4Data Analysis Center for Geomagnetism and Space Magnetism, Graduate School of Science, Kyoto University, Kyoto, Japan
Received: 30 April 2002 – Revised: 15 January 2003 – Accepted: 6 February 2003
Abstract. Previous studies have shown that dayside
equa-torward edge of coherent HF radar backscatter having broad Doppler spectral width is coincident with the equatorward edge of the cusp particle precipitation. This enables the boundary between broad and narrow spectral width backscat-ters (spectral width boundary) in the dayside magnetic local time sector to be used as a proxy for the open/closed field line boundary. The present case study employs magnetically conjugate SuperDARN coherent HF radars to make an inter-hemispheric comparison of the location and variation of the spectral width boundaries. Agreement between the magnetic latitudes of the boundaries in both hemispheres is remark-able. Correlation coefficients between the latitudes of the boundaries are larger than 0.70. Temporal variation of the spectral width boundary follows the same equatorward trend in both hemispheres. This is consistent with the accumu-lation of open flux in the polar cap by dayside low-latitude magnetopause reconnection, expected when IMF Bzis
neg-ative. Boundaries in both hemispheres also exhibit short-lived poleward motions superposed on the general equator-ward trend, which follows the onset of substorm expansion phase and a temporary northward excursion of IMF Bz
dur-ing substorm recovery phase. There is an interhemispheric difference in response time to the substorm occurrence be-tween two hemispheres. The spectral width boundary in the Southern Hemisphere starts to move poleward 10 min earlier than that in the Northern Hemisphere. We discuss this differ-ence in terms of interhemispheric asymmetry of the substorm breakup region in the longitudinal direction associated with the effect of IMF By.
Key words. Ionosphere (ionosphere-magnetosphere
inter-actions; plasma convection) – Magnetospheric physics (mag-netopause, cusp, boundary layers)
Correspondence to: K. Hosokawa
1 Introduction
It is very important for the study of magnetosphere-ionosphere coupling processes to identify the location of the open/closed field line boundary (OCFLB) in the ionosphere. Determining the OCFLB around the dayside ionosphere en-ables us to estimate several geophysical parameters such as (1) the rate of reconnection at the magnetopause; (2) the size of polar cap; (3) the creation and destruction of open mag-netic flux associated with the dayside and nightside recon-nection. In practice, however, the OCFLB can be difficult to locate in the ionosphere continuously. Although there are a number of signatures that can be employed as proxies for the OCFLB, some of these still require verification (Rodger, 2000). Direct observations of cusp particle precipitation by low-altitude spacecraft, such as DMSP (e.g. Newell and Meng, 1988, 1991), are most widely utilized as a proxy for the OCFLB. The optical auroral signature triggered by the cusp particles precipitation has also been a good guide for the identification of the OCFLB (Sandholt et al., 1998). The dayside auroral zone provides a good target for HF radars (Milan et al., 1998) and a relationship between the magneto-spheric cusp particle precipitation into the ionosphere and the HF radar backscatter from the ionospheric F-region has been reported by a number of authors (Baker et al., 1990, 1995; Rodger et al., 1995; Yeoman et al., 1997). They demon-strated that the equatorward edge of radar backscatter show-ing broad Doppler spectral width is coincident with the equa-torward edge of the cusp particle precipitation. The equator-ward edge of the HF radar backscatter also appears to corre-spond closely to the equatorward edge of red line aurora and hence, the OCFLB (Rodger et al., 1995; Milan et al., 1999), though it is possible that this relationship breaks down for northward IMF (Moen et al., 2001).
Previously, many papers have examined the spectral width boundary (boundary between broad and narrow spectral width), which is identical to the HF radar signatures of the OCFLB around the dayside ionosphere, through case stud-ies (Baker et al., 1997; Chisham et al., 2001) and statistical
1554 K. Hosokawa et al.: Interhemispheric comparison of spectral width boundary
Fig. 1. The map of the Northern Hemisphere showing the location of the CUTLASS Iceland East radar field-of-view (blue line) in geographic
coordinate system. Superimposed on this is the field-of-view of the SENSU Syowa East radar (orange line) as mapped onto the Northern Hemisphere. Three beam pairs used in the interhemispheric comparison of the spectral width boundary are displayed on the fields-of-views of both radars. The beams that belong to the Iceland East are indicated as a blue line and those to the Syowa East as an orange line.
analysis (Yeoman et al., 2002). However, there have been only a few simultaneous observations of the spectral width boundary using data from magnetic conjugate radars (Pin-nock et al., 1999; Milan and Lester, 2001). These authors assumed the spectral width boundary to be a proxy for the true OCFLB and estimated the dayside reconnection elec-tric field from the convection flow across the OCFLB. How-ever, they have not investigated in detail how the behavior of the spectral width boundary is collocated between conjugate hemispheres and how the temporal variation of the bound-ary is different between the two hemispheres. All of the previous conjugate studies of spectral width employed the data of Polar Anglo-American Conjugate Radar Experiment (PACE) radars located at Goose Bay, Canada, and Halley, Antarctica which are a part of SuperDARN chain (Green-wald et al., 1995). In contrast, we employed another mag-netic conjugate radar pair in the SuperDARN chain which is composed of the Iceland East radar of the Cooperative U.K. Twin-Located Auroral Sounding System (CUTLASS) (Mi-lan et al., 1997) and Syowa East radar of Syowa-South and East HF Radars of NIPR for SuperDARN (SENSU). We di-rectly compared the location and motion of the spectral width boundaries identified in magnetic conjugate ionospheres and investigated the degree of the interhemispheric collocation of the spectral width boundaries. Furthermore, the factors con-trolling the motion of the boundary, such as interplanetary magnetic field variation and the occurrence of substorm have been examined in detail. Consequently, a significant inter-hemispheric difference in the response time to the occurrence of substorm expansion was identified.
2 Experimental arrangement
We present the data from CUTLASS Iceland East radar at Pykkibaer, Iceland (63.86◦N; 19.20◦W) and SENSU Syowa East radar at Antarctica (69.01◦S; 39.61◦E). These radars
are a part of the international Super Dual Auroral Radar Network (SuperDARN), which covers a vast portion of the northern and southern auroral zones and polar cap. The Su-perDARN coherent HF radars (Greenwald et al., 1995) em-ploy backscatter from high-latitude field-aligned ionospheric plasma density irregularities as tracers of the bulk plasma motion under the influence of the convection electric field, and hence, as a diagnostic tool for the investigation of large-scale magnetosphere-ionosphere coupling. Figure 1 presents the fields-of-view of CUTLASS Iceland East and SENSU Syowa East mapped into the geographic coordinate system in the Northern Hemisphere. The conjugate fields-of-view overlap considerably and have very similar pointing direc-tions. This allows for an almost direct comparison of the backscatter features observed by the two radars. On the day presented in this paper (10 October 1999), the radars were operating in a high time resolution normal scan mode. In the current version of this mode, the radar scans through 16 beams every 1 min, with an integration time of 3 s for each beam, which are binned into 75 range gates. We determined three beam pairs that have nearly parallel conjugate beams and used them for this interhemispheric comparison. These conjugate beam pairs are shown in Fig. 1. Beam pair I is composed of Iceland East beam 0 and Syowa East beam 4, beam pair II is Iceland East beam 7 and Syowa East beam 6, beam pair III is Iceland East beam 10 and Syowa East
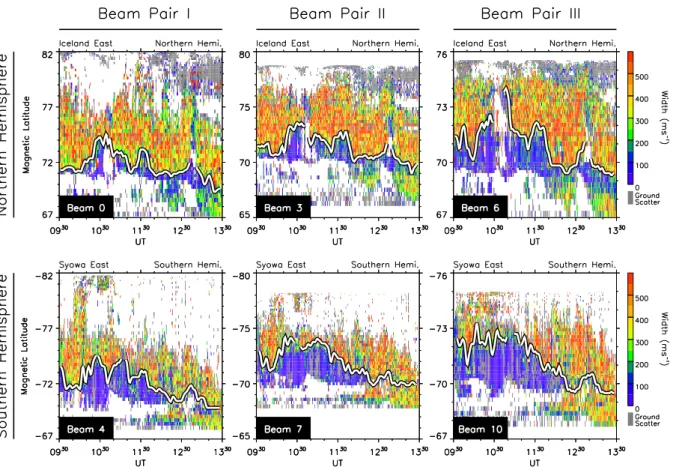
Fig. 2. The latitude versus time spectral width plot for the beams of each conjugate beam pair during the period of the present study, from
09:30 UT to 13:30 UT, 10 October 1999 (top panels) for beam 0, 3 and 6 of Iceland East in the Northern Hemisphere, (bottom panels) for beam 4, 7 and 10 of Syowa East in the Southern Hemisphere. A white line in each panel presents the spectral width boundary estimated using the algorithm described in the text.
beam 6. Coverage of these beam pairs at F-region altitude is ranging approximately from 72◦to 83◦in magnetic latitude
around the dayside magnetic local time sector. Beam pair I is pointing closest to the magnetically meridional direction (the angle between the beam direction and the magnetic meridian is approximately 45◦), and hence, is most favorable for the direct comparison of the latitudinal movement of the spectral width boundary.
3 Observations
3.1 Determining spectral width boundary
Figure 2 displays the magnetic latitude (AACGM coordinate system, based on Baker and Wing, 1989) versus time spectral width plot for the beams of each conjugate beam pair I, II and III during the interval of this study, 09:30 UT to 13:30 UT, 10 October 1999. The spectral width is colour-coded and grey indicates backscatter from the ground. The top three pan-els show the observations from Iceland East in the North-ern Hemisphere and the bottom three panels from Syowa East in the Southern Hemisphere. During this UT period, the fields-of-view of the two radars cover the magnetic lati-tudes ranging from the average latitude of the central plasma
sheet (CPS) and low-latitude boundary layer (LLBL) to the polar cap through the cusp around the dayside ionosphere. In each scan, the broad spectral width region at higher latitudes (characterized by a mixture of the colours such as green, yellow and red) is clearly distinct from the narrow spectral width region at lower latitudes (characterized by an almost uniform blue appearance), and then well-defined boundaries between narrow and broad spectral width can be identified for all beam pairs.
In order to compare the spectral width boundaries in two hemispheres, we need an algorithm that can identify the lo-cation of the boundaries. Previous studies have placed the boundary at the first range gate where the spectral width ex-ceeds specific criteria, such as 150 m s−1(Baker et al., 1997; Pinnock et al., 1999) and 250 m s−1(Chisham et al., 2001). This approach is based on the occurrence distributions of the spectral widths within the cusp and the region equatorward of the cusp (such as the LLBL and the CPS, i.e. the re-gions of closed field lines) reported by Baker et al. (1995). They pointed out that the occurrence distribution of spectral widths within the cusp is a broad Gaussian shaped distribu-tion. The average spectral width is located around 220 m s−1, with the majority of the spectra found in the range from about 120 to 320 m s−1. In contrast, the distribution
equa-1556 K. Hosokawa et al.: Interhemispheric comparison of spectral width boundary
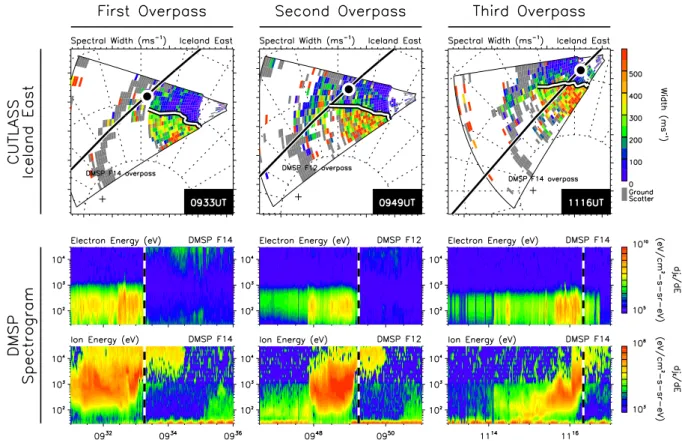
Fig. 3. (Top panels) maps of spectral width observation by Iceland East on magnetic latitude and MLT coordinates for the time interval of
DMSP satellite overpass. Dotted circles represent 60◦, 70◦and 80◦latitudes and radial dotted lines represent MLT meridians, 12:00 MLT being directed towards the top of the panel. Superimposed black line on white in each panel is the track of the overpassing DMSP satellite. White line on black represents the estimated location of the spectral width boundary and black point on white indicates the point where the DMSP identified particle trapping boundary. (Bottom panels) Electron and ion measurements from the overpassing satellite. These are spectrograms between ≈ 10 eV and 30 keV. From these observations, particle trapping boundary have been identified, which are indicated as a dashed line.
torward of the cusp is more similar to an exponential distri-bution with a peak occurring at about 50 m s−1. Hosokawa et al. (2002) have carried out a statistical analysis of the spec-tral width distribution obtained from Iceland East and Syowa East. They have shown that 80% of spectral width values ob-tained within the non-cusp region are less than 200 m s−1in both radars. Hence, we have used 200 m s−1as a criterion to determine the location of the spectral width boundary.
An algorithm is then employed which finds the first ap-pearance (in increasing latitude) of two consecutive range cells where the spectral width is greater than or equal to 200 m s−1. The boundary is then determined to be at the start of the first of these radar range cells. The result is temporally smoothed (window for smoothing is 5 min, i.e. 5 samples) and plotted as a white on black line in each panel. Accu-racy of the backscatter location should be estimated before investigating the behavior of the boundaries in detail. Yeo-man et al. (2001) investigated simultaneous observation with the CUTLASS radars and EISCAT Tromsoe heating facility and estimated potential error of the standard algorithm for the determination of the backscatter location normally em-ployed in the SuperDARN community. They found that the accuracy is within 60 km for one and a half hop ionospheric
backscatter. They also calculated the HF propagation path from the CUTLASS Iceland East radar for several elevation angles. During the interval of this study, the elevation angle is about 30◦and the spectral width boundaries appear at ap-proximately 1000 km in slant range in Iceland East radar (fa-cility for angle of arrival determination has not been installed in Syowa East radar). If we refer to the propagation path esti-mated by Yeoman et al. (2001), echoes around the boundary are considered to be one and a half hop ionospheric backscat-ter. Then, the accuracy could be estimated to be ±60 km in our observation, corresponding to 1.08◦in latitude.
It is clear that the estimated spectral width boundary pro-vides a clear demarcation line between the narrow spectral width region at lower latitudes and the broad spectral width region at higher latitudes. One thing worth noting is that the main part of the narrow spectral width echoes equatorward of the boundaries are not ground scatter; hence, the bound-aries identified here are not between different scattering tar-gets, e.g. ground and ionospheric scatter. The spectral width boundary is located at magnetic latitudes between approxi-mately −69.5◦and −75.0◦in the Southern Hemisphere, and between 69.0◦and 75.5◦in the Northern Hemisphere. The average latitudes of the boundaries are very similar between
the two hemispheres. We return to a more detailed analysis later in this paper.
3.2 Low-latitude particle precipitation
In the course of this study, we investigate the interhemi-spheric similarity and difference in the location of the day-side OCFLB using the radar spectral width boundary as a proxy. The spectral width boundary in the radar data has been widely used as a proxy for the OCFLB in recent pa-pers, although its validity has not been so well established. Hence, the boundaries identified here have to be calibrated using other proxies for the OCFLB. There are a number of signatures which can be employed as proxies for the OCFLB (Rodger, 2000). The most popular one is the trap-ping boundary of the high energy (≈10 keV) particle pre-cipitation (Evans and Stone, 1972). Here, we employ three overpasses of the Defense Meteorological Satellite Program DMSP F12 and F14 satellite (Hardy et al., 1984) and esti-mate the validity for using the spectral width boundary as a proxy for the true OCFLB. The data from the DMSP space-craft are available only in the Northern Hemisphere during this interval.
The results of the comparison are summarized in Fig. 3. The top three panels display the maps of the spectral width observation by CUTLASS Iceland East radar for three DMSP overpasses at 09:33 UT, 09:49 UT and 11:16 UT, re-spectively. The bottom three panels show energy spectro-grams of electrons (upper) and ions (lower) observed by the DMSP F12 and F14 satellite as they traversed the radar field-of-view. As the satellite approaches the noon sector, a dis-persed ion feature is commonly observed in all overpasses. Such features are characteristic of precipitation on newly-reconnected field lines for southward IMF (e.g. Reiff et al., 1977; Woch and Lundin, 1992), the dispersion being a conse-quence of the velocity filter effect. The lower latitude cutoff of this ion feature provides a sharp demarcation between high and low fluxes of high energy (>10 keV) particles, which is considered to be a trapping boundary. Dashed lines in the spectrograms indicate the trapping boundary as identified by the DMSP satellites. Black points on the spacecraft overpass in the polar map give the location of the spacecrafts when they identify the trapping boundary. White on black lines in the polar map indicate the latitude of the spectral width boundary identified for each scan of the radar.
In all overpasses, spectral width boundaries exhibit L-shell aligned variation with longitude. Although not shown here, in the Southern Hemisphere the variation of the spectral width boundary with longitude is also L-shell aligned. How-ever, the spectral width boundary is located slightly poleward of the particle trapping boundary, with the offset being 1– 1.5◦ in magnetic latitude. What is worth noting is that this tendency is found to be the case for all overpasses. Andr´e et al. (1999, 2000a, 2000b) simulated the effect of a time-varying electric field, with frequencies of the order of ≈0.1– 5 Hz, on the autocorrelation function (ACFs) derived from the coherent HF radars’ pulse sequence and proposed that
large spectral widths can be caused by such an electric field. They then link the large spectral widths observed within the cusp to the wave activity observed by polar-orbiting satellites passing through the cusp (e.g. Maynard et al., 1982; Mat-suoka et al., 1993) and ground magnetometer data showing Pc1/Pc2 activity underneath the cusp (e.g. Menk et al., 1992; Dyrud et al., 1997). Matsuoka et al. (1993) have pointed out that correlation between these wave activities and enhance-ment of the flux of precipitating cusp ions and electrons is good during the intervals of the southward IMF Bz
compo-nent. Lockwood (1997) and Rodger and Pinnock (1997) have shown that the finite poleward convection velocity of recently reconnected flux tubes leads the bulk of the cusp particles to the region some distance poleward of the true OCFLB at ionospheric altitudes. Rodger and Pinnock (1997) assumed that the cusp particle precipitation travels at the speed of the ions, and then estimated this offset to be ≈150 km near noon. If we assume that the broad spectral width is caused by the time-varying electric field closely related to the cusp parti-cle precipitation, the offset between spectral width boundary and particle trapping boundary seen in the present observa-tion can be explained by the effect of finite poleward flow suggested by Lockwood (1997). This length of the offset (1–1.5◦) is consistent with those estimated by Rodger and Pinnock (1997).
Since there is no overpass of the DMSP satellite in the Southern Hemisphere during this interval, we do not know whether or not the offset between the spectral width bound-ary and the particle trapping boundbound-ary exists also in the Southern Hemisphere. Coleman et al. (2000) have shown that the ionospheric footprint of the reconnection X-line varies in length with dipole tilt angle. This effect can intro-duce an interhemispheric difference in ionospheric convec-tion velocities in the solstice condiconvec-tions, which has been con-firmed by Pinnock et al. (1999) at the summer solstice. How-ever, the present observation was done at equinox. Hence, the poleward convection velocity of the newly-reconnected flux tubes is expected to be equal between the two hemispheres. This suggests that the offset between the true OCFLB and the spectral width boundary is also equal in both hemispheres. Then, it is valid to use the spectral width boundary as a proxy for the OCFLB and to discuss the interhemispheric differ-ence in the behavior of the OCFLB, keeping in mind the pos-sibility that we may underestimate the latitude of the OCFLB by a small amount.
3.3 Interhemispheric comparison of the spectral width boundary
For better understanding of the behavior of the spectral width boundaries in both hemispheres, we projected the spectral width boundary identified in the Northern Hemisphere into the Southern Hemisphere using the Tsyganenko 89 magnetic field model (Tsyganenko, 1989) and compared directly the locations of the boundaries in both hemispheres. The reason why the direct comparison was done in the Southern Hemi-sphere and not in the opposite hemiHemi-sphere is that there is
1558 K. Hosokawa et al.: Interhemispheric comparison of spectral width boundary
Fig. 4. (Top two panels) The By and Bz components of the IMF as measured by the ACE and Wind spacecraft (solid and dashed line,
respectively), lagged to the magnetopause. Two vertical dashed lines indicate the time of the northward excursion of the IMF Bz(“NE1” and
“NE2”). (Middle three panels) The magnetic latitude of the spectral width boundaries identified for each conjugate beam pair, respectively. In each panel, the blue line indicates the boundary identified in Iceland East and the orange line indicates the boundary identified in Syowa East. Attached grey bars indicate uncertainties in the determination of the boundary latitude. (Bottom panel) H -component magnetograms from the CANOPUS networks, along with filtered data showing Pi2 activity (scaled by a factor of 5 for clarity). Vertical dashed lines indicate the onset of the two substorm breakup (“SB1” and “SB2”).
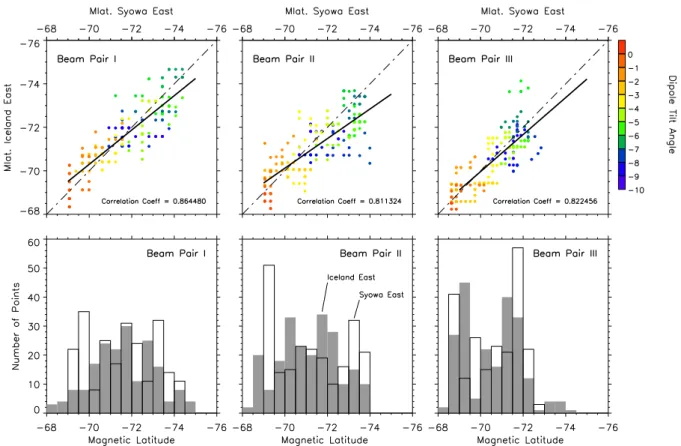
Fig. 5. (Top three panels) The scattergram of the magnetic latitudes of the spectral width boundaries identified in both hemispheres for each
conjugate beam pair, respectively. Vertical axis is the magnetic latitude of Iceland East and horizontal is that of Syowa East. Dot-dashed line in each panel indicates a hypothetical equality of the boundaries identified in both hemispheres for comparative purposes. Linear fits to the variations are indicated by solid lines, and correlation coefficients are shown at the bottom of the panels. Dipole tilt angle is shown in colour-scale. (Bottom three panels) The histograms of the magnetic latitudes of the spectral width boundaries identified in Iceland East (grey bars) and Syowa East (open bars) for each conjugate beam pair, respectively.
no major difference in the result of the projection between these two approaches. The middle three panels of Figure 4 show the latitudes of the spectral width boundaries identi-fied in both hemispheres for each conjugate beam pair. In each panel, the blue line indicates the boundary identified in Iceland East radar and the orange line indicates the bound-ary identified by Syowa East radar. Attached grey bars in-dicate uncertainties in the boundary location as estimated in Sect. 3.1 (1.08◦in latitude). There exists a lack of the spec-tral width boundary in Iceland East between 10:35 UT and 10:45 UT on beam pair I. Field lines at these latitudes can not be traced from the Northern Hemisphere into the South-ern Hemisphere because they are defined to be open by the Tsyganenko 89 model.
The magnetic latitude of the spectral width boundary fol-lows the same general equatorward trend in both hemi-spheres throughout the interval. It is difficult to determine whether this variation is purely temporal or not. In general, the equatorward edge of the polar cap (ideally, this corre-sponds to the poleward edge of the auroral oval) is not a cir-cle. Latitudes are slightly different against magnetic local time. If we refer to the model of the auroral oval (e.g. Feld-stein and Starkov, 1967), the latitude of the poleward edge
of the oval is found to be highest at magnetic local noon. Hence, the boundary seems to shift poleward (equatorward) as it moves from dawnside (noon) to noon (duskside). This apparent variation could be a considerable bias when we es-timate how the polar cap is expanding and contracting in as-sociation with the IMF orientations and substorm activities. In the middle panels of Fig. 4, approximate UT of magnetic local noon is indicated by an open black triangle. The large-scale equatorward trend of the boundaries is found to be in-dependent on the MLT, which suggests that the bias intro-duced by the longitudinal variation of the polar cap boundary is negligible during the interval of this study.
To illustrate how the boundaries collocate between two hemispheres, Fig. 5 presents scattergrams (top) and his-tograms (bottom) of the magnetic latitudes of the boundaries identified in both hemispheres for each conjugate beam pair. In the top three panels, linear fits to the variations are in-dicated by solid lines, and correlation coefficients are also shown. Dashed-lines on the scattergrams indicate a hypothet-ical equality of the boundaries identified in both hemispheres for comparative purposes. It is clear that the latitudes of the spectral width boundaries are highly collocated between both hemispheres, where correlation coefficients are larger than
1560 K. Hosokawa et al.: Interhemispheric comparison of spectral width boundary 0.70 for all beam pairs and occurrence histograms are
con-siderably overlapping. However, the boundary in Syowa East tends to be at higher latitude compared with that in Iceland East, where the differences as large as 2◦in latitude can be identified on individual points. In general, magnetic latitude of the cusp varies with dipole tilt angle (e.g. Newell and Meng, 1989). When the dipole tilt angle is directed positive, the latitude of the cusp is higher in the Northern Hemisphere than that in the Southern Hemisphere. In order to estimate how the tilt of the dipole contributes to the interhemispheric difference in the latitude of the boundaries, information on the dipole tilt angle is displayed as a colour-scale in the top three panels. It is found that the interhemispheric difference is larger when the dipole tilt angle is larger (blue and green points), while the difference is almost negligible when the angle is close to zero (orange and red points).
3.4 Response to the IMF and substorm activity
Returning to the middle three panels of Fig. 4, the magnetic latitude of the spectral width boundary follows the same gen-eral equatorward trend in both hemispheres throughout the interval, which means the OCFLB is gradually expanding around the dayside ionosphere. It is also worth noting that the latitude of the spectral width boundary shows short-lived poleward excursions superposed on the general equatorward trend. In order to clarify what causes these poleward and equatorward movements of the spectral width boundary, we have examined the variation of the interplanetary magnetic field and the occurrence of substorms during the interval. The former would contribute to the expansion of the OCFLB through the reconnection at the magnetopause, while the lat-ter would contribute to the contraction of the OCFLB through the reconnection of the open field in the tail, most likely as a part of the substorm process.
During the interval of the present study, the ACE space-craft was located upstream of the magnetosphere at Xgsm≈ 228 RE and the Wind spacecraft was located at Xgsm ≈ 49 RE. An approximate solar wind velocity of 530 km s−1
measured by both spacecrafts during this interval gives a de-lay of some 50 min for ACE and 14 min for Wind between the observation of IMF features and their incidence on the Earth’s magnetopause. The calculation is based on the tech-nique of Khan and Cowley (1999). An additional two min-utes must be added to account for the propagation time of Alfv´en waves from the subsolar magnetopause to the day-side high-latitude ionosphere. A total solar wind propaga-tion time delay of 52 min for ACE and 16 min for Wind appears to give the best correlation between the variations observed in the IMF and the behavior of the spectral width boundary observed by the radars. The IMF By and Bz
com-ponents, as measured by the spacecraft, including the esti-mated propagation time of 52 min for ACE and 16 min for Wind, are displayed in the top two panels of Fig. 4, with data from ACE being represented by the solid line and data from Wind by the dashed line. During the first 30 min from the start of the interval, IMF By is strongly positive, but turns
negative at 10:00 UT, after which it has a strong negative value (≈ −10 nT). In the case of the Bz component,
nega-tive values are dominant throughout the interval, with excur-sions close to zero around 11:18 UT (“NE1”) and 12:22 UT (“NE2”), which are presented as dot-dashed lines.
As is already noted, the magnetic latitude of the spectral width boundary exhibits a general equatorward trend in both hemispheres. This trend is found to be related to the con-tinuous negative Bz component of the IMF. Following each
of the two northward excursions of the IMF, the spectral width boundary moved poleward in both hemispheres. The response of the spectral width boundary to these northward excursion is rapid (response time is less than 5 min) and it occurs simultaneously in both hemispheres. The duration of these poleward motions of the boundaries is similar to that of the northward excursion of the IMF. When the By
com-ponent of the IMF suddenly changes, the magnetic latitudes of the spectral width boundaries are also expected to move. Cowley et al. (1991) pointed out that in the Northern Hemi-sphere the OCFLB shifts towards dusk during a By positive
interval and towards dawn for the Bynegative case. The
situ-ation is reversed in the Southern Hemisphere. At the time of the large Bychange (10:00 UT), the radars observe the
spec-tral width boundary between 10:00 MLT and 12:00 MLT in both hemispheres. Hence, this IMF By change could
cre-ate poleward displacement of the spectral width boundary in the Northern Hemisphere and equatorward in the South-ern Hemisphere. However, our observation does not support this effect. Although there could be evidence that the spec-tral width boundary in the Northern Hemisphere shifts pole-ward in response to the By change, corresponding
equator-ward movement of the spectral width boundaries cannot be identified in the Southern Hemisphere.
Two substorms occur during the interval of interest, the progress of which are monitored by three magnetometer sta-tions from the Canadian Auroral Network for the OPEN Program Unified Study (CANOPUS) network (as described by Samson et al., 1992). These stations are FSIM, FSMI and DAWS, which are located between 22:30 MLT and 04:00 MLT at the times of the substorm breakups. The H -component magnetograms from the three stations and band-pass filtered data from DAWS are shown in the bottom panel of Fig. 4. The first substorm occurs at 09:45 UT (“SB1”) and the second at 11:48 UT (“SB2”), both of which are con-firmed by a large negative bay in the H -component and the presence of Pi2 pulsations, indicating the expansion phase onset of the substorms. Following the expansion phase on-set of the substorms (as indicated by the dot-dashed line, re-spectively), the spectral width boundary starts to move pole-ward or stops its equatorpole-ward motion. This response is more clearly seen at the time of the first substorm onset (degree of the displacement is approximately 3◦ in magnetic latitude), although there is some evidence for this at the time of the second substorm onset (degree of the movement is less than 1◦in beam pair I and II, and the boundary remains at a con-stant latitude in beam pair III). In short, the degree of the poleward movement of the spectral width boundary is larger
following the first substorm onset than in the second. At the time of the first substorm breakup, there is an in-terhemispheric difference in response to the spectral width boundary to the substorm. The spectral width boundary starts to move poleward 5 min after the onset of the substorm in the Southern Hemisphere, while it takes approximately 15 min to respond in the Northern Hemisphere. This signature is more clearly identified in beam pair II and III. The degree of the difference is about 2◦ in magnetic latitude, which is larger than the uncertainty in the identification of the spectral width boundary, as estimated in Sect. 3.1. In beam pair I, we cannot find a clear interhemispheric difference whose scale is larger than the uncertainty of the backscatter location. However, the boundary in Syowa East exhibits a small poleward excur-sion (≈ 1◦) at 09:50 UT, which is consistent with the pole-ward variation seen in beam pair II and III. In contrast to this difference in response to the first substorm breakup, no inter-hemispheric difference can be found in the response time to the second substorm. The cause of the interhemispheric sym-metry and asymsym-metry in response to the substorm breakup will be discussed in a later section.
4 Discussion
4.1 Interhemispheric collocation of the boundaries First, we discuss the collocation of the spectral width bound-aries in both hemispheres. The present observation suggests that the magnetic latitude of the spectral width boundary is similar in both hemispheres, and the correlation coefficients between both latitudes are larger than 0.70 for all beam pairs. Newell and Meng (1989) investigated a large data set of DMSP satellite crossings of the cusp and concluded that the position of the cusp is about 4◦lower in winter than in the summer hemisphere and approximately symmetric around equinox. The first interhemispheric observation of the spec-tral width boundaries by Pinnock et al. (1999) identified the difference in the latitude of the boundaries, up to 4◦in mag-netic latitude, between both hemispheres. Their observation was carried out during summer in the Northern Hemisphere. Hence, they argued that the interhemispheric difference of the boundary location is caused by the seasonal asymmetry of the dayside structure related to the dipole tilt angle effect. On the other hand, the present observation was done during equinoctial conditions, when the effect of dipole tilt angle on the interhemispheric difference is minimized, which can, therefore, be the reason for the good collocation of the spec-tral width boundary between both hemispheres in our obser-vation.
Though the spectral width boundaries coincide on aver-age between both hemispheres, there is a slight difference, such that the boundary identified in Syowa East’s field-of-view tends to be at a higher latitude compared with that in Iceland East (2◦in maximum). There are at least two possi-ble reasons for this difference. Again, one reason is the effect of the dipole tilt angle, which varies not only with season, but
also with UT. During the interval of this study, the dipole tilt angle changes from −9.33◦(09:30 UT) to 0.76◦(13:30 UT).
As clearly shown in Fig. 5, there exists a good correlation between the dipole tilt angle and degree of the interhemi-spheric difference in boundary latitude. This suggests that the primary cause of the interhemispheric difference in the latitude of the boundaries is the effect of the dipole tilt angle. Newell and Meng (1989) have shown that 17◦of dipole tilt angle is required to shift the cusp by 1◦of latitude. −9.33◦ of dipole tilt angle shifts the cusp equatorward (poleward) by 0.55◦in the Northern (Southern) Hemisphere. Then, an in-terhemispheric difference in boundary latitude is estimated to be 1.1◦, which is roughly consistent with the present ob-servation. Although the observation was carried out close to the equinox, it was not under pure equinox conditions (about a half month after the equinox). According to the statistical analysis of Newell and Meng (1989), such a shift from the equinox is enough to create a small difference in the average latitude of the dayside structure. The other possibility is the effect of IMF By. Apart from the first 30 min of the interval,
IMF Byis predominantly negative. The IMF Bycomponent
imposes a strong skewing force on the high-latitude convec-tion pattern (e.g. Cowley, 1981) which results, within the Northern Hemisphere, in anti-sunward flow being dragged towards the morning sector for IMF Bypositive and towards
the evening sector for By negative (e.g. Reiff and Burch,
1985). Variation of dayside OCFLB with longitude could also have a dependence on the IMF By, which can create a
difference in spectral width location around dayside.
We again stress our finding: that the spectral width bound-aries identified in both hemispheres are highly collocated. Milan et al. (1998) shows that the HF radar technique can be relatively insensitive to the variations in the propagation environment of the high-latitude ionosphere and that dayside auroral backscatter exhibits a true geophysical structure. Fur-thermore, Yeoman et al. (1997) employed a swept-frequency radar mode to demonstrate that the equatorward boundary of the cusp backscatter was independent of the radio-wave frequency and any variations in propagation. Our observa-tional results also suggest that the spectral width boundary is not affected by the local conditions in a hemisphere and are strongly controlled by factors common to both hemispheres. Recently, Andr´e et al. (1999, 2000a, 2000b) have postulated that high frequency (Pc1) wave activity associated with the cusp results in highly variable electric fields, which broaden the spectra, although this is not the only source of high spec-tral widths in HF radar data (strictly speaking, the effect of velocity shears on the scale of radar range/beam cell needs to be considered). Most of these waves are attributed to electro-magnetic ion cyclotron waves generated at the dayside mag-netopause in the equatorial plane. Since this wave activity is considered to propagate into the conjugate ionospheres from the equatorial plane, the collocation of the spectral width boundary in our observation can be explained by the mecha-nism.
1562 K. Hosokawa et al.: Interhemispheric comparison of spectral width boundary 4.2 Response to the changes of IMF Bzand substorm
We have seen that the spectral width boundary appears to move equatorward or poleward in response to the changes in the IMF and the occurrence of substorm. We now discuss the influence of the Bzcomponent of IMF and the occurrence
of substorm on the variation of the spectral width boundary. The size of the area of open flux is controlled by both the dayside and nightside reconnection rates (Siscoe and Huang, 1985). Cowley and Lockwood (1992) illustrated an expand-ing/contracting polar cap model in which they described the ionospheric flow as a consequence of both dayside and night-side reconnection rates. Initially, it is assumed that the open and closed flux in the polar cap is in a state of equilibrium and that the polar cap is circular, containing some amount of open flux. In response to a burst of dayside reconnection, a region of closed flux adjacent to the pre-existing dayside polar cap boundary is opened. The OCFLB, the boundary which en-closes open flux, moves equatorward to encompass the new open flux. For the period analyzed in the present study, neg-ative Bzwas dominant throughout the interval. The general
equatorward trend of the spectral width boundary is consis-tent with the gradual accumulation of open flux in the polar cap through magnetopause reconnection, which is expected for southward IMF.
Conversely, during the substorm expansion phase, when reconnection occurs in the magnetotail closing pre-existing open flux, the boundary moves poleward as the polar cap shrinks. Following the onset of two substorm breakups (termed “SB1” and “SB2” in the text), the spectral width boundary moves poleward with some delay time, which in-dicates that the reconnection in the magnetotail is destroying open flux within the polar cap. There is a difference between the two poleward excursions associated with the substorm occurrence, such that the scale of the poleward movement of the boundary is larger following the first substorm breakup (SB1) than the second substorm breakup (SB2). At the on-sets of both substorms, the Bzcomponent of IMF is oriented
southward. However, just after the onset of the first substorm, IMF Bz becomes close to zero, while the IMF continues to
be directed southward after the onset of the second substorm. If reconnection occurs in the magnetotail and on the dayside simultaneously, the day and nightside reconnection rates are in competition, that is creating and destroying open flux, re-spectively. In the case of the first substorm, the nightside reconnection rate is expected to strongly exceed the dayside reconnection rate, hence, the spectral width boundary shifts poleward by approximately 3◦. On the other hand, during the interval of the second substorm breakup, the difference between the reconnection rate at the dayside magnetopause and in the tail is considered to be smaller compared with that at the first substorm breakup, due to the continuing south-ward IMF. Hence, the scale of the polesouth-ward excursion fol-lowing the second substorm breakup is small (less than 1◦or remaining at a constant latitude).
When the IMF has a northward component, reconnection can take place at the high-latitude magnetopause, tailward of
the magnetopause entrance to the cusp region. Here, recon-nection occurs between the IMF and pre-existing open flux in the magnetotail lobe. These field lines map to the high-latitude side of the ionospheric footprint of the cusp, and are located at higher latitude within the polar cap. Hence, no new open flux is created in this process and the amount of open flux in the polar cap is expected to remain unchanged if there is no nightside reconnection. In the present obser-vation, however, following the northward excursions of the IMF Bz (termed “NE1” and “NE2” in the text), the
spec-tral width boundary moves poleward in both hemispheres. This suggests that tail reconnection is still continuing. Ac-tually, at the times of both northward excursions, variation of the CANOPUS magnetometers still exhibits the signature of substorm recovery phase. Milan et al. (2002) pointed out that magnetotail reconnection and the associated shrinkage of the polar cap appears to continue from substorm expan-sion phase onset to the end of the recovery phase, which is about 100 min. A similar finding was reported by Khan et al. (2002), in which reconnection signatures were observed in the magnetotail some time after significant auroral activity had subsided. This signature is also consistent with a ces-sation of dayside reconnection and associated contraction of the polar cap. Our observation is consistent with their results.
4.3 Interhemispheric asymmetry in response to the sub-storms
Here, we discuss the interhemispheric difference in the re-sponse time to the occurrence of substorm expansion. Dur-ing the period analyzed in this paper, two substorms, SB1 and SB2, occur. Following the onset of both substorms, the spectral width boundary moves poleward, indicating that re-connection in the magnetotail is destroying open flux in the polar cap. However, there is a difference in response time to the substorm onset between the two substorms. For the first substorm, the spectral width boundary starts to move poleward 5 min after the onset of the substorm in the South-ern Hemisphere, while it takes approximately 15 min to re-spond in the Northern Hemisphere. The conjugate observa-tion of the spectral width boundary by Pinnock et al. (1999) demonstrated that there is an interval of poleward movement of the spectral width boundary, suggesting that the nightside reconnection rate exceeds the dayside rate. However, no in-terhemispheric difference was discussed in their study. Here, we discuss this difference in terms of interhemispheric asym-metry of the substorm breakup region in the longitudinal di-rection, associated with the effect of the IMF Bycomponent.
It is well known that the Bycomponent of IMF imposes a
skewing force on the convection pattern around the dayside high-latitude ionosphere, which results, within the Northern Hemisphere, in anti-sunward flow being dragged towards the morning sector for IMF Bypositive and towards the evening
sector for Bynegative, with an opposite variation produced
within the Southern Hemisphere (e.g. Cowley, 1981). This skewing force imposed on the ionosphere also results in
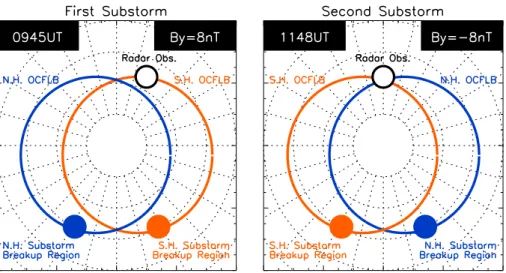
Fig. 6. A schematic diagram of the situation accounting for the difference in response time of the spectral width boundary to the substorm
expansion at the time of the first substorm onset (left panel) and the second substorm onset (right panel). Magnetic local noon is toward the top of the figure.
the dawn-dusk displacement of the auroral oval, within the Southern Hemisphere in the direction of the imposed By
component (Holzworth and Meng, 1984). Also, in the night-side ionosphere, configuration of the ionosphere depends on the IMF By. For example, Rodger et al. (1984) described the
asymmetric location in MLT of the Harang discontinuity as a function of IMF By, with its location within the Northern
Hemisphere skewed ≈2 h westwards and within the South-ern Hemisphere ≈2 h eastwards, for an IMF y-component of
≈8 nT. Shand et al. (1998) and Yeoman et al. (2000) inves-tigated interhemispheric contrasts in the ionospheric convec-tion response to variaconvec-tions of the IMF and substorm activ-ity using conjugate SuperDARN radar data on the nightside. They also demonstrated that when the IMF Byis large, then
sufficient asymmetries are generated between the Northern and Southern Hemisphere ionospheric convection patterns to result in large-scale non-conjugacy, even in flows driven by nightside processes. In a recent analysis of conjugate satel-lite images, Craven and Frank (1996) found an indication of a dependence in the substorm expansion phase on the By
com-ponent of the IMF. Stenbaek-Nielsen and Otto (1997) gave an interpretation with the penetration of the By component
of IMF causing the observed interhemispheric difference in the behavior of discrete aurora.
In the present observation, IMF By is ≈8 nT at the onset
of the first substorm, and ≈ −8 nT at the onset of the second substorm. At the onset of both substorms, the Bzcomponent
of IMF is predominantly negative. If we postulate a motion of the substorm breakup region in a similar fashion to Rodger et al. (1984), the substorm breakup region shifts towards dusk for the case of the first substorm and towards dawn for the second substorm within the Northern Hemisphere, with the situation being reversed in the Southern Hemisphere. At the onset of the first substorm, the conjugate radars are observ-ing spectral width boundaries between 10–11.5 MLT, while at the onset of the second substorm, the boundaries in the
field-of-view of the radars are locate around 12 MLT. The situation described here is summarized in Fig. 6. Hence, the breakup region of the first substorm is expected to be closer to the spectral width boundary as identified by the radar in the Southern Hemisphere than in the Northern Hemisphere, while there is no considerable difference in distance from the substorm breakup region to fields-of-view of the conjugate radars for the case of the second substorm. We suggest that this displacement of the substorm breakup region in MLT associated with IMF By polarity could create the
interhemi-spheric difference in response of the boundaries to the first substorm. However, whether longitudinal displacement of substorm breakup region expected here is sufficient to cre-ate the 10 min difference in response of the spectral width boundary around the dayside ionosphere is still an open ques-tion and more detailed analysis is needed for further under-standing of this interhemispheric difference.
5 Summary and conclusion
The spectral width boundaries obtained from the conjugate radar pair composed of CUTLASS Iceland East in the North-ern Hemisphere and SENSU Syowa East in the SouthNorth-ern Hemisphere were compared. Correspondence between the magnetic latitudes of the boundaries in both hemispheres is generally very good. Correlation coefficients between the latitudes of the boundaries are larger than 0.70 for all conju-gate beam pairs employed in this study, which suggests that the spectral width boundary is not affected by the local con-ditions in a hemisphere but are strongly controlled by fac-tors common to both hemispheres. This high correlation oc-curs because the present observation was carried out around equinox when the effect of the dipole tilt angle on the lo-cation of the cusp is minimized. The temporal variation of the magnetic latitude of the boundary follows the same
equa-1564 K. Hosokawa et al.: Interhemispheric comparison of spectral width boundary torward trend in both hemispheres. This signature is
con-sistent with the accumulation of open flux in the polar cap by magnetopause reconnection, expected when IMF Bz is
negative. Boundaries in both hemispheres also exhibit short-lived poleward motions superposed on the general equator-ward trend, which follow both the onset of substorm expan-sion phases and temporary northward excurexpan-sions of IMF Bz
during substorm recovery phase. This suggests that the night-side reconnection rate exceeds the daynight-side reconnection rate and the polar cap contracts during these intervals. In addi-tion, there is a interhemispheric difference in response time to the substorm occurrence between two hemispheres. At the time when the first substorm occurs, the spectral width boundary starts to move poleward 5 min after the onset of the substorm in the Southern Hemisphere, while it takes ap-proximately 15 min to respond in the Northern Hemisphere, with the difference being about 10 min. We have suggest that the displacement of the substorm breakup region in MLT as-sociated with IMF Bypolarity could create this difference.
Acknowledgements. The Ministry of Education, Culture, Sports,
Science and Technology supports the SENSU Syowa HF radar sys-tems. The 39th and 40th JAREs (Japanese Antarctic Research Ex-pedition) have carried out the HF radar operation at Syowa sta-tion. The Iceland East-Finland radar pair (the Co-operative UK Twin Located Auroral Sounding System: CUTLASS) is funded by the Particle Physics and Astronomy Research Council, U.K., under grant PPA/R/R/1997/00256, the Finnish Meteorological Institute, Helsinki, and the Swedish Institute for Space Research, Uppsala. The authors would like to thank N. Ness at Bartol Research Insti-tute and CDAWeb for access to key parameter data from the MFI instrument onboard the ACE spacecraft. The authors also thank the principle investigator, R. P. Lepping, for the use of key pa-rameters from the Wind MFI instruments. The CANOPUS instru-ment array is constructed, maintained and operated by the Cana-dian Space Agency. D. Hardy of Phillips Laboratory designed and built the DMSP SSJ/4 particle detectors employed in this study. This research is supported by the Grant-in Aid for Scientific Re-search (A:11304029) from Japan Society for the Promotion of Sci-ence (JSPS). KH is supported by Research Fellowships of the Japan Society for the Promotion of Science for Young Scientists. EEW is indebted to the Particle Physics and Astronomy Research Coun-cil (PPARC) for a research studentship. The authors thank a ref-eree, Mike Pinnock for his significant suggestions in evaluating this paper.
References
Andr´e, R., Pinnock, M., and Rodger, A. S.: On the SuperDARN autocorrelation function observed in the ionospheric cusp, Geo-phys. Res. Lett., 26, 3353, 1999.
Andr´e, R., Pinnock, M., Villain, J.-P., and Hanuise, C.: On the factors conditioning the Doppler spectral width determined from SuperDARN HF radars, Int. J. Geomagn. Aeron., 2, 77, 2000a. Andr´e, R., Pinnock, M., and Rodger, A. S.: Identification of the
low-altitude cusp by Super Dual Auroral Radar Network radars: A physical explanation for the empirically derived signature, J. Geophys. Res., 105, 27 081, 2000b.
Baker, K. B. and Wing, S.: A new magnetic coordinate system for conjugate studies of high latitudes, J. Geophys. Res., 94, 9139, 1989.
Baker, K. B., Greenwald, R. A., Ruohoniemi, J. M., Dudeney, J. R., Pinnock, M., Newell, P. T., Greenspan, M. E., and Meng, C-I.: Simultaneous HF radar and DMSP observation of the cusp, Geophys. Res. Lett., 17, 1869, 1990
Baker, K. B., Dudeney, J. R., Greenwald, R. A., Pinnock, M., Newell, P. T., Rodger, A. S., Mattin, N., and Meng, C.-I.: HF-radar signatures of the cusp and low latitude boundary layer, J. Geophys. Res., 100, 7671, 1995.
Baker, K. B., Rodger, A. S., and Lu, G.: HF radar observations of the dayside magnetic merging rate: A Geospace Environment Modeling boundary layer campaign study, J. Geophys. Res., 102, 9603, 1997.
Barthes, L., Andr´e, R., Cerisier, J.-C., and Villain, J.-P.: Separation of multiple echoes using a high resolution spectral analysis in SuperDARN HF radars, Radio Sci., 33, 1005, 1998.
Chisham, G., Pinnock, M., and Rodger, A. S.: The response of the HF radar spectral width boundary to a switch in the IMF By
directions: Ionospheric consequence of transient dayside recon-nection?, J. Geophys. Res., 106, 191, 2001.
Coleman, I. J., Pinnock, M., Rodger, A. S.: The ionospheric foot-print of antiparallel merging regions on the dayside magne-topause, Ann. Geophysicae, 18, 511, 2000.
Cowley, S. W. H.: Magnetospheric asymmetries associated with the
Y-component of the IMF, Planet. Space Sci., 29, 79, 1981. Cowley, S. W. H., Morelli, J. P., and Lockwood, M.: Dependence
of convective flows and particle precipitation in the high-latitude ionosphere on the X and Y components of the interplanetary magnetic field, J. Geophys. Res., 96, 5557, 1991.
Cowley, S. W. H. and Lockwood, M.: Excitation and decay of so-lar wind driven flows in the magnetosphere-ionosphere system, Ann. Geophysicae, 10, 103, 1992.
Craven, J. D. and Frank, L. A.: The asymmetric substorm expansion phase (abstract), EOS Trans. AGU, 77(17), Spring Meet. Suppl., 252, 1996.
Dyrud, L. P., Engebretson, M. J., Posh, J. L., Hughes, W. J., Fukun-ishi, H., Arnoldy, R. L., Newell, P. T., and Horne, R. B.: Ground observations and possible source regions of two types of Pc1-2 micropulsation at very high latitudes, J. Geophys. Res., 10Pc1-2, 27 011, 1997.
Evans, L. C. and Stone, E. C.: Electron polar cap and the bound-ary of open geomagnetic field lines, J. Geophys. Res., 77, 5580, 1972.
Feldstein, Y. I. and Starkov, G. V.: Dynamics of auroral belt and polar geomagnetic disturbance, Planet. Space Sci., 15, 209, 1967. Greenwald, R. A., Baker, K. B., Dudeney, J. R., Pinnock, M., Jones, T. B., Thomas, E. C., Villain, J.-P., Cerisier, J.-C, Senior, C., Hanuise, C., Hunsucker, R. D., Sofko, G., Koehler, J., Nielsen, E., Pellinen, R., Walker, A. D. M., Sato, N., and Yamagishi, H.: DARN/SuperDARN: A global view of high-latitude convection, Space Sci. Rev., 71, 763, 1995.
Hardy, D. A., Schmitt, L. K., Gussenhoven, M. S., Marshall, F. J., Yeh, H. C., Schumaker, T. L., Huber, A., and Pantazis, J.: Precipitating electron and ion detectors (SSJ/4) for the block 5D/Flights 6-10 DMSP satellites: calibration and data presen-tation, Rep. AFGL-TR-84-0317, Air Force Geophysics Labora-tory, Hanscom AFB, Mass., 1984.
Holzworth, R. H. and Meng, C.-I.: Auroral boundary variations and the interplanetary magnetic field, Planet. Space Sci., 32, 25, 1984.
Hosokawa, K., Woodfield, E. E., Lester, M., Milan, S. E., Sato, N., Yukimatu, A. S., and Iyemori, T.: Statistical characteristics of spectral width as observed by the conjugate SuperDARN radars, Ann. Geophysicae, 20, 1213, 2002.
Huber, M. and Sofko, G.: Small-scale vortices in the high-latitude F-region, J. Geophys. Res., 105, 20 885, 2000.
Khan, H. and Cowley, S. W. H.: Observations of the response time of high-latitude ionospheric convection to variations in the in-terplanetary magnetic field using EISCAT and IMP-8 data, Ann. Geophysicae, 17, 1306, 1999.
Khan, H., Cowley, S. W. H., Kolesnikova, E., Lester, M., Brit-tnacher, M. J., Hughes, T. J., Hughes, W. J., Kurth, W. S., Mc-Comas, D. J., Newitt, L., Owen, C. J., Reeves, G. D., Singer, H. J., Smith, C. W., Southwood, D. J., and Wattermann, J. F.: Observation of two complete substorm cycles during the Cassini Earth swing-by: Cassini magnetometer data in a global context, J. Geophys. Res., in press, 2002.
Lockwood, M.: Relationship of dayside auroral precipitations to the open-closed separatrix and the pattern of convective flow, J. Geophys. Res., 102, 17 475, 1997.
Matsuoka, A., Tsuruda, K., Hayakawa, H., Mukai, T., Nishida, A., Okada, T., Kaya, N., and Fukunishi, H.: Electric field fluctua-tions and charged particle precipitation in the cusp, J. Geophys. Res., 98, 11 225, 1993.
Maynard, N. C., Heppner, J. P., and Egeland, A.: Intense, variable electric fields at ionospheric altitudes in the high latitude regions as observed by DE-2, Geophys. Res. Lett., 9, 981, 1982. Menk, F. W., Fraser, B. J., Hansen, H. J., Newell, P. T., Meng,
C.-I., and Morris, R. J.: Identification of the magnetospheric cusp and cleft using Pc1-2 ULF pulsations, J. Atmos. Terr. Phys., 54, 1021, 1992.
Milan, S. E., Yeoman, T. K., Lester, M., Thomas, E. C., and Jones, T. B.: Initial Backscatter occurrence statistics from the CUT-LASS HF radars, Ann. Geophysicae, 15, 703, 1997.
Milan, S. E., Yeoman, T. K., and Lester, M.: The dayside auroral zone as a hard target for coherent HF radars, Geophys. Res. Lett., 25, 3717, 1998.
Milan, S. E., Lester, M., Cowley, S. W. H., Moen, J., Sandholt, P. E., and Owen, C. J.: Meridian-scanning photometer, coherent HF radar, and magnetometer observation of the cusp : a case study, Ann. Geophysicae, 17, 159, 1999.
Milan, S. E. and Lester, M.: Interhemispheric differences in the HF radar signature of the cusp region: A review through the study of a case example, Adv. Polar Upper Atmos. Res., 15, 159, 2001. Milan, S. E., Lester, M., Cowley, S. W. H., Oksavik, K., Brittnacher,
M., Greenwald, R. A., Sofko, G., and Villain, J.-P.: Variations in polar cap area during two substorm cycles, submitted to Ann. Geophysicae, 2002.
Moen, J., Carlson, C., Milan, S. E., Shumilov, N., Lybekk, B., Sand-holt, P. E., and Lester, M.: On the collocation between dayside auroral activity and coherent HF radar backscatter, Ann. Geo-physicae, 18, 1531, 2001.
Newell, P. T. and Meng, C. I.: The cusp and the cleft/boundary layer: Low-altitude identification and statistical local time varia-tion, J. Geophys. Res., 93, 14 549, 1988.
Newell, P. T. and Meng, C. I.: Dipole tilt angle effects on the latitude of the cusp and cleft/low-latitude boundary layer, J. Geophys. Res., 94, 6949, 1989.
Newell, P. T. and Meng, C. I.: Ion acceleration at the equatorward edge of the cusp: low-altitude observations of patchy merging, Geophys. Res. Lett., 18, 1829, 1991.
Pinnock, M., Rodger, A. S., Baker, K. B., Lu, G., and Hairston,
M.: Conjugate observations of the day-side reconnection electric field: A GEM boundary layer campaign, Ann. Geophysicae, 17, 443, 1999.
Reiff, P. H., Hill, T. W., and Burch, J. L.: Solar wind plasma injec-tion at the dayside magnetospheric cusp, J. Geophys. Res., 82, 479, 1977.
Reiff, P. H. and Burch, J. L.: IMF By-dependent plasma flow and
Birkeland currents in the dayside magnetosphere 2. A global model for northward and southward IMF, J. Geophys. Res., 90, 1595, 1985.
Rodger, A. S., Cowley, S. W. H., Brown, M. J., Pinnock, M., and Simmons, D. A.: Dawn-dusk (y) component of the interplanetary magnetic field and the local time of the Harang discontinuity, Planet. Space Sci., 8, 1021, 1984.
Rodger, A. S., Mende, S. B., Rosenberg, T. J., and Baker, K. B.: Si-multaneous optical and HF radar observations of the ionospheric cusp, Geophys. Res. Lett., 22, 2045, 1995.
Rodger, A. S. and Pinnock, M.: The ionospheric response to flux transfer events: the first few minutes, Ann. Geophysicae, 15, 685, 1997.
Rodger, A. S.: Ground-based imaging of magnetospheric bound-aries, Adv. Space Res., 25, 1461, 2000.
Samson, J. C., Wallis, D. D., Hughes, T. J., Creutzberg, F., Ruo-honiemi, J. M., and Greenwald, R. A.: Substorm intensifications and field line resonances in the nightside magnetosphere, J. Geo-phys. Res., 97, 8495, 1992.
Sandholt, P. E., Farrugia, C. J., Oieroset, M., Stauning, P., and Denig, W. F.: Auroral activity associated with unsteady magneto-spheric erosion: observations on 19 December 1990, J. Geophys. Res., 103, 2309, 1998.
Schiffler, A., Sofko, G., Newell, P. T., and Greenwald, R. A.: Map-ping the outer LLBL with SuperDARN double-peaked spectra, Geophys. Res. Lett., 24, 3149, 1997.
Shand, B. A., Yeoman, T. K., Lewis, R. V., Greenwald, R. A., and Hairston, M. R.: Inter-hemispheric contrasts in the ionospheric convection response to changes in the interplanetary magnetic field and substorm activity: a case study, Ann. Geophysicae, 16, 764, 1998.
Siscoe, G. L. and Huang, T. S.: Polar cap inflation and deflation, J. Geophys. Res., 90, 543, 1985.
Stenbaek-Nielsen, H. C. and Otto, A.: Conjugate auroras and the interplanetary magnetic field, J. Geophys. Res., 102, 2223, 1997. Tsyganenko, N. A.: A magnetospheric magnetic field model with a
warped tail current sheet, Planet. Space Sci., 37, 5, 1989. Woch, J. and Lundin, R.: Magnetosheath plasma precipitation in the
polar cusp and its control by the interplanetary magnetic field, J. Geophys. Res., 97, 1421, 1992.
Yeoman, T. K., Lester, M., Cowley, S. W. H., Milan, S. E., Moen, J., and Sandholt, P. E.: Simultaneous observation of the cusp in optical, DMSP and HF radar data, Geophys. Res. Lett., 24, 2251, 1997.
Yeoman, T. K., Lewis, R. V., Khan, H., Cowley, S. W. H., and Ruo-honiemi, J. M.: Interhemispheric observation of nightside iono-spheric electric fields in response to IMF Bzand Bychanges and
substorm pseudobreakup, Ann. Geophysicae, 18, 897, 2000. Yeoman, T. K., Wright, D. M., Stocker, A. J., and Jones, T. B.: An
evaluation of range accuracy in the Super Dual Auroral Radar Network over-the-horizon HF radar systems, Radio Sci., 36, 801, 2001.
Yeoman, T. K., Hanlon, P. G., and McWilliams, K. A.: A statisti-cal study of the location and motion of the HF radar cusp, Ann. Geophysicae, 20, 275, 2002.