HAL Id: hal-03051879
https://hal.archives-ouvertes.fr/hal-03051879
Submitted on 3 Feb 2021
HAL is a multi-disciplinary open access
archive for the deposit and dissemination of
sci-entific research documents, whether they are
pub-lished or not. The documents may come from
teaching and research institutions in France or
abroad, or from public or private research centers.
L’archive ouverte pluridisciplinaire HAL, est
destinée au dépôt et à la diffusion de documents
scientifiques de niveau recherche, publiés ou non,
émanant des établissements d’enseignement et de
recherche français ou étrangers, des laboratoires
publics ou privés.
François Facchini, Elena Seghezza
To cite this version:
François Facchini, Elena Seghezza. Legislative production and public spending in France. Public
Choice, Springer Verlag, In press, �10.1007/s11127-020-00858-7�. �hal-03051879�
Legislative production and public spending in France
François Facchini1 · Elena Seghezza2Received: 13 January 2020 / Accepted: 26 October 2020 © The Author(s) 2020
Abstract
The aim of this article is to help explain the history of the public spending-to-GDP ratio in France by examining the production of laws and regulations. It empirically finds a posi-tive and significant relationship between the number of pages in the Official Gazette of the French Republic and the development of the public expenditure-to-GDP ratio. We rely on the number of pages in the Official Gazette as a proxy for the cost of implementing laws and regulations. If unchecked, a proliferation of laws and regulations expands public spending. Over the period 1905–2015, a 10% increase in pages caused a 1.14% increase in the public expenditure-to-GDP ratio.
Keywords Public spending · Law · “Self-reinforcing” process
JEL Classification H61 · K20 · N44
1 Introduction
The aim of the present article is to help understand and explain the history of public spend-ing in France. The history of gaugspend-ing the size of the public sector by computspend-ing the public expenditure-to-GDP ratio is now well known. For many years, however, it was thought that one of the shortcomings of nineteenth- and twentieth-century French historiography related to the role of the state in economic development and, more generally, the very his-tory of the state as a governing apparatus or machine (Bouvier 1978; Rosanvallon 1990). A proposed explanation for those shortcomings is the conscious or unconscious domina-tion of the classical liberal approach to capitalism. Indeed, some scholars argue that liberal ideology is incapable of explaining the growth, in the long term, of state interventionism and its influence on economic development and, moreover, that it ignores the decisive role of the state in economic progress (Bouvier 1978). In 1983, Christine André and Robert
* Elena Seghezza seghezza@unige.it
François Facchini
francois.facchini@univ-paris1.fr
1 University of Paris 1 Panthéon-Sorbonne, Centre d’Economie de la Sorbonne, 106-112 Bd. de L’Hôpital, 75647 Paris, France
Delorme (1983) published a book that has become a standard reference.1 According to the authors, the increase in public spending and the role of the state in the economy more broadly was made necessary by market failures and the necessarily conflictual nature of social relations in a capitalist economy.
The explanation provided by the Ministry of Finance website for the growth in public spending is largely inspired by this work. It develops the idea that the growth of the public sector does not result from public decisions alone, but from the inability of markets to self-regulate. Endogenous growth theory holds that achieving high levels of economic growth requires ensuring that private enterprises have access to a well-educated and healthy work-force, roads, courthouses, researchers, and so on (Mills and Quinet 1992; Rajhi 1993; Artus and Kaabi 1993). The Marxist regulation school proposes a similar notion based on the class-struggle theory. Public spending is a means of producing social cohesion (Vianes 1980; Aglietta and Brender 1984). According to Aglietta (1997), state intervention is necessary to mitigate the lack of demand due to the impoverishment of shareholder employees caused by financial crises. In that context, the rise in public spending is not intended to undermine capi-talism, but occurs because of it. Public spending mitigates market failures and serves to ame-liorate social relations. It buys social peace. That conclusion is in keeping with Wagner’s law. Capitalism promotes economic growth, and public spending rises as incomes expand.
The article at hand proposes and develops a very different position. Public spending is not a necessity, but rather the consequence of political choice. Government justifies the production of laws and regulations in order to protect citizens from all forms of insecurity. In that way, public spending expands inexorably.
As pointed out by Benjamin Constant, state intervention arises for two reasons: income redistribution and crises.2 Redistribution is a reason that is perfectly identified by the con-temporary economic theory of public choice. The second source, crisis, is identified by the theme of security and protection. An explanation for governmental growth can be built on both notions. It is rooted in the fact that politicians act for themselves or on behalf of others to justify their existence. The consequence is that they must convince citizens of their use-fulness. Politicians are useful if they enable citizens to externalize the costs of their choices to others (redistribution) or if they protect them from a source of danger.3 Threats, whether external or internal, exogenous or endogenous, necessarily generate a demand for protec-tion. The existence of danger makes the politician’s intervention useful.4
Danger produces fear, and fear justifies voting for laws that, once passed, must be enforced. Their implementation generates two types of costs: public, taxpayer-financed costs and private compliance costs. It is the latter that explains the expected close link between the production of laws and regulations and public spending; it gives rise to a self-reinforcing process of law and spending.
1 As Gilbert (1984) pointed out at the time, the idea was to contribute to knowledge about the economic role of the state in France by tracing the history of public spending.
2 See Higgs (1987).
3 The argument is put forward by Benjamin Constant (1822–1824) in his Commentary on Filangieri’s
Work.
4 Historically, the main danger identified by politicians was the threat of invasion (Feldman 2008). Taxa-tion was legitimated because war was imminent. Later on, many sources of danger, real and imagined, were put forward to justify state intervention: paternal tyranny, religious alienation, seigneurial exploitation, spo-liation of workers by employers, merchants’ dishonesty, the toxicity of certain goods, addiction (e.g., alco-hol, sex, gambling, drugs), crime, pollution, poverty, and so on. Uncertainty and risk are related, but the former cannot be calculated probabilistically.
A large body of literature has been dedicated to explaining public spending,5 but very few scholars have explored the link between public expenditure and legislation.6 This arti-cle proposes a theory of the dynamic interaction between law and public spending and tests the relationship with data on France spanning the period from the early 1900s to 2015.
2 The effects of excessive laws and regulations on the public
expenditure‑to‑GDP ratio
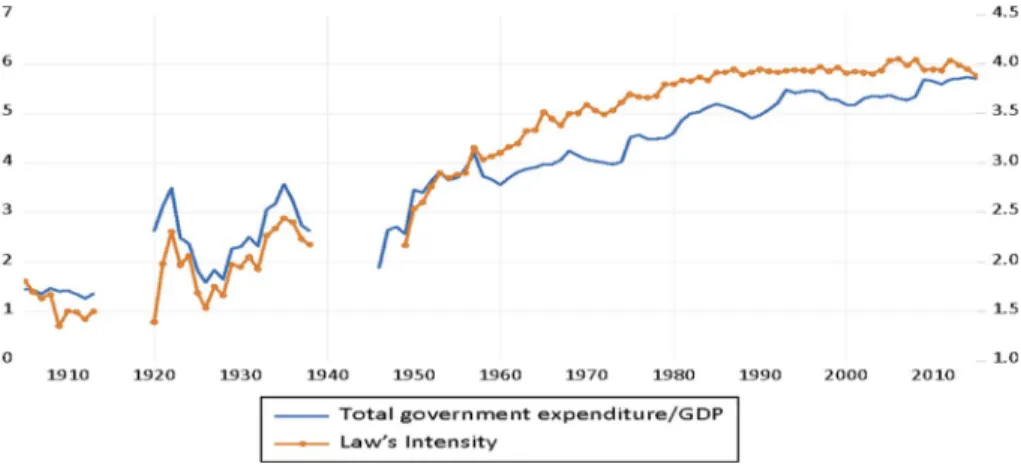
The thesis proposed here is that one of the main reasons for the growth of public spend-ing in a country like France is the production of laws and regulations. Figure 1 shows that legislative production was relatively modest before the First World War. It expanded sig-nificantly in the interwar period. It remained at comparatively low levels after the Second World War until the 1970s, after which it displayed a constant upward trend. The same figure also makes clear the close connection between the number of laws, expressed in logarithms, and the public expenditure-to-GDP ratio.7
The production of laws and regulations imposes direct and indirect costs that explain the increase in the public expenditure-to-GDP ratio.
2.1 The direct effect of laws on public expenditure
Laws influence the dynamics of government spending directly through their implementa-tion costs. Such costs are administrative costs and compliance costs. Administraimplementa-tion costs
Fig. 1 Legislative production and total government expenditure
5 See, among others, Facchini (2019).
6 See, among others, Shughart and Tollison (1986), Lagona and Padovano (2008) and Lagona et al. (2015). 7 The figure excludes the periods related to the twentieth century’s two global wars.
refer to all of the resources allocated by public and private administrations to implement laws and regulations. The costs of public administration correspond to the total number of working hours allocated by state employees to enforcing laws and promulgating regulations that give effect to enacted legislation. A traffic officer is paid to ensure that drivers fasten their seat belts, are not distracted by their mobile phones while driving, transport their chil-dren in suitable child seats, have certificates attesting that their vehicles have passed road-worthiness tests, and so on. The proliferation of laws and regulations justifies the hiring of new public servants, which increases public spending. A similar process occurs in the management of employment contracts. In 1892, for example, French politicians decided to ban the employment of children under the age of 8. They then created a body of civil serv-ants charged with implementing that law. In 1892, the number of labor law enforcers was set at 11 divisional inspectors and 92 département inspectors (Official Journal 1892).8 In 2015, the number of auditors and inspectors was 2188 (data from the Ministry of Labor). The comparison indicates a strong increase both in the number of rules governing employ-ment contracts and in the costs of administering those laws. Concerning the United States, Dudley and Warren (2016) provide an estimate of the cost of enforcing regulatory protec-tion measures. In 1960, the total spending of U.S. federal regulatory agencies was $3061 million (in constant 2009 dollars). In 2016, it was $60,666 million (Dudley and Warren
2016, Table 1.5, p. 25). When the state extends its regulatory powers to every sector of the economy, it has to levy taxes to finance the salaries of the civil servants who ensure that regulations concerning competition, occupational health, the environment, gender parity, consumer safety, sustainability of production processes, and so on are enforced. The public costs of laws and regulations are a function of the salaries and numbers of civil servants who enforce them.
The costs of complying with regulations can also cause private businesses to adopt alternative production methods and the interest groups supporting them to adopt new political strategies. They may want to externalize the costs associated with complying with laws and regulations to society as a whole. Let us illustrate that scenario with an exam-ple, before discussing the rationales underlying the externalization of compliance costs. In 1999, the French government established a system of land-use contracts (Contrat
Territo-rial d’Exploitation) and implemented a farming pollution management program (PMPOA).
To prevent water pollution caused by the leaching of toxic substances contained in liq-uid swine manure, the government asked farmers to build concrete storage tanks. Gener-ally speaking, farmers bear the costs of implementing sustainable agricultural practices (Facchini 2003). However, the costs associated with the PMPOA have not been borne by French farmers, but by the government, increasing, in such way, public expenditure. Thus, a chain of interventions was started that led to an increase in public spending.
2.2 The indirect effect of the law on the public expenditure‑to‑GDP ratio
Neither administrative expenses nor those associated with the externalization of compli-ance costs are productive expenses. The dynamic of state intervention is likely to have a negative effect on GDP growth through various channels: firstly, the production of laws, rules and their application; secondly, the fact that the law-expenditure dynamic is a
8 Official Journal (Decree of December 13, 1892), http://solid arite s-sante .gouv.fr/fichi ers/numer isati ons3/
slippery slope, since law distorts relative prices and produces a chain of resource misal-locations, creating the conditions for both new interventions and new expenditures (see Ikeda 1997). Lastly, other resources are wasted in rent seeking by interest groups to obtain measures favorable to them. Because rent seeking consumes scarce resources that could have been allocated to productive activities, excessive regulation is likely to hamper eco-nomic growth. Various scholars provide confirmation of such resource waste. Djankov et al. (2006, p. 1), for example, have observed that “using objective measures of business regulations in 135 countries, [we] establish that countries with better regulations grow faster. Improving from the worst quartile of business regulations to the best implies a 2.3 percentage point increase in annual growth”. Based on a panel of 22 industries observed annually between 1977 and 2012, Cofrey et al. (2016) find that economic growth in the United States has slowed by 0.8% on average per year since 1980 owing to the cumulative effects of regulation. The production of excessive numbers of laws and regulations, there-fore, slows GDP growth and contributes to increasing the public spending-to-GDP ratio.
3 Data and model specification
Our analysis seeks to determine whether and to what extent legislative production has influenced France’s public expenditure. For that purpose, in addition to the number of pages in France’s Official Gazette, expressed in logarithms, other variables that can affect total public expenditures have been entered as regressors in the empirical analysis. In par-ticular, the following possible independent variables were considered.
3.1 Political fragmentation
As shown by Persson and Tabellini (1999), the more fragmented the makeup of govern-ment, the stronger is the pressure to expand public spending. Assuming that each ministry represents a type of organized interest (Volkerink and de Haan 2001), an index of political fragmentation—in the estimates FRAG—is given by the number of spendthrift ministers in the coalition government.
3.2 Political ideology of government
Political ideology is the traditional explanation for governmental growth provided by political science. Ideology captures the set of citizens’ beliefs and values, in other words, their preferences. When voter political ideology shifts to the left, the socialization of risk is legitimated and public sector size increases (Pickering and Rockey 2011). Therefore, if the leftist composition of government rises and a leftist ideology is predominant in an elector-ate, we should observe more public spending.
To gauge the effect of political ideology on public spending dynamics, we rely on the percentage of seats held by right-wing deputies in the Lower Chamber of the French Par-liament (Chamber of Deputies for the Third and Fourth Republic; National Assembly for the Fifth Republic), excluding French departments and overseas territories (1905–2012). On the basis of those data, it is thus possible to determine the parliamentary representation of the right (RIGHT) and of the left as a residual.
3.3 Fiscal federalism
The level of governmental decentralization or centralization affects the dynamics of pub-lic spending. Fiscal decentralization refers to the degree of independent decision-making power at different levels of government in the provision of public goods and service (Oates
1972). A federal system generally is thought to be less favorable to public spending than a centralized system is, since it creates more intense political competition amongst political agents (Brennan and Buchanan 1980, p. 15), which limits fiscal illusion (Prohl and Schnei-der 2009) and the growth of total public spending. We enter the ratio of local tax revenues to total public revenues (FED) as a measure of the degree of fiscal decentralization. 3.4 Unemployment
The unemployment rate is intended to capture the importance over time of recourse to countercyclical fiscal policies, characterized by expansions in public spending and public budget deficits in the recessive phases of the business cycle. The expected sign on that variable—UNEMPL—is positive.
3.5 Openness
The extent of an economy’s openness to international trade influences the volatility of its domestically produced output. Some studies find that openness increases that volatility (see Rodrik 1998; Easterly 2000; Kose et al. 2003) and therefore demands recourse to stabiliza-tion policies. In that case, one should expect a positive sign on that explanatory variable. Other studies, by contrast, find that trade, because of the diversification that it promotes in many cases, reduces the volatility of output (e.g., Cavallo et al. 2008; Burgess and Donald-son 2015; Haddad et al. 2013). If so, the sign of the variable—OPEN—should be negative. 3.6 Financial repression
The term financial repression indicates various policies that allow governments to under-pay holders of publicly issued securities. Thus, high financial repression enables govern-ments to reduce the cost of public debt (Reinhart et al. 2011; Reinhart and Sbrancia 2015). Financial repression derives from the inflation rate, which helps reduce the burden of the debt in real terms. Therefore, the variable REPR indicates the value of the debt/GDP ratio net of the inflationary erosion of the numerator. When inflation rises, the debt burden declines, i.e., REPR falls, which contributes to expansive debt-financed public spending. Hence, the expected sign of REPR is negative.
3.7 Presidential form of government
The establishment of a presidential form of government (PRES) in place of a parliamentary form is comparable to the establishment of a majoritarian regime. According to scholars
like Persson and Tabellini (1999), such a form of government would then have a negative effect on public spending.
3.8 The displacement effect
The displacement effect (DISPL), pointed out for the first time by Peacock and Wise-man (1961), implies that if for some reason (wars, periods of social tension, austerity)9 or another citizens are required to pay more taxes, their level does not revert to the sta-tus quo ante once the extraordinary events have come to an end.10 The additional revenue obtained thanks to the restrictive fiscal measures adopted during crises offers policymak-ers resources to be used to grow public spending and gain electoral support. Therefore, the past ratio of taxation to GDP influences present government expenditure. Hence, the expected sign of DISPL is positive.
Bearing in mind the factors explained above, the empirical model takes as a point of reference an equation that is specified initially as follows:
where GTOT
GDP = total government expenditures relative to GDP, and PAGES is the logarithm
of the number of pages of the French Official Gazette. The main objective of the empirical model is to verify whether the number of pages of legislation, which can be considered as a proxy for the number of laws enacted and their complexity, has affected public expendi-tures of the French state.
4 Estimates and results
4.1 Methodology
The autoregressive distributed lag (ARDL) model put forward by Pesaran and Shin (1999) and later improved by Pesaran et al. (2001) is estimated herein. The model has various advantages when carrying out the test we wish to conduct.
Firstly, the ARDL model allows for an investigation of both short- and long-run rela-tionships between variables at the same time. In addition, it makes possible the analysis of relationships between variables that do not have the same degree of integration. This methodology allows mixing as regressors variables that are I(0) and I(1). Care need only be taken to avoid I(2) variables in the estimates. Secondly, with ARDL, the problem of the endogeneity of the variables does not exist, since no residual correlation exists.11 Thirdly, compared to other methods, ARDL reduces the problems of sample size (see, among oth-ers, Nkoro and Uko (2016) and omitted variables.
(1)
GTOT
GDP = a0+ a1PAGES + a2FRAG + a3RIGHT + a4FED + a5UNEMPL
+ a
6OPEN + a7REPR + +a8PRES + a9DISPL,
9 Therefore, unlike Peacock and Wiseman (1961), who focus exclusively on military spending, we make reference to a more general form of this effect which, like the ratchet effect put forward by Higgs (1987), applies to a variety of crisis variables.
10 Peacock and Wiseman (1961) provide historical evidence of this for England. Yelvington (1997) and Shughart (2018) give similar evidence for the United States.
The ARDL approach involves three steps. First, the order of integration of the variables must be checked. Even if ARDL allows the use of I(0) and I(1) variables, the method does not permit I(2) variables. Secondly, the ARDL is estimated and the existence of any long-term relationships among the variables of interest is delong-termined using the corresponding bounds test. That test is carried out by estimating an equation in which the first difference of the dependent variable is regressed on its own lags, on the first differences of the explana-tory variables, both current and lagged, and on the one-period-lagged values of the depend-ent and explanatory variables. The optimal number of lags is chosen by the minimum Schwarz-Bayesian criterion (SBC). The test consists of an F-test on the joint significance of the level variables. The null hypothesis is that the variables are not cointegrated (all coef-ficients are jointly equal to zero), while the alternative is that the variables are cointegrated (the coefficients jointly are different from zero). The asymptotic distribution of the F-test is non-standard under the null hypothesis of no cointegration. The critical values were pro-vided by Pesaran and Pesaran (1997) and by Pesaran et al. (2001). They consist of a lower and an upper bound. The lower bound’s critical value assumes that the explanatory vari-ables are stationary, while the upper bound’s critical value assumes that they are integrated of order one. Therefore, if the F-statistic is less than the lower bound value, the null is not rejected, and we conclude that no long-run relationship exists between the variables. If the
F-statistics exceeds the upper bound F-statistic, the variables are cointegrated. If the
F-sta-tistics fall between the two values, the result is inconclusive. Finally, the third step in the analysis estimates the coefficients of the long-run relationship and of the short-run elasticity of the variables with respect to the error correction representation of the ARDL model. 4.2 Data
As shown in the previous section, to investigate the nexus between total government expenditure to GDP and the number of pages in the French Official Gazette, we build a data set from several sources. The sources for the data are listed in the "Appendix". The main variable of interest, PAGES, is the (logged) number of pages of the French Official Journal. The number is determined by the last page of the December volume of the Journal Offi-ciel de la République Francaise (JORF), whose editions are displayed in the "Appendix".12 Table 1 summarizes the descriptive statistics for the variables employed in our study. 4.3 Unit root tests and multicollinearity test
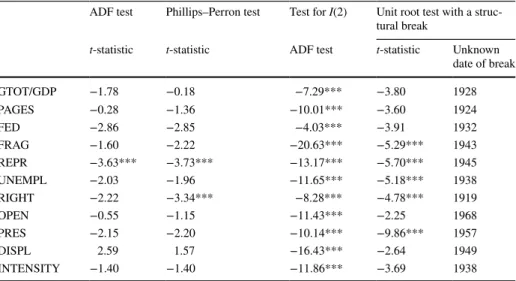
Based on the estimation procedure summarized above, the first step in the ARDL meth-odology is to check the order of integration of the variables. As is evident from the third column in Table 2, all the variables entered into the estimates satisfy the assumptions required; in other words, neither the dependent variable nor the regressors are I(2).
12 The same indicator is adopted by the “Conseil d’Etat” to measure the volume of publications (Mesurer
l’inflation législative, Annexe Indicateur de suivi de l’activité normative; see: https ://www.conse il-etat.fr/ resso urces /etude s-publi catio ns/rappo rts-etude s/etude s/mesur er-l-infla tion-norma tive. On 1 January 2016, the JORF was completely dematerialized. As of that date, only an electronic version is available. For that reason, it no longer is possible to calculate the number of pages of the French Official Journal from the paper version, but only from the PDF version. The figures are very different, and therefore our estimates end in 2015.
In particular, according to the ADF and Phillips–Perron tests, all of the variables are
I(1) except REPR, which is stationary. However, the findings are mixed for RIGHT, which
is I(0) on the Phillips–Perron test and I(1) on the ADF test.
As is well known, unit root tests fail to reject the unit root hypothesis if the series con-tain a structural break. In the last column of Table 2 we run a unit root test with a structural break at an unknown date. Some variables do not change their statistical characteristics even when structural breaks are taken into account. Other variables, on the other hand, in particular FRAG, UNEMPL, RIGHT and PRES, become stationary.
Table 1 Descriptive statistics
Pages are expressed in logarithms
Mean Maximum Minimum SD Obs.
GTOT/GDP 0.39 0.57 0.13 0.14 98 PAGES 9.61 10.15 8.96 0.25 98 REPR 0.03 0.43 − 0.16 0.07 98 DISPL 31.47 45.61 11.42 11.10 98 OPEN 35.82 61.75 15.53 12.72 98 FRAG 31.85 59.00 14.00 10.39 98 UNEMPL 4.94 12.10 0.90 3.74 98 FED 12.04 21.10 4.60 3.60 98 RIGHT 0.53 0.86 0.20 0.18 98 PRES 0.58 1.00 0.00 0.50 98 INTENSITY 3.09 4.05 1.35 0.90 98
Table 2 Unit root tests
Legend: The null hypothesis is that the variable has a unit root. The ADF test equation includes an intercept and, where significant, a trend. The number of lags included was chosen with the Schwarz information cri-terion starting from a maximum of 6 lags. *** means rejection at 99%, so variables with stars are stationary while variables with no stars are integrated of order one
ADF test Phillips–Perron test Test for I(2) Unit root test with a struc-tural break
t-statistic t-statistic ADF test t-statistic Unknown date of break GTOT/GDP −1.78 −0.18 −7.29*** −3.80 1928 PAGES −0.28 −1.36 −10.01*** −3.60 1924 FED −2.86 −2.85 −4.03*** −3.91 1932 FRAG −1.60 −2.22 −20.63*** −5.29*** 1943 REPR −3.63*** −3.73*** −13.17*** −5.70*** 1945 UNEMPL −2.03 −1.96 −11.65*** −5.18*** 1938 RIGHT −2.22 −3.34*** −8.28*** −4.78*** 1919 OPEN −0.55 −1.15 −11.43*** −2.25 1968 PRES −2.15 −2.20 −10.14*** −9.86*** 1957 DISPL 2.59 1.57 −16.43*** −2.64 1949 INTENSITY −1.40 −1.40 −11.86*** −3.69 1938
Because the data set mixes I(0) and I(1) variables, the ARDL methodology appears to be the most suitable one available for estimating the determinants of public spending in France.
The regression analysis can efficiently estimate the relationship between the independ-ent variables and the dependindepend-ent variable if a non-perfect linear relationship exists between the independent variables—in other words, if multicollinearity is not evident. To establish multicollinearity’s presence or absence, we apply the variance inflation factor (VIF) test (see Myers 1990).
If the VIF value exceeds 10, a strong linear relationship exists. The values given in Table 3 show that no independent variable has a VIF above 10. We can therefore exclude multicollinearity issues among the independent variables.
4.4 Cointegration test
The second step in the ARDL methodology consists in testing whether the variables entered into the empirical model are cointegrated. Prior to that test, we first needed to choose the number of lags to introduce into the ARDL estimates. To do so, we chose a maximum of four lags. Starting from that number, the Schwartz criteria select the optimum number of lags for each variable.
From the results of the estimates (Table 4) carried out using the optimal lag lengths thus obtained, it is evident that the F-value always exceeds the upper bound. That result allows us to conclude that the variables entered are indeed cointegrated.
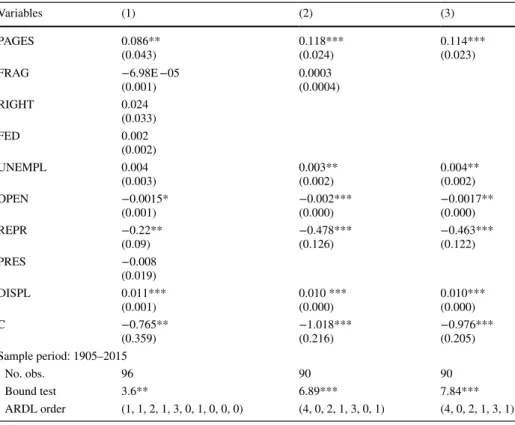
4.5 Results
Lastly, we consider the long-run coefficients from the ARDL reported in Table 4, column (1), which shows that, as expected, PAGES is significant and bears the expected sign. Vari-ous other variables, on the other hand, are largely insignificant. Column (2) therefore does not include RIGHT, FED or PRES. Column (2) implies that FRAG remains insignificant.
The final equation, then, is the one reported in column (3). Based on the Cusum and Cusum square tests it is stable.
This estimate indicates that the level of French public spending in relation to GDP is influenced not only by the number of pages of laws passed, but also by the displace-ment effect, the degree of the country’s openness, its level of financial repression and its
Table 3 VIF multicollinearity
test VIF Tolerance (1/VIF)
PAGES 6.33 0.16 FED 3.80 0.26 FRAG 3.35 0.30 REPR 1.29 0.78 UNEMPL 8.77 0.11 RIGHT 2.58 0.39 OPEN 5.28 0.19 PRES 6.16 0.16 DISPL 9.74 0.10
unemployment rate. In particular, as is to be expected, when financial repression is heavy, and therefore the public debt-to-GDP ratio corrected for that effect (REPR) weakens, the public expenditure-to-GDP ratio rises, while increases in displacement and unemployment have positive effects on the ratio. The results suggest that more openness of the French
Table 4 Long-run coefficients (dependent variable: total government spending to GDP)
Legend: ***rejection at 99%, **rejection at 95%, *rejection at 10%. Stars in the bound test mean that the variables are cointegrated
Variables (1) (2) (3) PAGES 0.086** (0.043) 0.118***(0.024) 0.114***(0.023) FRAG −6.98E −05 (0.001) 0.0003(0.0004) RIGHT 0.024 (0.033) FED 0.002 (0.002) UNEMPL 0.004 (0.003) 0.003**(0.002) 0.004**(0.002) OPEN −0.0015* (0.001) −0.002***(0.000) −0.0017**(0.000) REPR −0.22** (0.09) −0.478***(0.126) −0.463***(0.122) PRES −0.008 (0.019) DISPL 0.011*** (0.001) 0.010 ***(0.000) 0.010***(0.000) C −0.765** (0.359) −1.018***(0.216) −0.976***(0.205) Sample period: 1905–2015 No. obs. 96 90 90 Bound test 3.6** 6.89*** 7.84*** ARDL order (1, 1, 2, 1, 3, 0, 1, 0, 0, 0) (4, 0, 2, 1, 3, 0, 1) (4, 0, 2, 1, 3, 1)
economy to international trade negatively affects the public expenditure-to-GDP ratio. It would appear, therefore, that in the case of France, the effects of the diversification of exports offset the output repercussions of any possible foreign trade shocks.
4.6 The robustness test
The estimates reported in Table 4 show that the number of pages of laws enacted affect the public expenditure-to-GDP ratio. It is important, however, to establish whether that influ-ence has become stronger with time, that is to say, whether the extent of French govern-ment intervention in the economy has increased over time and, if so, the ways in which it has happened.
Part (a) of Fig. 2 shows that the French government’s production of legislation intensi-fied significantly after the Second World War.13 Considering a 5-year moving average, as a way of smoothing economic cycles, the figure shows a strong inverse correlation between the numbers of laws produced and the economy’s rate of growth since 1965.14
It can therefore be said that growth in legislation led to growth in the public expend-iture-to-GDP ratio by slowing the growth of the denominator. However, legislation has also influenced the numerator’s time trend. Figure 3 demonstrates that French govern-ment spending per page of legislation (which can be taken as a measure of the public spending associated with each law) shows a close correlation with the trend in the pub-lic-spending-to-GDP ratio. The correlation is very close after the Second World War, during which period both government spending per page—henceforth, the intensity of spending—and the public spending-to-GDP ratio rose sharply until the 1980s. Their values later stabilized.
Fig. 3 Intensity of spending and public spending/GDP
13 The finding confirms the argument put forward by Facchini and Melki (2013), according to which a negative link between public expenditure and growth has become particularly relevant since the 1960s. 14 An ordinary least squares (OLS) regression estimated over the period 1910–2011 shows that a 1% increase in the 5-year average of laws produced is associated with a drop in the 5-year average growth rate of 0.1 percentage points per year.
The increase in the intensity of spending indicates growing levels of state tion in the economy. While during the period before the First World War such interven-tion was often in the form of regulatory measures and rules, in the post-war period it primarily took the form of spending laws, most of which had the purpose of expanding the welfare state. That shift occurred already in the period immediately following the Second World War. In subsequent decades, the tendency to adopt measures of social protection became consolidated with governments of different political hues as well. As Fig. 2b shows, public spending per law passed is associated with a decline in the economy’s growth rate.
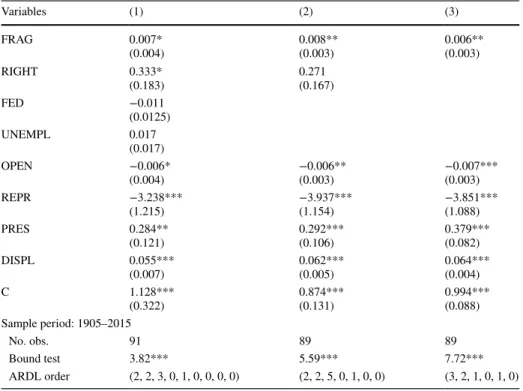
In order to clarify the factors that contributed over time to raising spending intensity, we carried out a robustness test, entering real public expenditure per law, i.e., INTEN-SITY, as a dependent variable, and the same control variables entered into the estimates reported in Table 4 as regressors. As before, we applied the ARDL methodology; the reference sample remains the same.
We first tested for multicollinearity. As shown by the VIF test in Table 5, no independ-ent variable has a VIF above 10. Thus, we again can exclude problems of multicollinearity among the independent variables.
Table 6 shows the long-run coefficients from the ARDL for the spending intensity asso-ciated with laws enacted. As is clear from column (1), FED and UNEMPL appear to have no influence on the intensity of spending. Those variables drop from the model in column (2), which also shows that RIGHT becomes insignificant.
In the estimates of column (3), all variables are significant. The Cusum and Cusum square tests shows they are stable.
The signs of the variables are as expected, apart from PRES, which carries a positive as opposed to a negative sign, indicating that a presidential form of government brings with it an increase in spending intensity on a par with the fragmentation index (FRAG) and the displacement effect (DISPL). Conversely, increases in REPR and OPEN contribute to reducing public spending per page of laws passed.
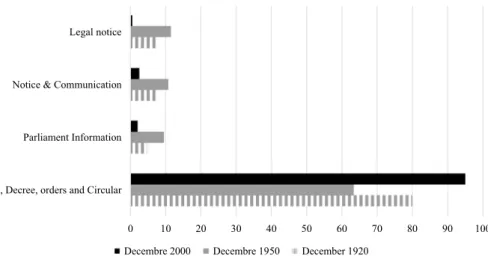
0 10 20 30 40 50 60 70 80 90 100
Law, Decree, orders and Circular Parliament Information Notice & Communication Legal notice
Decembre 2000 Decembre 1950 December 1920
Source: Indicateurs de suivi de l’activité normative, Premier Ministre, Service général du gouvernement, 2018.
Figure 2a, b show that in post-war France, interference by the state in the economy increased in terms of both more active market regulation and total public spending. It was during the post-war period that the idea of more state intervention in the economy took the upper hand amongst France’s political class.15 The dominance of that ideological orientation
Table 5 VIF multicollinearity
test (dependent variable: spending intensity) VIF Tolerance (1/VIF) FED 3.48 0.29 FRAG 3.53 0.28 REPR 1.13 0.88 UNEMPL 8.16 0.12 RIGHT 1.91 0.52 OPEN 3.64 0.27 PRES 4.85 0.21 DISPL 9.12 0.11
Table 6 Robustness test (dependent variable: spending intensity)
Variables (1) (2) (3) FRAG 0.007* (0.004) 0.008**(0.003) 0.006**(0.003) RIGHT 0.333* (0.183) 0.271(0.167) FED −0.011 (0.0125) UNEMPL 0.017 (0.017) OPEN −0.006* (0.004) −0.006**(0.003) −0.007***(0.003) REPR −3.238*** (1.215) −3.937***(1.154) −3.851***(1.088) PRES 0.284** (0.121) 0.292***(0.106) 0.379***(0.082) DISPL 0.055*** (0.007) 0.062***(0.005) 0.064***(0.004) C 1.128*** (0.322) 0.874***(0.131) 0.994***(0.088) Sample period: 1905–2015 No. obs. 91 89 89 Bound test 3.82*** 5.59*** 7.72*** ARDL order (2, 2, 3, 0, 1, 0, 0, 0, 0) (2, 2, 5, 0, 1, 0, 0) (3, 2, 1, 0, 1, 0)
15 The differing extents of interference by the state in the French economy in the preceding period and in the period immediately following the Second World War shows that, as pointed out by Lamoreaux and Rosenthal (2005), intervention did not depend on the presence of civil law or common law institutions, as maintained by the Law and Finance hypothesis, but rather on the ideological orientations of the respective governments. On the importance of ideological orientation in the passing of laws by elected bodies, see, in particular, Roe (1994, 2003).
translated above all into regulatory interventions that changed relative prices and the costs of producing goods.16 Indeed, between 1944 and 1946 the French government under Charles De Gaulle, invoking the need to promote the reconstruction of the country, undertook the nationalization of various companies in the energy, transportation and finance sectors.
The second type of state intervention, namely the rise in public spending associated with the passing of legislation, began to be adopted on a massive scale, especially from the latter half of the 1960s onwards, when Keynesian ideology came to prevail in the govern-ment’s approach to economic policy.
However, the nexus between the total number of laws and the spending associated with each law is also endogenous: legislative intervention by the state leads to additional spending on the implementation of the laws in question. It is no accident, therefore, that, as Fig. 3a, b show, a rise in spending intensity corresponds to an increase in legislative production.
As we said in the introduction, rulers regulate the economic and social lives of citizens in response to real or presumed sources of danger. Such regulation brings with it more public spending. The self-reinforcing association between laws and public spending can be explained by paternalistic attitudes or by the vote motives animating popularly elected politicians. The multiplicity of dangers and their constant renewal bring extensions of the state into all areas of life. Perception of mounting risks and sense of urgency become the driving force behind public intervention and ultimately increases in public spending. Pater-nalism justifies the production of laws and regulation under the guise of protecting citi-zens from themselves. That governmental attitude applies especially to France. Charles de Gaulle once wrote that “France can only maintain itself through the state. Nothing is more important than the legitimacy, the institutions and the functioning of the state…. I am sure
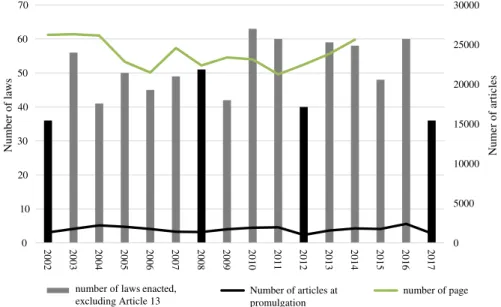
0 5000 10000 15000 20000 25000 30000 0 10 20 30 40 50 60 70 2002 2003 2004 2005 2006 2007 2008 2009 2010 2011 2012 2013 2014 2015 2016 2017 Numer of articles Number of laws
number of laws enacted,
excluding Article 13 Number of articles at promulgation number of page Source: Indicateurs de suivi de l’activité normative, Premier Ministre, Service général du gouvernement, 2018.
Fig. 5 Comparison of the number of laws and the number of articles at the promulgation (2000–2017)
that I will find in the Conseil d’Etat the support that it has always provided to the Republic and to France”.17 In that perspective, public service is “an activity of general interest man-aged under the control of a public person”.
5 Conclusions
This paper has shown empirically that in France, over the period 1905–2015, the pro-duction of legislation led to increases in the ratio of public spending to GDP. Fundamen-tally, one can advance three reasons for that finding. On the one hand, the passing of laws inevitably leads to an expansion of the administrative apparatus needed to implement and enforce compliance with laws passed. Secondly, a plethora of laws and regulations has a negative effect on the efficiency with which resources are allocated by the private sector, leading to a slowing of economic growth and, thus, of GDP. Thirdly, starting from the period immediately following the Second World War, the intensity of spending associated with laws increased progressively, especially so in support of an expanded welfare state, and this also led to an increase in the public expenditure-to-GDP ratio.
The considerable contribution of laws to increases in the spending-to-GDP ratio, as reported herein, is consistent with the increasingly paternalistic attitude of policymakers. When individuals give in to this attitude, the role of the state in the economy expands, as does public spending. These results could provide motivation for a study on the effects of laws’ production on the single components of public expenditure.
Funding Open access funding provided by Università degli Studi di Genova within the CRUI-CARE
Agreement.
Open Access This article is licensed under a Creative Commons Attribution 4.0 International License,
which permits use, sharing, adaptation, distribution and reproduction in any medium or format, as long as you give appropriate credit to the original author(s) and the source, provide a link to the Creative Com-mons licence, and indicate if changes were made. The images or other third party material in this article are included in the article’s Creative Commons licence, unless indicated otherwise in a credit line to the material. If material is not included in the article’s Creative Commons licence and your intended use is not permitted by statutory regulation or exceeds the permitted use, you will need to obtain permission directly from the copyright holder. To view a copy of this licence, visit http://creat iveco mmons .org/licen ses/by/4.0/.
Appendix
A.1. Description and sources of variables
Name Description Source
GTOT/GDP Total government expenditure net of public
investment/GDP 1905–1938 and 1947–1958. Flora (1959–2015. INSEE: 1983) Expenditures and receipts of general
govern-ment https ://www.insee .fr/en/stati stiqu es/23879 25?somma ire=23879 99
Gross domestic product and its components at current prices (billions of euros)
https ://www.insee .fr/en/stati stiqu es/23878 82?somma ire=23879 99
PAGES Number of pages (in logs) of the French
Official Journal The number is the last page of the Decem-ber volume of the French Official Journal (JORF). The same indicator is used by the “Conseil d’Etat” to measure the volume of publication (Mesurer l’inflation législative, Annexe Indicateur de suivi de l’activité normative; Link: https ://www.conse il-etat. fr/resso urces /etude s-publi catio ns/rappo rts-etude s/etude s/mesur er-l-infla tion-norma tive)
FED Share of local source tax revenue in total
revenue (%) 1905–1938, « Annuaire Statistique de la France » (ASF), vol. 1966 Table XIIB: Financial situation of local government 1948–1978. ASF 1948–1988
1978–2015. INSEE. Expenditures and receipts of general government in 2015—National accounts—Base 2010, Table 3.215—Compulsory levies of general government and European Union institu-tions (billions of euros). Link: https ://www. insee .fr/en/stati stiqu es/23879 25?somma ire=23879 99 (consulted March 2020) FRAG Number of spendthrift ministers in the
coalition government 1905–1989. Yvert (1989–2015. The website of the French 1990) national assembly. Tous les gouvernements
depuis 1958, Link:
http://www2.assemblee-nationale.fr/decou-vrir-l-assemblee/histoire/la-ve-republique/ tous-les-gouvernements-depuis-1958
Name Description Source
REPR (1-inflation rate)*Debt/GDP INFLATION. The indicators of consumer
prices in the different databases proposed by Mitchell (1975, Table H.2, Cost of Liv-ing/Consumer Price Indexes 1905–1914 (1914 = 100). From 1914 to 1948 the base is from 1929, then for the period 1948–1965 the base is 1953, then the base goes from 1970 until 1993. The base changes again in 2000. Inflation rates have been calculated from these indicators taking into account the changes in base each time
PUBLIC DEBT. Years 1905–1939: Data from the Villa P./CEPII series. http://www.cepii .fr/franc graph /bdd/villa /mode.htm. Years 1940–1962: Data from the INSEE’s Retro-spective Statistical Yearbook dating from 1966 (pp. 494–495). Years 1963–1985: Data from INSEE’s retrospective statistical yearbook dating from 1990 (p. 619) (data from new francs; the conversion into euros of the entire series up to 1987 is done by switching to new francs when the figures are in old francs, then dividing by 6.55957 to convert to euros). Years 1986–2015: INSEE national accounts data GDP. 1905–1950: Data from the Villa P
series. Years 1950–1965: Data from the INSEE retrospective statistical yearbook of 1966 (pp. 555–556). Years 1966–1985: Data taken from the INSEE website, data in euros, so the conversion into new francs is made by multiplying the value in euros by 6.55957 (http://www.bdm.insee .fr/bdm2/affic hageS eries .actio n?idban k=00162 5867&codeG roupe =1336). Years 1986–2015: INSEE national accounts data
UNEMPL Unemployment rate 1905–1975. Séries longues
macroéconom-iques Villa P./CEPII http://www.cepii .fr/ franc graph /bdd/villa /mode.htm
1975–2015; Unemployment rate forecast OECD, Link: https ://data.oecd.org/unemp / unemp loyme nt-rate-forec ast.htm
RIGHT Percentage of seats held by right-wing deputies in the Lower Chamber of the French Parliament
Chamber of Deputies for the Third and Fourth Republic and National Assembly for the Fifth Republic excluding French depart-ments and overseas territories
Website of the French National Assembly:
http://www.assem blee-natio nale.fr/histo ire/ index .asp: distribution of the seats in the French National Assembly according to the different political parties
OPEN Ratio of the sum of exports and imports to
GDP 1905–1970, Asselain and Blancheton (1970–2015, World Bank, https ://data.world 2005) bank.org/indic ator/NE.TRD.GNFS.ZS
Name Description Source
PRES Dummy = 1 for presidential governments The Third Republic and the Fourth Republic were parliamentary regimes, while the Fifth Republic was a semi-presidential regime. Originally conceived as a parliamentary regime in which the powers of the executive were strengthened, following the 1962 ref-erendum that established the election of the President of the Republic by direct universal suffrage, the Fifth Republic has become a semi-Presidential regime
DISPL Ratio between taxation and GDP 1905–1958: GDP data are from INSEE retro-spective statistical yearbook. The data are in millions of old francs up to 1950, then from 1951 onwards in billions of old francs. They are converted into euros using the conver-sion rate: 655.957 AF = 1€. It is estimated tat, even if it was not clearly mentioned in the yearbook, the amounts are in current values. The amounts obtained are therefore in current euros. After we calculate the share of receipts of general government on GDP
1959–2015, all the data come from INSEE [1959–2015. Expenditures and receipts of general government INSEE Link: https ://www.insee .fr/en/stati stiqu es/23879 25?somma ire=23879 99 and INSEE 1.101– Gross domestic product and its components at current prices (billions of euros) Link: INSEE https ://www.insee .fr/en/stati stiqu es/23878 82?somma ire=23879 99] INTENSITY French government spending per page of
legislation See Total Government spending and Pages
A.2. France Official Journal editions and number of pages
The idea for this work lies in the archives of the Cujas library of the Faculty of Law of Paris. We used their collection of Official Journals of French Republic. To count the num-ber of pages we took the last page of the volume of the Official Journal on 31 Decemnum-ber of each year. Between 1976 and 1983, a new layout was adopted, distinguishing the clas-sic Official Journal pages from the pages marked CN, i.e., additional pages. However, this presentation was abandoned in 1985. On 1 January 2016, the JORF ceased to be a physical document. From then on, there has only been an electronic version published. Given this, it is no longer possible to count the number of pages of the French Official journal on the physical paper version, but only on the PDF version. The series, therefore, ends in 2015.
The Official Journal publishes the following documents every year: Laws (Parliament), Ordinances (Government), Decrees (activity of the 1st minister), Orders (activity of min-isters), Circulars (activity of the administration in the broad sense), Administrative deci-sions (activity of the high administration), instructions and opinions. The circulars are, for instance, about defense, agriculture, education, health, security, ecology, housing, public function, administration, migration, finance, urban, firm, or foreign affairs. In 2015 the
service of the prime minister counts 33 laws, 13 orders, 82 decrees and 75 administration decisions. Figure 4 presents the structure of the official journal for 3 years (1920, 1950 and 2000). The legislative activity per se increases in 2000, but the overall structure is the same. However, the calculation has been done by hand and should be seen as an approxi-mation. Figure 5 reports the number of laws and the number of articles at the promulgation for the period 2000-2017. (Fig. 5).
References
Aglietta, M. (1997). Régulation et crises du capitalism (3rd ed.). Paris: Odile Jacob.
Aglietta, M., & Brender, A. (1984). Les métamorphoses de la société salariale. La France en projet. Paris: Calmann-Lévy.
André, C., & Delorme, A. (1983). L’Etat et l’économi. Un essai d’explication de l’évolution des dépenses
publiques en France 1870–1980. Paris: Éditions du Seuil.
Artus, P., & Kaabi, M. (1993). Dépenses publiques, progrès technique et croissance. Revue Économique, 44, 287–318.
Asselain, J. C., & Blancheton, B. (2005). Dynamique de l’ouverture internationale. Paradoxes, enjeux, élé-ments d’interprétation à partir du cas de la France. Economies et Sociétés, série histoire économique
quantitative, AF, 32, 49–179.
Bouvier, J. (1978). Histoire financière et problèmes d’analyse des dépenses publiques. Annales, 33, 207–215.
Brennan, G., & Buchanan, J. M. (1980). The power to tax: Analytical foundations of a fiscal constitution. Cambridge: Cambridge University Press.
Burgess, R., & Donaldson, D. (2015). Railroads and the demise of famine in colonial India. MIT, mimeo. Cavallo, E., De Gregorio, J., & Loayza, N. (2008). Output volatility and openness to trade: a reassessment.
Brookings Institution Press, Economia, 9, 105–152.
Cofrey, B., McLaughlin, P., & Peretto, P. (2016). The cumulative cost of regulations. Mercatus Working Paper, April 26. https ://www.merca tus.org/publi catio n/cumul ative -cost.regul ation s.
Constant, B. (1822–1824). Commentaire sur l’ouvrage de Filangieri. Paris: Les Belles Lettres. Ed. 2004. Djankov, S., McLiesh, C., & Ramalho, R. (2006). Regulation and growth. Economics Letters, 92, 395–401. Dudley, S., & Warren, M. (2016). Regulators’ budget increases consistent with growth in fiscal budget.
An analysis of the U.S. budget for fiscal years 2015 and 2016. Annual Report 2015, Regulator budget
report 37. Weidenbaum Center Regulatory Studies Center, Washington University; The George
Wash-ington University St. Louis, WashWash-ington. http://wc.wustl .edu and http://www.Regul atory Studi es.gwu. ed.
Easterly, W., Islam, R., & Stiglitz, J. (2000). Explaining growth volatility. World Bank, January.
Facchini, F. (2003). La contractualisation des aides en agriculture: à qui doit-on donner les droits?
Écono-mie Rurale, 273, 243–250.
Facchini, F. (2019). What are the determinants of public spending? An overview of the literature. Atlantic
Economic Journal, 46, 419–439.
Facchini, F., & Melki, M. (2013). Efficient government size: France in the 20th century. European Journal
of Political Economy, 31, 1–14.
Feldman, J. P. (2008). Le constitutionnalisme selon Benjamin Constant. Revue Française de Droit
Constitu-tionnel, 76, 675–702.
Flora, P. (1983). State, economy, and society in western Europe 1815–1975. London: St. James Press. Gilbert, G. (1984). Analyses critiques de Delorme R., & André, C., L’état et l’économie. Un essai
d’explication de l’évolution des dépenses publiques en France 1870–1980. Politiques et Management
Public, 2, 148–152.
Haddad, M., Lim, J., Pancaro, C., & Saborowski, C. (2013). Trade openness reduces growth volatility when countries are well diversified. Canadian Journal of Economics, 46, 765–780.
Herzog, P. (1973). A propos de la notion d’économie publique. Revue Économique, 24, 139–162.
Higgs, R. (1987). Crisis and leviathan. Critical episodes in the growth of American government. New York, NY: Oxford University Press.
Ikeda, S. (1997). Dynamics of the mixed economy: Toward a theory of interventionism. New York, NY: Routledge.
Kose, A., Prasad, E., & Terrones, M. (2003). Financial integration and macroeconomic volatility. IMF Staff
Lagona, F., Maruotti, A., & Padovano, F. (2015). Multilevel multivariate modeling of legislative count data, with a hidden Markov chain. Journal of the Royal Statistical Society, Series A, 178, 705–723. Lagona, F., & Padovano, F. (2008). The political legislation cycle. Public Choice, 134, 201–229.
Lamoreaux, N. R., & Rosenthal, J. L. (2005). A comparison of business’s organizational choices in France and the United States during the era of industrialization. American Law and Economics Review, 7, 28–61.
Mills, P., & Quinet, A. (1992). Dépenses publiques et croissance. Revue Française d’Economie, 7, 29–60. Mises, L. (1929). A critique of interventionism. New Rochelle: Arlington House, ed. 1977.
Mitchell, B. R. (1975). European historical statistics, 1750–1970. London: Palgrave-MacMillan. Myers, R. H. (1990). Classical and modern regression with applications. Boston, MA: PWS-Kent. Nkoro, E., & Uko, A. K. (2016). Autoregressive distributed lag (ARDL) cointegration technique:
applica-tion and interpretaapplica-tion. Journal of Statistical and Econometric Methods, 5, 63–91. Oates, W. E. (1972). Fiscal federalism. New York, NY: Harcourt Brace Jovanovich.
Peacock, A. T., & Wiseman, J. (1961). The growth of public expenditure in the United Kingdom. Princeton, NJ: Princeton University Press.
Persson, T., & Tabellini, G. (1999). The size and scope of government: Comparative politics with rational politicians. European Economic Review, 43, 699–735.
Pesaran, M. H., & Pesaran, B. (1997). Working with Microfit 4.0: Interactive econometric analysis. Oxford: Oxford University Press.
Pesaran, M. H., & Shin, Y. (1999). An autoregressive distributed lag modeling approach to cointegration analysis. In S. Strom (Ed.), Econometrics and economic theory in the 20th century. Cambridge: Cam-bridge University Press.
Pesaran, M. H., Shin, Y., & Smith, R. J. (2001). Bounds testing approach to the analysis of level relation-ships. Journal of Applied Economics, 16, 289–326.
Pickering, A., & Rockey, J. (2011). Ideology and the growth of government. The Review of Economics and
Statistics, 93, 907–919.
Prohl, S., & Schneider, F. (2009). Does decentralization reduce government size? A quantitative study of the decentralization hypothesis. Public Finance Review, 37, 639–664.
Rajhi, T. (1993). Croissance endogène et externalités des dépenses publiques. Revue Économique, 44, 335–368.
Rangeon, F. (1986). L’idéologie de l’intérêt général, préface de Georges Vedel. Paris: Economica. Reinhart, C., Kirkegard, J. F., & Sbrancia, M. B. (2011). Financial repression redux. Finance and
Develop-ment, 48, 24–26.
Reinhart, C., & Sbrancia, M. B. (2015). The liquidation of government debt. IMF working paper no. WP/15/7.
Rodrik, D. (1998). Why do more open economies have bigger governments? The Journal of Political
Econ-omy, 106, 997–1032.
Roe, M. J. (1994). Strong managers, weak owners. Princeton, NJ: Princeton University Press. Roe, M. J. (2003). Political determinants of corporate governance. Oxford: Oxford University Press. Rosanvallon, P. (1990). L’etat en France de 1789 à nos jours. Paris: Éditions du Seuil.
Shughart, W. F., II. (2018). Selective consumption taxes in historical perspective. In A. J. Hoffer & T. Nesbit (Eds.), For your own good: Taxes, paternalism, and fiscal discrimination in the twenty-first century. Arlington, TX: Mercatus Center at George Mason University.
Shughart, W. F., II, & Tollison, R. D. (1986). On the growth of government and the political economy of legislation. Research in Law and Economics, 9, 111–127.
Vianes, A. (1980). La raison économique d’etat. Lyon: Presses Universitaires de Lyon.
Volkerink, B., & de Haan, J. (2001). Fragmented government effects on fiscal policy: New evidence. Public
Choice, 109, 221–242.
Yelvington, B. (1997). Excise taxes in historical perspective. In W. F. Shughart II (Ed.), Taxing choice: The
predatory politics of fiscal discrimination. New Brunswick: Transaction.
Yvert, B. (1990). Dictionnaire des ministres (1789–1989). Paris: Perrin.
Publisher’s Note Springer Nature remains neutral with regard to jurisdictional claims in published maps and