REPORT
Asymmetric divisions are essential for the generation of cell fate and size diversity. They implicate cortical domains
where minus end–directed motors, such as dynein, are activated to pull on microtubules to decenter asters attached to
centrosomes, nuclei, or spindles. In asymmetrically dividing cells, aster decentration typically follows a centering phase,
suggesting a time-dependent regulation in the competition between microtubule centering and decentering forces. Using
symmetrically dividing sea urchin zygotes, we generated cortical domains of magnetic particles that spontaneously
cluster endogenous dynein activity. These domains efficiently attract asters and nuclei, yielding marked asymmetric
divisions. Remarkably, aster decentration only occurred after asters had first reached the cell center. Using intracellular
force measurement and models, we demonstrate that this time-regulated imbalance results from a global reduction of
centering forces rather than a local maturation of dynein activity at the domain. Those findings define a novel paradigm for
the regulation of division asymmetry.
Asymmetric division through a reduction of
microtubule centering forces
Jérémy Sallé, Jing Xie, Dmitry Ershov, Milan Lacassin, Serge Dmitrieff, and Nicolas Minc
Introduction
During cell division, multiple cues are integrated to determine the relative position and size of daughter cells. Cell geometry, polar domains, or sites of cell–cell adhesion may, for instance, influence microtubule (MT) aster forces, which move and orient centrosomes, nuclei, and spindles to generate the wide variety of division types observed in different cells and tissues (Grill et al., 2001; Théry et al., 2005; Minc et al., 2011). One of the most striking examples of division positioning control is asymmetric division. During this process, asters, nuclei, and spindles are usually first centered in the cell and then become displaced to one side, leading to the unequal segregation of cytoplasmic and cortical contents and producing cells with distinct sizes (Dan, 1979; Kaltschmidt et al., 2000; Kaltschmidt and Brand, 2002; Kimura and Onami, 2007). Asymmetric division is a common mechanism to generate fate diversity from yeast to humans, par-ticularly well-studied in lineage progenitors, in stem cells, and in the Caenorhabditis elegans zygote (Gönczy, 2008; Morin and Bellaïche, 2011). Upstream signals responsible for asymmetry have been largely identified in such model cell types, but how downstream mechanical forces can orchestrate a robust and re-producible asymmetric division still remains unclear.
In animal cells, aster positioning is dynamically controlled by MT forces (Reinsch and Gönczy, 1998; Minc and Piel, 2012; Mitchison et al., 2012). Cytoplasmic dynein is one of the main MT-associated motors responsible for aster positioning. Dynein
may generate cytoplasmic pulling forces, from the viscous drag created by the motion of endomembranes, such as the endoplas-mic reticulum, or other vesicle cargos, it drives toward asters’ centers (Hamaguchi et al., 1986; Kimura and Kimura, 2011). This process may result in MT forces that scale to their length, and en-sure aster centration and orientation with respect to cell geome-try (Hamaguchi and Hiramoto, 1986; Kimura and Onami, 2005; Wühr et al., 2010; Minc et al., 2011; De Simone et al., 2018; Haupt and Minc, 2018). Dynein motors may also be anchored at the cell cortex within specific polar domains to generate asymmetric pulling forces that decenter asters for asymmetric division (Grill et al., 2001; Colombo et al., 2003). Regulation of the balance be-tween cytoplasmic and cortical dynein forces is most likely at the heart of most division geometries, like those found during cleav-age or stem cell linecleav-age (Kaltschmidt and Brand, 2002; Mitchison et al., 2012; Pierre et al., 2016). However, given the difficulty of manipulating an inherently asymmetric division in a controlla-ble and quantitative manner, the generic mechanisms regulating this competition remain mostly unexplored.
We implemented magnetic cortical domains that sponta-neously cluster dynein minus end activity in sea urchin (Para-centrotus lividus) zygotes. These domains transform the first symmetric cleavage typical of those cells into a marked asymmet-ric division. We find that centering asters are relatively insensi-tive to the domain and can be decentered only after they reach the
© 2018 Sallé et al. This article is distributed under the terms of an Attribution–Noncommercial–Share Alike–No Mirror Sites license for the first six months after the publication date (see http:// www .rupress .org/ terms/ ). After six months it is available under a Creative Commons License (Attribution–Noncommercial–Share Alike 4.0 International license, as described at https:// creativecommons .org/ licenses/ by -nc -sa/ 4 .0/ ).
Institut Jacques Monod, Centre National de la Recherche Scientifique UMR7592 and Université Paris Diderot, Paris, France.
Correspondence to Nicolas Minc: nicolas.minc@ ijm .fr; D. Ershov’s present address is Image Analysis Hub at Institut Pasteur, Paris, France. on October 9, 2019
jcb.rupress.org
Downloaded from
http://doi.org/10.1083/jcb.201807102
cell center. Combined in vivo force measurements and computer simulations support a novel paradigm in which asymmetric divi-sions may be triggered by a reduction in centering forces under constant cortical pulling forces.
Results and discussion
Magnetic cortical pulling domains to control the asymmetry of cell division
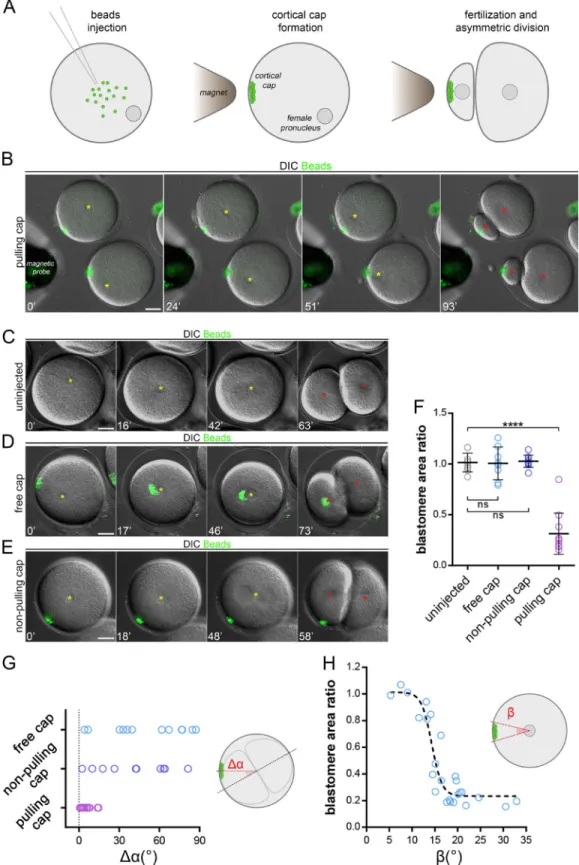
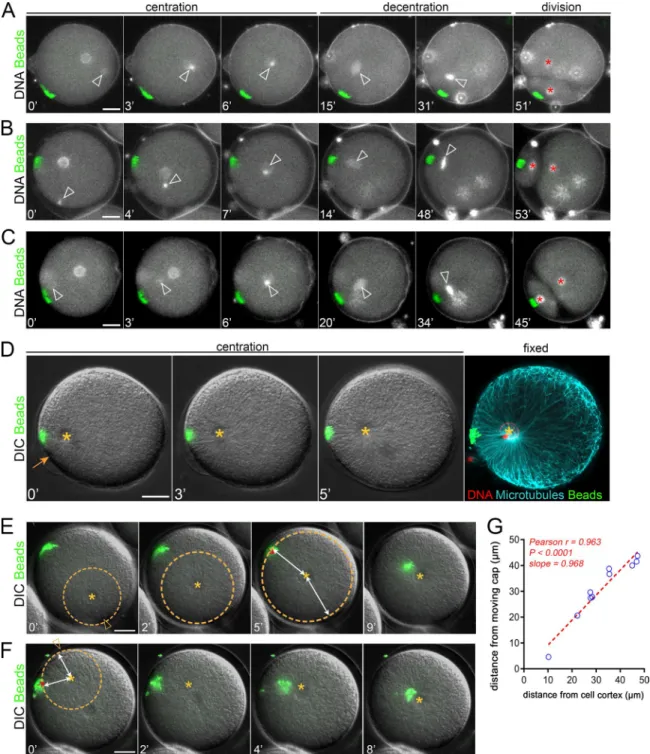
Certain particles injected into neurons or marine embryos may spontaneously exhibit minus end–directed movement to cluster around centrosomes (Adams and Bray, 1983; Hamaguchi et al., 1986). By screening magnetic particles injected into sea urchin zygotes, we found one type of particle displaying highly per-sistent MT minus end motion that formed compact aggregates at the aster center in a dynein-dependent manner (Fig. S1, A–C; Tanimoto et al., 2018). Using calibrated magnetic probes, we as-sembled, relocated, and retained cortical domains made of those beads of ∼5–10 µm in size (Fig. S1 D and Video 1). To test whether these domains loaded with dynein activity could pull on MTs to drive asymmetric divisions, we assembled them in nonfertilized eggs and added sperm. Strikingly, ∼20–30 min after fertiliza-tion, the zygote nucleus, which is normally maintained in the cell center, became attracted by the domain and exhibited a net asymmetric displacement. As occurs during symmetric divisions in those cells, the mitotic spindle formed after the asymmetric location and elongation of the interphase nucleus (Minc et al., 2011) and was thus well aligned with the domain, thereby driving cytokinesis that cleaved the cell in a marked asymmetric manner (Fig. 1, A and B; and Video 2). Asymmetric cleavages were never observed in un-injected eggs, in injected eggs in which the mag-netic probe was removed after fertilization allowing the cap to move toward the center, or in eggs in which the cap was formed with another type of magnetic beads devoid of minus end activity (Fig. 1, C–G; and Videos 3 and 4).
Interestingly, the size of the cap appeared to control divided blastomere size asymmetry in a nonlinear manner. As measured by the angle formed by the edges of the cap and the cell center, a narrow cap (below ∼10°) had little effect on the nucleus and subsequent division position, whereas a wider cap (above ∼15°) tended to move nuclei to a point at which they were in near con-tact with the cortex, generating a strong asymmetric division (Fig. 1 H). We also noted that a small, ineffective cap at the one-cell stage could offset the nucleus and consequent division plane in subsequent smaller blastomeres, suggesting that the size of the cap relative to that of the cell could be a critical factor in con-trolling the asymmetry of division (Fig. S1 E).
MT visualization with immunostaining revealed that asters were organized around decentering nuclei as in normal cells (Minc et al., 2011), filling the whole cytoplasm and contacting cortical caps (Fig. S1, F and H). Closer inspection of MT organi-zation suggested that MTs did not fully penetrate magnetic caps, but rather interacted with the beads in a lateral configuration (Fig. S1, I–K). Importantly, we did not note any specific change in local MT arrangement and density at the cap, which suggested that those caps may not primarily influence MT forces by mod-ulating MT stability or dynamics (Fig. S1, F and G; Laan et al.,
2012). Finally, asymmetric nuclear displacement toward the cap strictly required both MTs and dynein activity (Fig. S1, L and M; and Video 5). Thus, it was possible to relocate a fraction of endog-enous dynein activity into tunable cortical domains that pull on astral MTs to control the asymmetry of cell division.
Cortical pulling drives aster decentration only after asters have reached close to the cell center
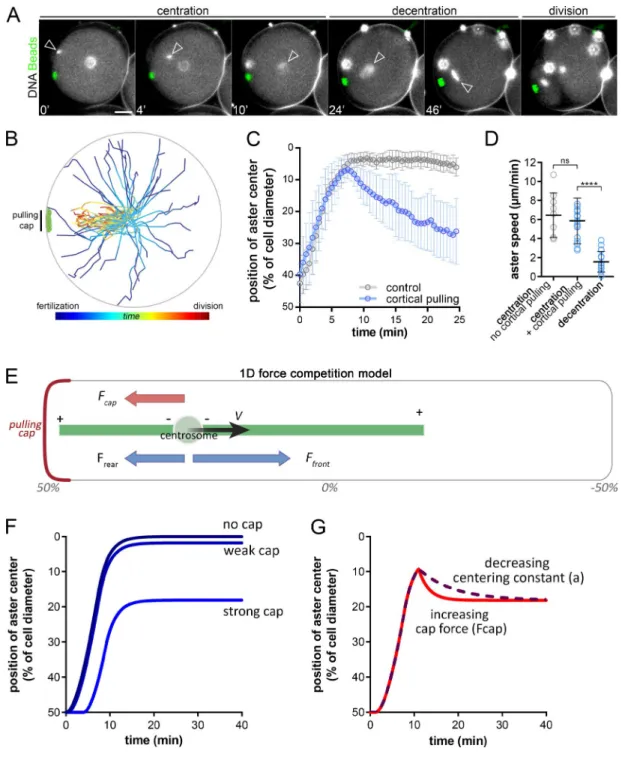
We next addressed how cortical caps affect aster positioning dynamics by tracking centering and decentering nuclei marked with Hoechst. When fertilization occurred opposite the cap, the male pronucleus moved to the cell center, where it fused with the female, and the zygote nucleus then decentered along a tra-jectory reoriented toward the cap (Fig. S2 A and Video 6, i and ii). This behavior was not unexpected, because MTs nucleated from the male pro-nucleus may not reach the opposite cortex before the end of centration (Tanimoto et al., 2016). Accordingly, in such situations, released caps only started to detach from the cortex when the aster had reached close to the cell center (Fig. S2 E and Video 7).
Strikingly, however, when the sperm entered the side contain-ing the cap, asters still migrated toward the cell center, ignor-ing the cap, and then stepped back to decenter toward the cap (Fig. 2 A; Fig. S2, B and C; and Video 6, iii and iv). This switch in aster directionality was observed in 100% of cases (n = 11 events), independent of the distance between the cap and the site of sperm entry (Fig. 2, A and B; and Video 6). In such eggs, immunostaining confirmed a clear interaction between centering asters and mag-netic domains. In addition, cap release assays yielded a near-im-mediate centripetal motion of cortical magnetic beads (Fig. S2, D and F; and Video 7). This demonstrates that asters that begin cen-tration close to caps can efficiently pull on them as early as few minutes after fertilization. Finally, aster centration speed in the presence of a domain was only slightly lower than controls, but was typically 3.5 times higher than decentration speeds (Fig. 2, C and D). Together, these results indicate that a change in the imbalance between centering and decentering forces may take place when asters are close to the cell center.
Requirement for an evolution of centering or decentering forces in asymmetric divisions
To understand the key elements driving consecutive centration and decentration phases, we developed a minimal 1D model (Fig. 2 E and Materials and methods). The aster was represented as a frontal MT of length Lf, and a rear MT of length Lr. Center-ing MT forces were scaled to the segment length through a con-stant a, and MT lengths were assumed to be limited by the cortex (Kimura and Onami, 2005; Tanimoto et al., 2016). The position x of the aster center evolved with time following an overdamped force balance equation, with γ the effective drag of the aster: γ x ˙ = a ( L f – L r ) − F cap in which Fcap is the decentration force ex-erted by the cortical cap (Fig. 2 E). In the absence of a cap (Fcap = 0), the aster centered at a speed bounded by MT polymeriza-tion rate and stopped at the cell center (x = 0), with no decenter-ing motion. When Fcap > 0, asters moved toward the center, but stopped before reaching the center at a final position given by x = Fcap/2a and did not exhibit any decentering movement (Fig. 2 F).
Figure 1. Magnetic cortical pulling domains drive marked asymmetric divisions. (A) Magnetic beads injection, cap formation, and induced asymmetric division. (B–E) Time-lapse images of the cleavage of sea urchin zygotes. (B) The cap is formed with beads with strong MT minus end activity and maintained; (C) a noninjected control embryo; (D) the pulling cap is not maintained; and (E) a control using a cap formed with beads that do not interact with MTs. Yellow stars: female/zygote nucleus; red stars: blastomere nuclei after division. (F) Divided blastomere area ratio in conditions B to E (n = 10, n = 8, n = 11, and n = 10 cells). (G) Quantification of the angle (Δα) between the division axis and the axis from the cell center to the cap (n = 12, n = 17, and n = 10 cells). (H) Blastomere area ratio plotted as a function of the angle (β) formed by the edges of the pulling cap and the cell center. The dashed line is a visual guide. Results were com-pared by using a two-tailed Mann–Whitney test. ns, P > 0.05; ****, P < 0.0001. Error bars are SD. Bars, 20 µm.
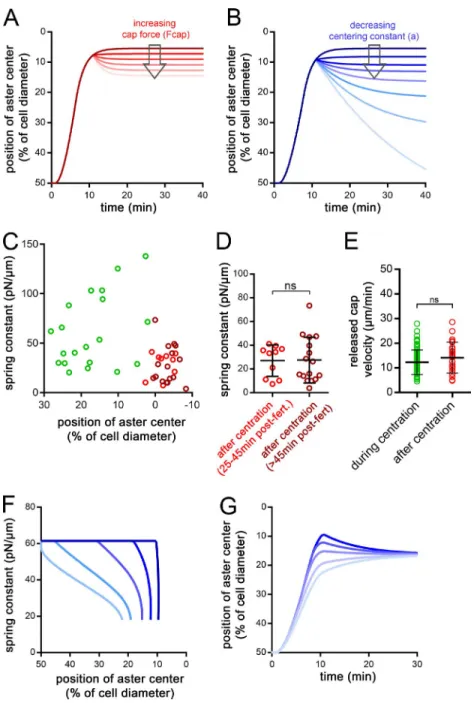
Allowing the drag γ to change over time affected the kinetics of centering, but not the final position, and did not account for the net change in aster directionality. Therefore, to account for the observed successive centering and decentering phases, we al-lowed forces to vary over time. Accordingly, increasing Fcap, or decreasing the centering constant a after the aster had reached
the cell center could account for both the successive centering and decentering phases and the reduction in aster speed during decentration (Fig. 2 G and Fig. S3, A and B). This simple analysis suggests that, during asymmetric divisions, cortical pulling forces may increase in strength over time, or alternatively, that the centering forces become weaker.
Figure 2. Consecutive aster centration and decentration. (A) Time-lapse of the consecutive centering motion of the male nucleus followed by a decen-tration of the zygote nucleus toward the cap. Arrowheads: nuclei at the aster center; red stars: blastomere nuclei. Contrast is adjusted to compensate for an increase in DNA labeling (Hoechst), and bright blobs correspond to excess sperm on the fertilization envelope. (B) Aster trajectories from fertilization to metaphase onset, aligned with the pulling cap (n = 32 cells). (C) Aster position with and without cortical caps (n = 18 and n = 9, respectively). (D) Aster velocity during centration and decentration (n = 18, n = 17, and n = 17 cells). (E) 1D force competition model with a pulling cap force (in red) and length-dependent pulling forces (in blue). (F) Simulated aster position under no, weak, or strong cortical forces. (G) Simulated aster position, with a decreasing centering constant, a (purple) or an increasing cap force, Fcap, after centration (red). Results were compared by using a two-tailed Mann–Whitney test. ns, P > 0.05; ****, P < 0.0001. Error bars are SD. Bars, 20 µm.
Cortical pulling forces remain constant during and after centration
To address putative time-dependent variations of cortical forces, we set out to directly compute the net decentering force exerted by the domain during and after aster centration. For this, we progressively moved back the magnetic probe away from the egg surface (Fig. 3 A). When the endogenous force from MTs on the cap became larger than the decreasing magnetic force, the cap detached from the cortex and moved to the cell center (Fig. 3, B and C; and Video 8).
The distance between the magnetic probe and bead domain was converted into a force and served to extract a “take-off” force, corresponding to the moment when the pulling force on the domain overcomes the magnetic force (see Materials and methods). To compute asymmetric forces on the domain during centration, we used a set of caps located close to the site of sperm entry (Fig. S2 F). This analysis revealed similar mean “take-off” profiles during and after centration, with mean cor-tical forces of 293.9 and 287.4 pN, respectively (Fig. 3 D). Fi-nally, in agreement with the influence of cap size on division asymmetry, larger caps appeared to exert more pulling forces (Fig. 1 H and Fig. 3 E). These results suggest that magnetic do-mains pull with near constant force and that changes in aster directionality and speed cannot be readily accounted for by a significant evolution of cortical forces.
Centering cytoplasmic pulling forces become weaker after centration
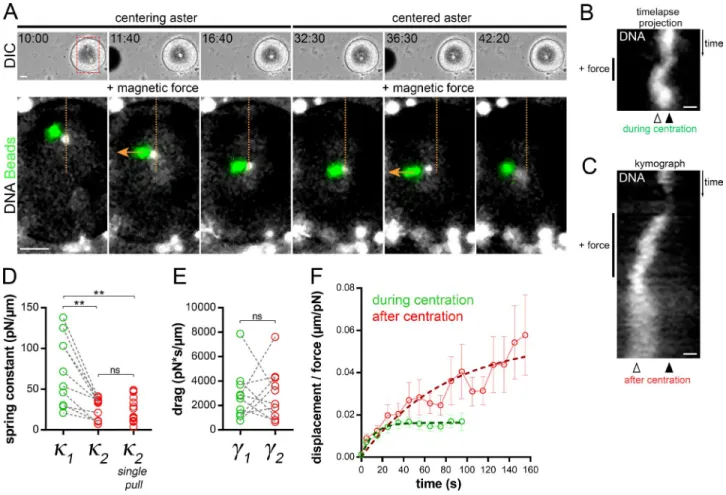
A second, less intuitive prediction of our 1D model is that a re-duction in MT centering forces per unit length may account for changes in both aster directionality and aster speed. To test this possibility, we directly measured the time evolution of aster centering forces in vivo. We injected magnetic beads and let them aggregate to the aster center, and applied calibrated forces (Tanimoto et al., 2018). Aster responses at different time points were compared within the same cell and under the same mag-netic force by applying consecutive pulls orthogonal to the cen-tering path. During centration, this caused the aster to deviate from its centering path toward the magnet probe and to recoil back to its normal centered path upon force cessation. After cen-tration, force exertion displaced asters and attached nuclei away from the center, which also recoiled back upon force cessation (Garzon-Coral et al., 2016; Tanimoto et al., 2018; Fig. 4, A and B; and Video 9).
Strikingly, the amplitude of the deviation away from the cell center was much larger after the aster had reached the center as compared to during centration, indicating that centered asters are easier to decenter (Fig. 4, A and C; and Video 9). To quantify those effects, we fitted the displacement time curves by using a viscoelastic Kelvin-Voigt model, in which an elastic spring and a dashpot act in parallel. We computed the aster centering spring Figure 3. Cortical pulling forces remain con-stant during and after aster centration. (A) The method used to measure cortical pulling forces. (B) Time-lapse of aster centration, and concomi-tant reduction of the magnetic force holding the cap. Top: Low-magnification view of the embryo moving away from the probe (left). Bottom: Details of cap detachment dynamics. Yellow stars: the aster center; arrowheads: the cap. (C) Typical example of the evolution of the dis-tance between the cell cortex and the cap (gray), and of the magnetic force (red), as a function of the distance between the egg and magnet. Arrow-head: the cap “take-off.” (D) Average distance between cap and cortex plotted as a function of the magnetic force, during centration (in green; n = 16) and after centration (in red; n = 18). Dashed lines are SD. Take-off forces (arrows) correspond to cortical forces exerted by domains onto asters and were determined using the fits (continuous lines; see Materials and methods). (E) Cortical forces plotted as a function of cap volumes. Red dashed line: linear regression. Pearson r and P value are displayed on the graph. Bars, 20 µm.
constant (κ, also called centering stiffness), which reflects the strength of length-dependent MT forces, and the aster drag (γ; Garzon-Coral et al., 2016; Tanimoto et al., 2018). Individual fit-ting of paired experimental curves performed in the same egg and under the same force showed that aster centering stiffness was systematically lower after centration, with a mean ratio be-fore/after centration of ∼2.9 (Fig. 4 D). At the population level, the mean spring constant during centration was κ1 = 61.48 pN/ µm and κ2 = 18.10 pN/µm after centration (Fig. 4 F). Individual force measurements after centration yielded similar spring con-stant values, ruling out potential caveats of altering aster integ-rity after force application (Fig. 4 D). This lower value, reached early after centration, was also similar at later time points in interphase (Fig. S3, C and D). Interestingly, aster drags did not appear to be significantly modified, suggesting that the reduc-tion in aster speed after centrareduc-tion may primarily arise from an alteration in the force imbalance on the aster (Fig. 4 E). Together, these quantitative measurements strongly support that a signif-icant reduction in aster centering stiffness occurs as asters ap-proach the cell center.
A 3D force competition model for aster positioning
To provide a faithful representation of the geometry of the system, we then developed a 3D model, in which we could input the respective 3D positions of the cap and site of sperm entry, for a direct comparison with individual experiments (see Materials and methods). Importantly, parameters were implemented using measured values for γ, κ, and Fcap, and not adjusted further. The decrease in aster centering stiffness κ was represented by a linear decay over a 1-min period, at a fixed time after fertilization, but slower decays could also ac-count for experimental behavior (Fig. S3, F and G). The model was compared with individual experiments, and accounted for the complex 3D trajectories of asters and yielded similar values for centered and final decentered aster positions, as well as centration-versus-decentration speeds (Fig. 5, A–E; and Video 10). Therefore, a model based on the quantified reduction of centering stiffness accounts for the inversion of aster directionality and net changes in speed and strongly sup-ports a hitherto unappreciated mode of regulation of asym-metric division.
Figure 4. Aster centering stiffness decreases after centration. (A) Time-lapse of a centering aster subjected to two consecutive external magnetic forces. Top: Low-magnification views of the embryo and magnet tip. Bottom: Position of aster centers (nuclei) and beads aggregate. Orange line: the centration path (fertilization from the top); orange arrows: the direction of the magnetic forces. Bars, 20 µm. (B) Time-lapse projection of aster deviation from the centration path upon the first force application. (C) Kymograph of aster deviation from the cell center from the second force application. Black and white arrowheads: the initial centered position and the maximum deviation (plateau) during force application, respectively. Bars, 5 µm. (D) Quantification of paired aster centering spring constants (connected by gray dashed lines [n = 10]). The “single-pull” category corresponds to force measurement performed only once after aster cen-tration (n = 15). (E) Quantification of paired aster drags. (F) Average displacement/force plotted as a function of time. Error bars are SEM. Dashed lines: Voigt model fit (see Materials and methods). Results were compared using a two-tailed Mann–Whitney test. ns, P > 0.05; **, P < 0.01.
Conclusions
By developing a novel approach based on magnetic domains that can efficiently pull on MTs in a symmetrically dividing cell, we
recapitulated most generic features of asymmetric divisions, including a dose-dependent effect of domain size and strength on daughter size asymmetry and a centering phase followed by a Figure 5. Reduction in aster centering stiffness drives aster decentration and asymmetric division. (A) Time-lapse of a 3D simulation with constant pulling cap and aster centering stiffness reduction. The red hemisphere is the cap, MTs are in green and the aster trajectory in blue. (B) Examples of comparisons between simulated (top) and experimental (bottom) aster trajectories. (C) Aster position relative to the cell center in 3D simulations using positions of caps and sperm entry from experiments (in blue; n = 18). Blue dashed lines: SD. The red dashed line: the experimental curve (shown in Fig. 2 B). (D and E) Comparison of aster distances from the cell center and aster speeds in simulations (blue) and experiments (red). Error bars are SEM. (F) Schematized consecutive aster centration and decentration and model for asymmetric division driven by a reduction in aster MT centering stiffness under constant cortical forces.
decentering one. One key finding is that a reduction in aster cen-tering stiffness (forces/per unit MT length) provides the trigger for the prevalence of asymmetric forces from the domain needed for asymmetric division (Fig. 5 F). Although our experimental data do not allow us to clearly resolve the decay time of the cen-tering stiffness (Fig. S3, C and D), they suggest a relatively rapid decay over a traveling distance of ∼20–30% of the egg radius close to the cell center (Fig. S3, F and G).
An important question these findings pose is what molecular reorganization may drive a weakening in the cytoplasmic MT pulling system. One possibility is that dynein activity becomes globally reduced in the cytoplasm, through time-dependent exhaustion or cell cycle progression. This hypothesis does not readily agree with experimental findings, as bead aggregates moving to the aster center exhibit similar centripetal speeds during or after aster centration (Fig. S3 E). A second plausible hypothesis is that gradual changes in aster structure, through the promotion of MT branching and/or densification, for instance, alter cytoplasmic force transmission to the centrosome in a time- dependent manner (Dan and Inoué, 1987; Mitchison et al., 2012). Although we cannot firmly reject a contribution from this effect, we note that MT radial arrangements remain roughly similar during the few minutes corresponding to the decay in centering stiffness (Minc et al., 2011; Tanimoto et al., 2016). A last model, which we favor most, is that cargos and/or endomembranes pulled by dynein to support MT cytoplasmic pulling may accu-mulate at the aster center, which could cause a gradual depletion of available cytoplasmic anchors. Accordingly, structures such as the endoplasmic reticulum progressively concentrate around the sperm nucleus toward the end of aster centration, at timings that match our measured decay in centering stiffness (Terasaki and Jaffe, 1991; Reinsch and Gönczy, 1998; Audhya et al., 2007).
Finally, we foresee that our model, based on a global rather than local regulation, could serve as a major mechanism regulat-ing asymmetric centrosome positionregulat-ing and divisions in many cell types. In C. elegans zygotes, asters also exhibit a net change in directionality, essentially recapitulated in experiments pre-sented here in Fig. 2 A and Fig. S2 C (Kimura and Onami, 2007). Interestingly, time-resolved analyses of cortical forces in these cells suggest that they also act upon mitotic asters much be-fore the onset of decentration (Labbé et al., 2004). In other cell types, the modulation of centering forces could also emerge from time-dependent changes in MT pushing forces (Tran et al., 2001; Tolic-Nørrelykke et al., 2005; Garzon-Coral et al., 2016). Pushing, which promotes aster centering, could become less efficient as a result of aster size increase or changes in MT polymerization rate, all resulting from a global rather than local regulation at cortical domains (Letort et al., 2016; Howard and Garzon-Coral, 2017; Pitaval et al., 2017). Further quantitative mapping of the evolution of centering and decentering forces will be instrumen-tal for understanding asymmetric divisions.
Materials and methods
Sea urchin maintenance and gametes collection
Purple sea urchins (P. lividus) were obtained from the Roscoff Marine station (France) and kept at 16°C in an aquarium for
several weeks in artificial sea water (Reef Crystals; Instant Ocean). Gametes were collected by intracoelomic injection of 0.5 M KCl. Sperm was collected dry and kept at 4°C for 1 wk. Eggs were rinsed twice, kept at 16°C, and used on the day of collection. The jelly coat of unfertilized eggs was removed by passing them three times through an 80-µm Nitex mesh (Genesee Scientific) to facilitate egg adhesion on protamine-coated glass-bottom dishes (MatTek Corporation). Eggs were transferred on prota-mine-coated dishes for a maximum time of 15 min before injec-tion, and were injected and fertilized under the microscope. Magnetic particles preparation and injection
The spontaneous minus end–directed motion of specific super-paramagnetic particles (NanoLink; Solulink) was used to both create cortical pulling caps and to apply forces on MT aster cen-ters (Tanimoto et al., 2018). To prepare beads for injection, a solu-tion of 10 µl of undiluted beads funcsolu-tionalized with streptavidin was first washed in 100 µl washing solution (1 M NaCl with 1% Tween-20) and sonicated for 5 min. The beads were then rinsed in 100 µl PBS, incubated in 100 µl 2 µg/ml Atto488-biotin (Sigma- Aldrich), rinsed again in 100 µl PBS, and finally resuspended in 20 µl PBS and kept on ice until use. Fluorescent and magnetic MyQuVigen Beads (Nvigen) served as control nonpulling beads, and were prepared according to the same protocol except for the incubation with fluorophores.
Unfertilized eggs were placed on a protamine-coated glass- bottom dish. The bead solution was injected using a microinjec-tion system (FemtoJet 4; Eppendorf) and a micromanipulator (Injectman 4; Eppendorf). Injection pipettes were prepared from siliconized (Sigmacote; Sigma-Aldrich) borosilicate glass capillaries (1-mm diameter). Glass capillaries were pulled with a needle puller (P-1000; Sutter Instruments) and ground with a 30° angle on a diamond grinder (EG-40; Narishige) to obtain a 5–10-µm aperture. Injection pipettes were back-loaded with 2 µl bead solution before each experiment and were not reused. Magnetic tweezers
The magnetic probe was built from three rod-shaped, strong neo-dymium magnets (diameter, 4 mm; height, 10 mm; S-04-10-AN; Supermagnet) prolonged by a sharpened steel piece with a tip radius of ∼50 µm to create a magnetic gradient. The surface of the steel tip was electrocoated with gold to prevent oxidiza-tion. Magnetic probes were calibrated by tracking the velocity of single magnetic beads in a medium of known viscosity, as a function of the distance to the magnet, and by using the Stokes relationship to compute the net magnetic force. The same exper-iment performed on bead aggregates of various sizes at a given distance allowed us to establish force–size relationships. For this part, the drag of bead aggregates was assayed by measuring sedi-mentation speed in a medium of known viscosity, and found to be well represented by the drag of a spherical particle with a radius equal to the geometrical mean of the aggregate size (Tanimoto et al., 2018). The magnetic tweezers position was controlled with the injection micromanipulator (Injectman 4; Eppendorf). To assemble the pulling cortical cap, we injected the beads and aggregated them at the cell cortex ∼10–20 min before fertiliza-tion by posifertiliza-tioning the magnetic tip at 50–100 µm from the egg
and maintaining it during all the experiment. Step-like motion during time-lapse acquisition, used for measuring cortical forces, was achieved with a home-built Micro-Manager (Open Imaging) script piloting the microscope stage (MS-4400; ASI) to move the sample relative to the fixed magnetic tweezers, with step sizes of 5 µm spaced by 30-s intervals.
Microscopy and image analysis
Injections, magnetic tweezer manipulations, and time-lapse acquisitions were performed on a wide-field fluorescence mi-croscope (TI-Eclipse; Nikon) equipped with a complementary metal oxide–semiconductor camera (Orca-flash4.0LT; Hama-matsu). Samples were filmed with a 20× dry objective (NA, 0.75; Apo; Nikon) and a 1.5× magnifier (final pixel size, 0.217 µm). The microscope was operated with Micro-Manager (Open Im-aging). Live imaging was carried out in artificial sea water at a stabilized room temperature (18–20°C). Immunostained sam-ples were imaged with a confocal microscope (LSM780; Zeiss) with a 63× water immersion objective (NA, 1.4; C-Apo; Zeiss). Images were processed with Fiji (ImageJ; National Institutes of Health) and assembled in Photoshop (Adobe). Noise was reduced by using a median filter (1-pixel width) for the DNA (Hoechst) channel. Aster and bead trajectory tracking was performed with a custom code written in MatLab (MathWorks). Centration and decentration speed measurements were computed from a lin-ear fit on 70% of the centration trajectory centered around the midpoint of the centration trajectory and during the 5 min after centration, respectively, by using a representative subset of 18 individual trajectories. The centration position was defined as the position with the shortest distance to the center. The decen-tration position was obtained by fitting a decreasing exponen-tial to the trajectory after centration. To represent the effect of magnetic forces on the position of aster centers during and after centration (Fig. 4, B and C), we used a simple time-lapse projec-tion that highlights the deviaprojec-tion from the centering path during centration (Fig. 4 B) and a kymograph to visualize the deviation of an already centered aster along the pulling axis (Fig. 4 C). Drug treatments
Drugs were prepared as 100× stock aliquots in DMSO. Nocodazole (Sigma-Aldrich) was used at a final concentration of 20 µM. Cil-iobrevin D (EMD Millipore) was used at a final concentration of 50 µM. Drugs were rapidly added (within less than a minute) when aster centration was completed and maintained until the end of the experiment.
Immunostaining
Immunostaining was performed by using procedures similar to those described previously (Foe and von Dassow, 2008; Minc et al., 2011). Embryos were fixed in the same glass-bottom dish, after filming centration or decentration, for 70 min in 100 mM Hepes, pH 6.9, 50 mM EGTA, 10 mM MgSO4, 2% formaldehyde, 0.2% glutaraldehyde, 0.2% Triton X-100, and 800 mM glucose. To limit autofluorescence, samples were rinsed in PBS and placed in 0.1% NaBH4 in PBS made fresh 30 min before use. Samples were then rinsed in PBS and PBT (PBS 0.1% Triton X-100) and incu-bated for 24 to 48 h in mouse anti-tubulin (DM1A; Sigma-Aldrich)
primary antibody at 1:5,000 in PBT. After three washes of 1 h in PBT, samples were incubated for 12 h in goat anti-mouse second-ary antibody coupled with Dylight 550 (Thermo Fisher Scientific) at 1:1,000 in PBT. Samples were then washed three times for 1 h in PBT, transferred in 50% glycerol PBS, and finally transferred into mounting medium (90% glycerol and 0.5% N-propyl gallate PBS). Cortical force measurement
To compute the cortical force exerted by the cap, we fitted the binned distance–force curves (Fig. 3 D) with a simple model, as-suming that the cap takes off at a critical force (when the magnet is far enough) and then moves at constant speed toward the cen-ter. A more complete model including a small decreasing force from the magnet after takeoff could not be reliably fitted to the data because of experimental noise. This model yields a simple relationship between the distance of the aggregate to the cortex, xc, and the magnetic force, Fmag:
x c = x 0 + β ( _1 √_ F mag −
1 _ √_ F cap ) .
We fitted the binned force–distance curves (Fig. 3 D) to this model by minimizing the absolute orthogonal error on (xc, Fmag) as a function of β and Fcap, using MatLab’s fminsearch function. This analysis yielded a force of Fcap = 293.9 pN during centration and of Fcap = 287.4 pN after centration. Fitting individual force–dis-tance curves by minimizing the absolute orthogonal error led to comparable mean values, and allowed us to estimate an SD (248.76 ± 206 pN and 291.27 ± 152 pN during and after centration, respectively). Statistical analysis on those two sets of data yielded a t test P-value of 0.1435, suggesting they are not significantly different from each other.
Computing aster drag and spring constant
To compute aster drags and centering spring constants from indi-vidual experiments (Fig. 4, D and E), we fitted each displacement curve by using a Kelvin–Voigt model, in custom-made MAT LAB scripts, as previously described (Garzon-Coral et al., 2016),
x
_
F = _1κ [ 1 − exp (_ − tκγ ) ] ,
where κ is the aster centering stiffness (or centering spring con-stant) and γ the drag coefficient. In experiments, the duration of force application was adjusted to allow the aster to reach the plateau when magnetic forces equilibrate MT centering forces (Garzon-Coral et al., 2016; Tanimoto et al., 2018). Mean values re-ported in the text correspond to fits of binned data (Fig. 4 F). We note that this method allowed us to reliably compare drag values before and after centration, but most likely correspond to a lower bound of the actual values of the drag (Garzon-Coral et al., 2016; Tanimoto et al., 2018).
Theoretical models 1D model
In the 1D model, the aster was represented by one frontal MT segment (directed toward the center) of length Lf, and one rear MT segment (directed toward the nearest cortex) of length Lr (Fig. 2 E; Tanimoto et al., 2016). In sea urchin zygotes, as in
other embryos, centering forces have been found to be predom-inantly associated with MT length-dependent pulling, mediated by dynein pulling in bulk cytoplasm (Hamaguchi and Hiramoto, 1986; Kimura and Onami, 2005; Wühr et al., 2010; Tanimoto et al., 2016). MT pulling forces were thus scaled to segment lengths through a constant a, yielding a net centering force:
F c = a ( L f – L r ) . (1) Position x of the aster was set close to the center initially and evolved with time after an overdamped force balance equation, with γ the effective drag of the aster,
γ x ˙ = F c − F cap , (2)
in which Fcap is the decentration force applied by the cortical do-main on the aster (Fig. 2 E). Finally, the lengths of the front and rear segments increase with time as a consequence of MT polym-erization, at a rate vp, so that
L ˙ r = L ˙ f = v p . (3) A key assumption of this model and similar previous ones is that MT length is limited by the cortex (Kimura and Onami, 2005; Minc et al., 2011; Tanimoto et al., 2016), which implies that −R < x − Lr and R > x + Lf, with R the radius of the cell. Eqs. 1, 2, and 3 were in-tegrated by using a custom MatLab script. In this 1D model, the pa-rameter a can be converted into a centering spring constant κ, with κ = 2a. The default parameter values for this model were κ1 = 61.48 pN/µm (our measurement), Fcap = 293.9 pN (our measurement), and γ = 140 pN min/µm, as computed in Tanimoto et al. (2018), and vp = 8.25 µm/min (fitted and adjusted, and consistent with measurement from Tanimoto et al., 2016). In Fig. 2 F, we changed the value of Fcap = 0 pN, 100 pN, and 1,000 pN. In Fig. 2 G, we started the simulation with Fcap = 293.9 pN and κ1 = 61.48 pN/µm, and we then either decreased κ to κ2 = 18.01 pN/µm or increased Fcap to 1,003.27 pN at t = 11 min, by using a linear decay/increase over a 1-min period. In Fig. S3 B, we varied the final value of κ after cen-tration from 5 to 60 pN/µm. In Fig. S3 A, we varied the final value of Fcap from 300 to 800 pN using similar decay/increase times.
3D model
For the 3D model, the aster was represented with a constant an-gular distribution of MTs, ρ(θ,φ) = N/4π (with N the number of MTs), of length L(θ,φ) (Minc et al., 2011; Tanimoto et al., 2016). The net centration force on the aster thus reads:
F c = ρ ∫ 0 2π ∫ 0 π a u(θ, ϕ ) L(θ, ϕ ) sin(ϕ ) dθdϕ, (4) in which u(θ,φ) is the unit vector oriented with angles θ and φ and a is the pulling force per unit length of an MT computed from the values of κ measured in experiments (see below). The dy-namic equations for MT lengths and aster position r are similar to those in the 1D model,
γ r ˙ = F c + F cap (5)
L ˙ ( θ, ϕ ) = v p , (6) with MT length limitation by the cortex implying R >
|
| r + u(θ, ϕ ) L(θ, ϕ )
|
|
.Eqs. 4, 5, and 6 were integrated by using a Euler scheme, imple-mented through a MatLab script. For this process, we discretized
L(θ, ϕ) using a uniform range of θ and φ, spherical coordinates
with the aster center as the origin, and verified that this distri-bution was homogeneous and did not induce a systematic bias. The integral in Eq. 4 was accordingly replaced by a discrete sum of the n = 28,654 discrete elements,
F c = k ∑ i=1 N
L i u i
in which L i and u i are the length and orientation of MTs for the orientation i. The force per MT unit length a was computed from the experimental measurement of the aster centering spring constant κ. A Taylor expansion of Eq. 4 around x = 0 leads to
a = _3
N κ,
in which κ is the centering spring constant measured experimentally.
Once a MT contacted the cap, the full pulling force from the cap was added to that force balance and assumed to be F cap =
F cap u d , in which u d is the unit vector directed from the aster cen-ter to the cap position. As a consequence, although the cap had a fixed size, this size had little influence on the model predic-tion. To incorporate the decrease of κ after centration, we used a linear decrease between two time points t1 and t2 from a spring constant value κ1 to a value κ2. Positions and speeds extracted from model results were computed in the same manner as for the experiments. The parameter values used were the same as in the 1D model, with additional parameters κ2 = 18.01 pN/µm (measurement), cap size = 5 µm (close to measurement values), t1 = 10 min, and t2 = 11 min (best-fitting values; see influence in Fig. S3, F and G).
Online supplemental material
Fig. S1 includes the characterization of bead aggregates motion; an example of cap formation and relocation; an example of the long-term effect of a small pulling cap during embryonic cleav-ages; details of the MT network under cortical pulling; and control experiments demonstrating the requirement of MTs and dynein for cortical pulling. Fig. S2 shows other examples of aster centra-tion/decentration trajectories; the details of MT networks during centration under cortical pulling; and a characterization of the re-lationship between aster size and cortical pulling. Fig. S3 includes the effect of increasing cap force and decreasing centering con-stant on aster position in the 1D model; the evolution of measured spring constants and released cap velocities before and after cen-tration; and the simulated aster positions from different profiles of centering force reduction. Video 1 is an example of cortical cap assembly and relocation. Video 2 shows an asymmetric division induced by an artificial cortical pulling domain (Fig. 1 B). Video 3 is a control embryo with a “nonmaintained” cap (Fig. 1 D). Video 4 is a control embryo containing a “nonpulling” cap (Fig. 1 E). Video 5 shows decentration failures upon dynein inhibition and MT de-polymerization (Fig. S1 L). Video 6 shows aster centration and decentration under cortical pulling (Fig. 2 A and Fig. S2, A–C). Video 7 shows examples of “free-cap” motions when fertilization
occurs close to or far from the cap. Video 8 is a magnetic force re-duction experiment during aster centration under cortical pulling (Fig. 3 B). Video 9 is an aster pulling experiment during and after centration (Fig. 4 A). Video 10 shows a 3D simulation of aster cen-tration and decencen-tration under cortical pulling (Fig. 5 A).
Acknowledgments
We thank K. Barett, B. Blanchard, H. Tanimoto, and other mem-bers of the Minc laboratory for help.
J. Xie is funded by a fellowship from the Chinese Scholarship Council (201708070046) and is part of the Frontière du Vivant PhD Program. S. Dmitrieff is supported by a Momentum grant from the Centre National de la Recherche Scientifique. We ac-knowledge the ImagoSeine core facility of the Institut Jacques Monod, member of Infrastructure en Biologie Santé et Agron-omie and France-BioImaging (ANR-10-INBS-04) infrastruc-tures. This research was funded by the Centre National de la Recherche Scientifique and the European Research Council (CoG Forcaster no. 647073).
The authors declare no competing financial interests. Author contributions: J. Sallé and J. Xie performed the ex-periments. D. Ershov developed the image analysis scripts. M. Lacassin and S. Dmitrieff designed and performed the models. J. Sallé, S. Dmitrieff, and N. Minc designed the research and wrote the manuscript.
Submitted: 13 July 2018 Revised: 30 October 2018 Accepted: 30 November 2018
References
Adams, R.J., and D. Bray. 1983. Rapid transport of foreign particles microin-jected into crab axons. Nature. 303:718–720. https:// doi .org/ 10 .1038/ 303718a0
Audhya, A., A. Desai, and K. Oegema. 2007. A role for Rab5 in structuring the endoplasmic reticulum. J. Cell Biol. 178:43–56. https:// doi .org/ 10 .1083/ jcb .200701139
Colombo, K., S.W. Grill, R.J. Kimple, F.S. Willard, D.P. Siderovski, and P. Gönczy. 2003. Translation of polarity cues into asymmetric spindle positioning in Caenorhabditis elegans embryos. Science. 300:1957–1961. https:// doi .org/ 10 .1126/ science .1084146
Dan, K. 1979. Studies on unequal cleavage in sea urchins I. Migration of the nuclei to the vegetal pole. Dev. Growth Differ. 21:527–535. https:// doi .org/ 10 .1111/ j .1440 -169X .1979 .00527 .x
Dan, K., and S. Inoué. 1987. Studies of unequal cleavage in molluscs II. Asym-metric nature of the two asters. International Journal of Invertebrate
Reproduction and Development. 11:335–353. https:// doi .org/ 10 .1080/ 01688170 .1987 .10510292
De Simone, A., A. Spahr, C. Busso, and P. Gönczy. 2018. Uncovering the balance of forces driving microtubule aster migration in C. elegans zygotes. Nat.
Commun. 9:938. https:// doi .org/ 10 .1038/ s41467 -018 -03118 -x
Foe, V.E., and G. von Dassow. 2008. Stable and dynamic microtubules coordi-nately shape the myosin activation zone during cytokinetic furrow for-mation. J. Cell Biol. 183:457–470. https:// doi .org/ 10 .1083/ jcb .200807128 Garzon-Coral, C., H.A. Fantana, and J. Howard. 2016. A force-generating ma-chinery maintains the spindle at the cell center during mitosis. Science. 352:1124–1127. https:// doi .org/ 10 .1126/ science .aad9745
Gönczy, P. 2008. Mechanisms of asymmetric cell division: flies and worms pave the way. Nat. Rev. Mol. Cell Biol. 9:355–366. https:// doi .org/ 10 .1038/ nrm2388
Grill, S.W., P. Gönczy, E.H. Stelzer, and A.A. Hyman. 2001. Polarity controls forces governing asymmetric spindle positioning in the
Caenorhab-ditis elegans embryo. Nature. 409:630–633. https:// doi .org/ 10 .1038/ 35054572
Hamaguchi, M.S., and Y. Hiramoto. 1986. Analysis of the role of astral rays in pronuclear migration in sand dollar eggs by the colcemid-UV method.
Dev. Growth Differ. 28:143–156. https:// doi .org/ 10 .1111/ j .1440 -169X .1986 .00143 .x
Hamaguchi, M.S., Y. Hamaguchi, and Y. Hiramoto. 1986. Microinjected poly-styrene beads move along astral rays in sand dollar eggs. Dev. Growth
Differ. 28:461–470. https:// doi .org/ 10 .1111/ j .1440 -169X .1986 .00461 .x Haupt, A., and N. Minc. 2018. How cells sense their own shape: Mechanisms
to probe cell geometry and their implications in cellular organization and function. J. Cell Sci. 131:jcs214015. https:// doi .org/ 10 .1242/ jcs .214015 Howard, J., and C. Garzon-Coral. 2017. Physical limits on the precision of mi-totic spindle positioning by microtubule pushing forces: Mechanics of mitotic spindle positioning. BioEssays. 39. https:// doi .org/ 10 .1002/ bies .201700122
Kaltschmidt, J.A., and A.H. Brand. 2002. Asymmetric cell division: microtu-bule dynamics and spindle asymmetry. J. Cell Sci. 115:2257–2264. Kaltschmidt, J.A., C.M. Davidson, N.H. Brown, and A.H. Brand. 2000. Rotation
and asymmetry of the mitotic spindle direct asymmetric cell division in the developing central nervous system. Nat. Cell Biol. 2:7–12. https:// doi .org/ 10 .1038/ 71323
Kimura, A., and S. Onami. 2005. Computer simulations and image processing reveal length-dependent pulling force as the primary mechanism for C. elegans male pronuclear migration. Dev. Cell. 8:765–775. https:// doi .org/ 10 .1016/ j .devcel .2005 .03 .007
Kimura, A., and S. Onami. 2007. Local cortical pulling-force repression switches centrosomal centration and posterior displacement in C. ele-gans. J. Cell Biol. 179:1347–1354. https:// doi .org/ 10 .1083/ jcb .200706005 Kimura, K., and A. Kimura. 2011. Intracellular organelles mediate cytoplasmic
pulling force for centrosome centration in the Caenorhabditis elegans early embryo. Proc. Natl. Acad. Sci. USA. 108:137–142. https:// doi .org/ 10 .1073/ pnas .1013275108
Laan, L., N. Pavin, J. Husson, G. Romet-Lemonne, M. van Duijn, M.P. López, R.D. Vale, F. Jülicher, S.L. Reck-Peterson, and M. Dogterom. 2012. Cor-tical dynein controls microtubule dynamics to generate pulling forces that position microtubule asters. Cell. 148:502–514. https:// doi .org/ 10 .1016/ j .cell .2012 .01 .007
Labbé, J.C., E.K. McCarthy, and B. Goldstein. 2004. The forces that position a mitotic spindle asymmetrically are tethered until after the time of spindle assembly. J. Cell Biol. 167:245–256. https:// doi .org/ 10 .1083/ jcb .200406008
Letort, G., F. Nedelec, L. Blanchoin, and M. Théry. 2016. Centrosome centering and decentering by microtubule network rearrangement. Mol. Biol. Cell. 27:2833–2843. https:// doi .org/ 10 .1091/ mbc .e16 -06 -0395
Minc, N., and M. Piel. 2012. Predicting division plane position and orientation.
Trends Cell Biol. 22:193–200. https:// doi .org/ 10 .1016/ j .tcb .2012 .01 .003 Minc, N., D. Burgess, and F. Chang. 2011. Influence of cell geometry on
divi-sion-plane positioning. Cell. 144:414–426. https:// doi .org/ 10 .1016/ j .cell .2011 .01 .016
Mitchison, T., M. Wühr, P. Nguyen, K. Ishihara, A. Groen, and C.M. Field. 2012. Growth, interaction, and positioning of microtubule asters in extremely large vertebrate embryo cells. Cytoskeleton (Hoboken). 69:738–750. https:// doi .org/ 10 .1002/ cm .21050
Morin, X., and Y. Bellaïche. 2011. Mitotic spindle orientation in asymmetric and symmetric cell divisions during animal development. Dev. Cell. 21:102–119. https:// doi .org/ 10 .1016/ j .devcel .2011 .06 .012
Pierre, A., J. Sallé, M. Wühr, and N. Minc. 2016. Generic theoretical models to predict division patterns of cleaving embryos. Dev. Cell. 39:667–682. https:// doi .org/ 10 .1016/ j .devcel .2016 .11 .018
Pitaval, A., F. Senger, G. Letort, X. Gidrol, L. Guyon, J. Sillibourne, and M. Théry. 2017. Microtubule stabilization drives 3D centrosome migration to initiate primary ciliogenesis. J. Cell Biol. 216:3713–3728. https:// doi .org/ 10 .1083/ jcb .201610039
Reinsch, S., and P. Gönczy. 1998. Mechanisms of nuclear positioning. J. Cell
Sci. 111:2283–2295.
Tanimoto, H., A. Kimura, and N. Minc. 2016. Shape-motion relationships of centering microtubule asters. J. Cell Biol. 212:777–787. https:// doi .org/ 10 .1083/ jcb .201510064
Tanimoto, H., J. Sallé, L. Dodin, and N. Minc. 2018. Physical forces determining the persistency and centering precision of microtubule asters. Nat. Phys. 14:848–854. https:// doi .org/ 10 .1038/ s41567 -018 -0154 -4
Terasaki, M., and L.A. Jaffe. 1991. Organization of the sea urchin egg endo-plasmic reticulum and its reorganization at fertilization. J. Cell Biol. 114:929–940. https:// doi .org/ 10 .1083/ jcb .114 .5 .929
Théry, M., V. Racine, A. Pépin, M. Piel, Y. Chen, J.B. Sibarita, and M. Bornens. 2005. The extracellular matrix guides the orientation of the cell division axis. Nat. Cell Biol. 7:947–953. https:// doi .org/ 10 .1038/ ncb1307 Tolic-Nørrelykke, I.M., L. Sacconi, C. Stringari, I. Raabe, and F.S. Pavone.
2005. Nuclear and division-plane positioning revealed by optical mi-cromanipulation. Curr. Biol. 15:1212–1216. https:// doi .org/ 10 .1016/ j .cub .2005 .05 .052
Tran, P.T., L. Marsh, V. Doye, S. Inoué, and F. Chang. 2001. A mechanism for nuclear positioning in fission yeast based on microtubule pushing. J. Cell
Biol. 153:397–411. https:// doi .org/ 10 .1083/ jcb .153 .2 .397
Wühr, M., E.S. Tan, S.K. Parker, H.W. Detrich III, and T.J. Mitchison. 2010. A model for cleavage plane determination in early amphibian and fish embryos. Curr. Biol. 20:2040–2045. https:// doi .org/ 10 .1016/ j .cub .2010 .10 .024
Supplemental material
Figure S1. Cortical pulling from magnetic beads domains depends on MTs and dynein. Related to Fig. 1. (A) Time-lapse sequence showing the centrip-etal motion of a free aggregate during aster centration. Orange star: the aster center; arrowhead: the position of the aggregate. Bar, 20 µm. (B) Quantification of the distance between a free cap and aster center during centration. Three representative cases are displayed. (C) Quantification of free aggregate and fe-male pronucleus velocity during aster centration (n = 78 and n = 33, respectively). Error bars correspond to SDs. (D) Time-lapse sequence showing cortical cap assembly and relocation in an unfertilized egg. Top: Low-magnification view of the egg and the different magnetic probe positions. Bottom: Details of cap assembly and relocation around the same cell (arrowhead). (E) Time-lapse sequence of small cap maintained during subsequent embryonic divisions. Note how the cap can drive asymmetric division in the small four-cell blastomere but not in bigger one- and two-cell-stage blastomeres. 8 and 16 cell stages are schematized to illustrate the cap-induced asymmetric divisions (yellow blastomeres) that occur independently of endogenous micromere generation. (F) Time-lapse sequence of a decentering aster under cortical pulling. Yellow star: aster center/zygote nucleus. Right: Confocal image of the same embryo after in situ fixation. Red: DNA; cyan: MTs; green: beads. Bars, 20 µm. (G) Quantification of MT density during aster decentration in the region facing the pulling cap (orange dotted box in F) and in the region facing the cell cortex (white dotted box in F; n = 23). Error bars correspond to SD. (H) Confocal image of a decentered aster in late interphase. Colors as in F. Bars, 20 µm. (I–K) Details of the MTs network surrounding a maintained pulling cap (I and J) and a free cap moving toward the aster center (K). Note that I corresponds to a magnification of the region surrounding the cap in H. Colors as in F. Bar, 10 µm. (L and M) Inhibition of MT and dynein prevent aster decentration from the cortical domain. The chemical inhibitors were added after centration. Top: Control DMSO; middle: 50 µM Ciliobrevin D (CiliD); bottom: 20 µM Nocodazole (Noco). (M) Quantification of the impact of chemical inhibitors on aster decentration by the domain. Error bars correspond to SD. Final aster positions were compared by using a two-tailed Mann–Whitney test. P = 0.0095 for CiliD and 0.0286 for Nocodazole.
Figure S2. Aster centration and decentration under cortical pulling. (A–C) Time-lapse sequences showing successive aster centration and decentration under cortical pulling forces when fertilization occurs: at the opposite of the cap (A), ∼90° relative to the cap (B), and close to the cap (C). Arrowheads: the position of the nuclei at the center of asters; red stars: the blastomere nuclei after division. Contrast is adjusted to compensate for an increase in DNA labeling (Hoechst). (D) Time-lapse sequence of a centering under cortical pulling. Arrow: the site of sperm entry; yellow star: aster center/zygote nucleus. Right: Confocal image of the same embryo after in situ fixation. Red: DNA; cyan: MTs; green: beads. Bars, 20 µm. (E and F) Time-lapse sequences illustrating the link between aster growth and the start of aggregate centripetal motion during late (E) and early (F) centration. Orange arrowheads: sperm entry point; orange circle and star: the estimated aster size and aster center, respectively. Red arrows: the beginning of aggregate centripetal motion. Bars, 20 µm. (G) Correlation between aster radius and the shortest distance at which free aggregates are attracted toward aster center (white arrows in E and F).
Figure S3. Influence of aster centering stiffness dynamics on centration and decentration. (A and B) Aster position dynamic in the 1D model when the cap pulling force, Fcap, is increased in a dose-dependent manner after centration (A) or when aster centering force coefficient, a, is decreased in a dose-de-pendent manner after centration (B). (C) Measured spring constants during centration (in green) and after centration (in red) plotted as a function of aster position relative to the cell center. Negative values on the x axis correspond to a slight overshoot in the centered position. (D) Average spring constant values measured early after centration (25–45 min after fertilization [post-fert], light red; n = 10) and late after centration (>45 min post-fert, dark red, n = 16). The same datasets are also displayed in C. (E) Quantification of the velocity of a released bead cap during and after centration (n = 78 and n = 24, respectively). In D and E, error bars correspond to SD, and results were compared by using the two-tailed Mann–Whitney test. ns, P > 0.05. (F and G) Effect of aster cen-tering stiffness dynamics in 3D simulation. Different transition kinetics between centration and postcentration stiffness were tested (F) and their impact on aster trajectories assessed (G).
Video 1. Pulling cap assembly and relocation. Unfertilized egg after magnetic bead injection. Embryos were visualized using differential interference contrast; beads are in green. The magnetic probe is used to assemble and relocate a cortical pulling cap. Images were obtained by wide-field time-lapse microscopy. Frames were taken every 30 s for 17 min.
Video 2. Asymmetric division induced by artificial cortical pulling. A cortical pulling cap is maintained during the first cleav-age in embryos by using a magnetic probe. Embryos were visualized using differential interference contrast; the beads forming the pulling cap are in green. Images were obtained by wide-field time-lapse microscopy. Frames were taken every 10 s for 98 min.
Video 3. “Free cap” control embryo. First cleavage visualized in an embryo containing a free pulling cap (no magnet). Embryos were visualized using differential interference contrast; the beads are in green. Images were obtained by wide-field time-lapse microscopy. Frames were taken every 20 s for 63 min.
Video 4. “Non-pulling cap” control embryo. First cleavage visualized in an embryo containing a nonpulling cap maintained at the cortex. Embryos were visualized using differential interference contrast; the beads forming the cap are in green. Images were obtained by wide-field time-lapse microscopy. Frames were taken every 30 s for 62 min.
Video 5. Decentration after dynein motors inhibition or MT depolymerization. Nucleus decentration after drug addition (white square at the bottom left corner of each video). From top to bottom: DMSO; 50 µM Ciliobrevin D; 20 µM Nocodazole. Em-bryos were visualized using differential interference contrast; the beads forming the cap are in green. Images were obtained by wide-field time-lapse microscopy. Frames were taken every 30 s for 15 min.
Video 6. Aster centration and decentration under cortical pulling. Aster center was visualized using male pronucleus and zygote nucleus DNA (after pronuclei fusion) in white. Beads forming the pulling cap are in green. The four panels represent differ-ent angles between the pulling cap and the sperm differ-entry point: (i) ∼120°, (ii) ∼80°, (iii) ∼40°, and (iv) ∼5°. Images were obtained by wide-field time-lapse microscopy. Frames were taken every 30 s for up to 61 min.
Video 7. “Free cap” during centration. Centration was visualized using differential interference contrast, and beads forming the free pulling cap (no magnet) are in green. In the top video, fertilization occurs close to the cap, while in the bottom video, fertiliza-tion occurs on the opposite cortex. Images were obtained by wide-field time-lapse microscopy. Frames were taken every 30 s for 20 min.
Video 8. Magnetic force reduction during aster centration under cortical pulling. Centration was visualized using differen-tial interference contrast; beads forming the pulling cap are in green. Top: An embryo containing a pulling cap moving away from the magnetic probe. Bottom: A registered and magnified view of the same embryo. Images were obtained by wide-field time-lapse microscopy. Frames were taken every 30 s for 14 min.
Video 9. Aster pulling during and after centration. Two short magnetic pulls were applied, perpendicular to the centration axis (horizontal) during and after centration. The left panel (differential interference contrast) shows a low-magnification view of the embryo and magnet. The right panel shows the same embryo containing a beads aggregate bound to the aster center. DNA is in white, and beads are in green. Images were obtained by wide-field time-lapse microscopy. Frames were taken every 20 s for 44 min.
Video 10. 3D simulation of aster centration and decentration under cortical pulling. MTs are in green, aster trajectory is in blue, and the pulling cap is represented as a red hemisphere. Frames were taken every 20 s for 50 min.