Adhesive Joining of Curved Metal and Composite
Structures
by
Christopher Gouldstone
S. B., Aeronautics and Astronautics, Massachusetts Institute of Technology, Cambridge,
Massachusetts (2000)
Submitted to the Department of Aeronautics and Astronautics in partial fulfillment of the requirements for the degree of
MASTER OF SCIENCE IN AERONAUTICS AND ASTRONAUTICS
at the
MASSACHUSETTS INSTITUTE OF TECHNOLOGY
June 2002
@ Massachusetts Institute of Technology 2002. All rights reserved.
Author
Department of Aeronautics and Astronautics May 17, 2002 Certified by.
S. Mark Spearing Associate Professor of Aeronautics and Astronautics
/ heois Supervisor
Accepted by
MASSACHUSETTS INSTITUTE
OF TECHNOLOGY
AUG 1 3 2002
Wallace Vander Velde Professor of Aeronautics and Astronautics Chair, Committee on Graduate Students
Adhesive Joining of Curved Metal and Composite Structures
by
Christopher Gouldstone
Submitted to the Department of Aeronautics and Astronautics on May 17, 2002, in partial fulfillment of the
requirements for the degree of
Master of Science in Aeronautics and Astronautics
Abstract
Joining metallic and composite components by adhesive bonding offers comparable perfor-mance to metal-metal and composite-composite bonding, but presents unique challenges. Joint design and fabrication methods need to be evaluated to ensure reliable, high-strength bonding. This work evaluates such methods for producing adhesive joints between metal and composite components with curved bonding surfaces. The benefits of adherend surface preparation for such a configuration are quantified experimentally, while thermal effects and plasticity are studied using finite element modeling. Bond strength is shown to increase by
100% through improvements in surface preparation alone.
Composite test specimens were fabricated by joining, either adhesively or mechanically, aluminum discs with graphite-epoxy cylinders. The discs were bonded to the interior surface of the cylinders, or jointed using radially-inserted machine screws. Each specimen was loaded in a servohydraulic testing machine along its longitudinal axis, using a load spreader to apply upward pressure to the aluminum disc, to facilitate extraction of the disc from the cylinder. Specimen failure was seen to be a fracture-dominated process.
Finite element simulations were performed using axisymmetric models of the adhesively-bonded structure, employing thermal and mechanical loads and boundary conditions consis-tent with the manufacturing procedures and test configurations used. Thermal stresses were introduced by cooling the structure down from a stress-free adhesive cure temperature. The structure was subsequently loaded by a uniform edge displacement of the aluminum. Stress analysis was completed using ABAQUS software, with a refined mesh in and around the bonded region. FRANC2D software was used for fracture analysis of the bond, by initiating
an edge crack in the adhesive layer. Thesis Supervisor: S. Mark Spearing
Acknowledgments
This work concludes a healthy stint of six years at the institute, and many of my fondest memories are from my time spent with TELAC. For inviting me to join, and for so much more, I am truly grateful to Prof. Mark Spearing. Over five years he has been my teacher, advisor and my friend. I can safely say I have learnt more from him than from anyone else at MIT.
I am indebted to Will McFarland, Jr. for his guidance and encouragement throughout this work, and to Draper Labs for their financial support. I owe special thanks to Seth Kessler for sharing his vast experience in composite manufacture and testing, particularly while he was trying to graduate. This is not the first project that he has seen me through. His mentorship has aided me greatly and his determination spooks and inspires me.
I would like to extend my gratitude to John Kane, who helped me to ask the right questions, and to Don Weiner, who never tired of them. Thanks to Nick Abercrombie, for all his help during IAP, and to all of the extra pairs of hands who helped with manufacturing. For navigating myself and many others through the rocky shallows of institute requirements, I offer my most sincere appreciation to Marie Stuppard.
Thanks also to Jeremy Gregory, Kevin Thrner, Torrey Radcliffe, Dong Jin Shim and Linda Mendenhall from the TELAC office, and to Mark Kepets for always making my problems seem so small.
To Mama and Pops, thank you for providing for my education, and for bustin' heads all the times when education wasn't what I was getting. I owe fourteen tons of gratitude to my brother Roo, who is at once incredible, amazing, and uncanny - a true ABAQUS marvel. I admire my big brother Jim, who first brought the Gouldstones to Boston, where we've all had such good fortune, and equally my little brother Ian, who continues, fearlessly, to blaze new trails all his own.
Most everyone I know has had to endure, usually more than once, the twisted mockings I call my sense of humor. For this I should be thanking everyone over again. No one person, though, has done so with more forbearance than Pimpa Limthongkul (da Pimp, Pizzimp, Pimpa the Clown). Pimpressive, I think.
m
No acknowledgment I could draft could adequately express what I owe this last person, but if there's one thing she's used to, it's my inadequacy. Thank you, the Shen, for all the sweet things we have shared in four years, and to a lesser extent, the veggies.
Contents
Abstract 2 Acknowledgments 3 1 Introduction 12 1.1 Motivation. ... ... 12 1.2 Objectives ... ... 14 1.3 A pproach . . . . 15 1.4 ThesisO utline . . . . 16 2 Background 18 2.1 Adhesive Joining . . . . 18 2.2 Previous W ork . . . . 19 2.2.1 Curved Specimens . . . . 192.2.2 Surface Preparation and Bonding . . . . 19
2.2.3 Thermal Effects . . . . 22
3 Finite Element Modeling 24 3.1 Introduction . . . . 24
3.2 Failure Criteria . . . . 24
3.2.1 Maximum/Average Shear Stress . . . . 24
3.2.2 Von Mises Yield Criterion . . . . 25
3.2.3 Strain Invariant Failure Theory [1] . . . . 25
3.3 Stress Analysis . . . . 3.3.1 Platform . . . . 3.3.2 Geometry . . . . 3.3.3 Materials . . . . 3.3.4 Assembly . . . . 3.4 Boundary Conditions . . . . 3.4.1 Loads . . . . 3.4.2 Meshing . . . . 3.4.3 Analysis and Data extraction . 3.5 Fracture Analysis . . . . 4 Modeling Results 4.1 Elasticity . . . . 4.2 Strain-Displacement . . . . 4.2.1 Cooldown . . . . 4.2.2 Loadup . . . . 4.3 Failure Modes . . . . 4.3.1 Maximum/Average Shear Stress 4.3.2 Von Mises Yield Criterion . . . 4.3.3 Strain Invariant Failure Theory 4.3.4 Fracture . . . . 5 Experimental Procedure 5.1 Introduction . . . . 5.2 Specimen Manufacture . . . . 5.2.1 Composite Tubes . . . . 5.2.2 Aluminum Plugs . . . . 5.3 Specimen Preparation . . . . 5.3.1 Composite Tubes . . . . 5.3.2 Aluminum Plugs . . . . 26 26 26 28 30 30 31 31 32 32 34 34 35 35 37 39 39 41 42 45 48 48 48 48 51 52 52 52
5.4 Joining . . . . 5.4.1 Film Adhesive ...
5.4.2 Liquid Epoxy System . . . . 5.4.3 Mechanically Fastened . . . 5.5 Testing Apparatus . . . . 5.5.1 Load frame installation . . . 5.6 Testing Procedures . . . . 5.6.1 Calibration . . . . 5.6.2 Loading . . . . 5.6.3 Data Collection . . . . 5.7 Test Matrix . . . . 6 Experimental Results 6.1 Bond Strength . . . . 6.2 Failure . . . . 6.3 Observations of failed components . 6.3.1 Composite tubes . . . . 6.3.2 Aluminum plugs . . . . 6.4 Defects . . . . 6.4.1 Eccentricity . . . . 6.4.2 Pitting . . . . 6.4.3 Surface pores . . . . 6.5 Displacement . . . . 6.6 Alignment . . . . 7 Analysis and Discussion
7.1 Effect of surface preparation . . . . 7.2 Observed damage . . . . 7.3 Comparison with flat specimens 7.4 Empirical-numerical agreement 53 53 53 54 54 57 57 57 57 57 58 60 . . . . . 60 61 63 63 . . . . . 67 68 . . . . . 68 69 . . . . . 70 . . . . . 70 . . . . . 71 76 76 76 78 80
7.4.1 Y ield . . . . 81
7.4.2 Fracture . . . . 81
7.4.3 Deformation. . . . .. . . . . 82
7.4.4 Unquantified factors ... . . . .. . . . . 83
8 Conclusion 85 8.1 Recommended manufacturing procedures . . . . 85
8.2 Recommended testing procedures . . . . 87
8.3 Recommended modeling procedures . . . . 88
8.4 Applicability of coupon data . . . . 90
8.5 Future work . . . . 91
List of Figures
1-1 W.A.S.P. aircraft, courtesy of Draper Laboratories. Double lap shear specimen . . . . Double cantilever beam specimen . . . . Bond strength against specimen preparation [2] . . Stresses in Al-GrEp DLS specimens [3] . . . .
. . . . 20 . . . . 20 . . . . 21 . . . . 23 . . . . 27 . . . . 28 3-1 Specimen geometry, loads and boundary conditions
3-2 Finite element model of bonded specimen . . . . 4-1 4-2 4-3 4-4 4-5 4-6 4-7 4-8 4-9 4-10
Reference locations on bonded specimen . . . . . Load vs displacement curve for bonded specimen Stress Mohr's circle for bond in pure shear . . . . Stress Mohr's circle for bond in tension and shear Average shear stress in bond during cooldown . . Average shear stress in bond during loadup . . . . Plastic zone growth with applied load . . . . Plastic zone growth locally around point B . . . .
Bond plasticity percentage during loading . . . . Average first strain invariant during loading step .
. . . . 3 5 . . . . 3 6 . . . . 3 8 . . . . 3 8 . . . . 3 9 . . . . 4 0 . . . . 4 1 . . . . 4 2 . . . . 4 3 . . . . 4 4 4-11 Mode II stress intensity factor (KII) under thermomechanical loading
4-12 Mode II stress intensity factor (Krr) against applied displacement . . 5-1 Three tubes layed up on aluminum mandrel . . . .
46 47 49 2-1 2-2 2-3 2-4 15
5-2 Schematic of bagging material placement . . . . 5-3 Clamp for securing test specimen . . . . 6-1 Variation in specimen failure load with surface preparation . . 6-2 Interior tube surface with broken film adhesive remains . . . . 6-3 Interior tube surface showing splintering damage . . . . 6-4 Plug exterior surface showing adhered plies . . . . 6-5 Typical modes of failure of FRP bolted connections [4] . . . . 6-6 Tube with bolt shear out damage . . . . 6-7 Close-up of bolt shear out damage . . . . 6-8 Adhesive failure between film and sanded plug . . . . 6-9 Plug with half-thickness epoxy coating . . . . 6-10 Load-displacement curve for 80A rubber plies . . . . 6-11 Test configuration for determining rubber constitutive behavior
50 55 . . . . 62 . . . . 64 . . . . 65 . . . . 65 . . . . 66 . . . . 66 . . . . 67 . . . . 68 . . . . 69 . . . . 71 . . . . 72 6-12 Constitutive plot for rubber overlaid on load-displacement curve from tensile
test . . . .. ... .. . . .. . ... .. . . . ... . . . .. 6-13 Extracted plug at maximum rotation . . . . 7-1 Types of bond failure under shear loading. (a) As-cured specimen, (b) cohesive
bond failure, (c) adhesive bond failure, (d) adherend failure. . . . . 7-2 Interlaminar fracture scenario in composite tube, proceeding through (a)
un-cured, (b) cured at temperature, (c) mechanically loaded and (d) post fracture stages. ... ...
7-3 Nominal strength of bonded cylinders and DLS specimens . . . . 7-4 Mode II stress intensity factor K 1 against applied load . . . .
7-5 Interface crack introduced by film wrapping . . . . 8-1 Compatible coarse-fine mesh . . . .
73 75 77 78 80 82 83 89
List of Tables
3.1 Material data: Aluminum [5]. . . . . 29
3.2 Material data: Graphite-Epoxy [6] . . . . 29
3.3 Material data: Film Adhesive [7] . . . . 30
5.1 Test matrix . . . . 59
6.1 Failure load . . . . 61
6.2 Statistical information . . . . 61
Chapter 1
Introduction
1.1
Motivation
Adhesive joining is an attractive technique for composite structures. Bonded joints are par-ticularly desirable in weight-sensitive, high-reliability applications because they can reduce mass and lower part count.
Metal components are often joined together using mechanical fasteners, such as bolts or rivets. Using fasteners tends to introduce stress concentrations around holes cut for the bolts themselves. In addition, tightened bolts generate compressive loads. While these same effects occur if the components are made of metal or of carbon fibre-reinforced polymer (CFRP) materials, they can in many cases be more problematic with components made of the latter. Under the same loading, an orthotropic laminate containing holes may have amplified stress concentration factors over a isotropic metal structure with holes. The higher stress concentrations increase the likelihood of structural failure.
The ability of the structure to suppress fracture and fatigue can be limited by the cracks near the hole edge. These cracks can arise from damage caused by the machining procedure used to make the hole. The large number of terminated fibres at the hole edge can further weaken the structure.
Many industries are now realizing potential applications where composites would out-perform traditional metallic construction materials. While the aerospace industry has
ar-guably been the earliest adopter of composites for weight-saving, the automotive industry is just now beginning to integrate composite components into high-volume production vehicles, to reduce weight and thereby improve fuel economy.
These two industries are notable for their traditional devotion to building their primary structures from a single metallic building material. In aerospace, this has been specific grades of aluminum alloys. In passenger vehicle construction, steel has been used with few exceptions, although aluminum is becoming more popular for performance and luxury cars, and as an engine material.
As composite materials become cheaper and easier to manufacture in large volumes, their uses will continue to grow. However, they will first be integrated with existing metal structures, rather than replacing them altogether. Even today, there are many structural configurations which require joining of metal and composite components for exactly these reasons.
By using adhesives to join these dissimilar adherends, joint performance comparable to metal-to-metal or composite-to-composite bonds is achievable, but there are additional challenges when bonding materials with different properties.
The failure modes of adhesive bonds are several, and distinct from those of mechanically fastened joints. They include adhesive, cohesive and adherend failure. Adhesive failure happens when two different materials disconnect at the interface between them. Cohesive failure is categorized by fracture contained within the adhesive, leaving each bi-material interface intact while severing the connection between the adherends. Adherend failure is described as sufficient damage within one or more of the adherends to bring about overall joint rupture, while the adhesive and bi-material interfaces remain intact. Joint failure may
also occur by a combination of adhesive, cohesive and adherend damage.
Adhesive damage is the least desirable cause of failure. When cohesive or adherend failure occurs, it means one or more of the bond components has been loaded to failure, limiting bond strength. Adhesive failure does not occur due to failure of a constituent of the bond, but rather as the result of interfacial failure. Preventing adhesive failure requires careful preparation of adherend surfaces to maximize adhesion between them.
is locked in when materials with mismatched thermal properties are cooled back down after curing. The presence of these stresses can reduce the maximum applied stress the bond can withstand compared to a similar bond which is stress-free before applied loading.
The applications for bonding flat structural components represent only a small part of the potential for structural bonding, yet the majority of previous work in adhesive bonding of composites uses flat specimens. While these tests can be effective at characterizing bond per-formance to an extent, they do not address the obstacles that arise when joining structures with more generic geometries. To minimize aerodynamic drag, wetted aerospace structures are, almost without exception, inherently curved. Joining these to internal structural com-ponents often occurs at a curved interface, so understanding joining of curved structures is crucial.
When faced with such a variety of significant factors affecting bond performance, materi-als selection, joint configuration, design and manufacture, manufacturing methods must be evaluated to ensure joint integrity, strength and reliability.
1.2
Objectives
The primary objectives of this work are to evaluate the feasibility of creating high reliability bonds between curved components and the methods available for modeling their behavior. To determine the factors affecting reliable bonding, one goal is to quantify the effect of adherend surface preparation on performance of a cylindrical bond between a composite tube and a metallic plug. The importance of thermal effects and plasticity are studied also to determine the influence of bonding procedures and adhesive selection on joint strength. The structural configuration was to be modeled using a finite element software package to estimate internal stresses and implement various failure criteria. Firstly though, a feasible manufacturing procedure had to be determined in order to realize these goals.
Figure 1-1: W.A.S.P. aircraft, courtesy of Draper Laboratories
1.3
Approach
In pursuit of these goals, a representative structural configuration was selected as the focus of the experimental and analytical work. Having selected a generic geometry, manufacturing procedures for joining components were developed. The procedures were then evaluated empirically by mechanical testing, and analytically through finite element simulations.
The geometry selected was based upon a sub-assembly of the Wide Area Surveillance Projectile ("WASP") which was, at the time, an ongoing project underway at Draper Labo-ratory in Cambridge, MA. The WASP is a small, unmanned, reconnaisance aircraft, designed to fit inside an artillery shell in its undeployed state, and survive a high-g launch from a 5" gun [8].
In one recent design iteration, shown in Figure 1-1, the aircraft featured an aluminum bulkhead connecting a tubular composite fuselage to the rear with a composite nosecone facing forward. It was intended that one or both of these interfaces be adhesively bonded.
and testing program were determined.
A manufacturing procedure for composite tubes by Kessler [8] was used to make the fuselage components, while the bulkheads were envisioned as aluminum parts with radial symmetry, which were inserted and bonded into the tubes. For strength testing, the speci-mens were loaded centrally, parallel to the long axis of the tubes.
A set of adhesive systems and temperatures were chosen for bonding the test specimens. Evaluating the influence of assembly tolerance between the metal and composite required different adhesive systems to be used. Different cure temperatures allowed residual thermal stresses to be introduced in certain cases.
Joined specimens were loaded until the aluminum insert was completely extracted from the tube. During extraction, the load and displacement of the testing machine head were recorded, so that salient mechanical behavior could be identified.
1.4
Thesis Outline
This thesis is intended to provide the reader with a clear and concise explanation of the work undertaken. The thesis is structured as follows.
Chapter 1 describes the motivation and objectives of the work. In this chapter a broad outline of the experimental approach can also be found. In Chapter 2 a summary of previous work and its relevance to this project is discussed. Chapter 3 covers the analytical modeling conducted as part of this thesis. Details include model generation and assumptions, material properties used and loads applied. In Chapter 4, the results of these analyses are presented along with a discussion of the failure criteria used. Chapter 5 documents the experimental aspects of the project. Fabrication of test specimens and test hardware is documented, as are all testing procedures. Chapter 6 summarizes the experimental results. The chapter presents test data for ultimate strength, qualitative observations on defects, failure modes and features of failed specimens. Chapter 7 compares experimental data with numerical analysis and attempts to identify sources of disagreement. In the final chapter, Chapter 8, conclusions of the project are presented including recommendations for producing high-reliability joints between dissimilar curved components. This thesis concludes with recommendations for
Chapter 2
Background
2.1
Adhesive Joining
The benefits of joining with adhesives rather than mechanical fasteners are summarized by Andrews [9]. Stress concentrations that are seen in riveted joints are largely avoided in adhesive joints, because the stresses are distributed over a far greater area. Eliminating stress concentrations improves fatigue life of a joint, and additional material is not required to bolster the joint, as it would be around a bolt hole. Weight savings relative to mechanical fasteners can reach as much as 25%, depending upon the type of loading seen by the structure. Since adhesive bonds are distributed over a large area, the resulting joint is stiffer than a riveted equivalent, which constrains the structure in a far smaller region. Adhesives make possible the joining of delicate or brittle structures which could be damaged by riveting. Graphite-Epoxy composite structures often fit into this category, and tend to sustain damage when holes are machined into them.
While adhesive joints offer considerable performance advantages, other factors often result in bolted joints being favored. Bonding dissimilar components can introduce appreciable thermal stresses. Bonded structures are difficult to inspect and cannot be disassembled. They are also prone to environmental degradation and are sensitive to bonding procedures [10].
in residual stresses contained within the joint. Bolted joints are relatively insensitive to the environment and enjoy a wider range of applications than adhesives. For metal components of sufficient thickness, a bolted connection is often the more appropriate choice.
2.2
Previous Work
2.2.1
Curved Specimens
The procedure for manufacturing composite tubular specimens used in this project was created by Kessler, as part of a project completed in 2000 to design a high-g tolerant structure for the WASP aircraft [8]. Kessler did some preliminary work on attaching the composite fuselage to the aluminum fore-bulkhead using a cleaning/sanding surface preparation. His joining methods spanned both adhesive bonding and mechanical fastening, but suffered a high rate of adhesive failure, which limited the strength of the bonds to far below that of the adhesive itself. He attributed this type of failure to inadequate surface preparation.
2.2.2
Surface Preparation and Bonding
Adhesive bonding has suffered slow adoption for joining of primary structures. A high rate of bond failures in service (typically of repair patches or minor structural joints) has called the reliability of the adhesives into question [11]. Many agree though that the poor performance of adhesive bonds can be attributed much more to bond design and fabrication procedure than to any intrinsic material property [12]. Adhesive bonding for industrial applications has a shorter history than the use of mechanical fasteners. Over only the last 50 years though, a large body of literature has been published concerning design principles for effective adhesive joining. Analysis methods, structural tests and design guides that are now available are speeding the introduction of adhesive bonding into more critical flight structures, particularly those constructed from composites.
The crucial importance of proper surface treatment for long-term bond strength is high-lighted by Davis. Each adherend surface, he states, must be uncontaminated, chemically active and resistant to hydration [11]. The methods for satisfying these criteria vary in their
-- Aluminum
Adhesive Figure 2-1: Double lap shear specimen
Composite\
Pre-crack
Adhesive
Figure 2-2: Double cantilever beam specimen applicability to and performance with different materials.
Barbara Huppe completed a research project [2] in June 2001, investigating the effects of surface preparation and manufacturing procedures on the bond strength of metal-composite joints. Double lap shear (DLS) specimens and double cantilever beam (DCB) specimens were fabricated for compliance with ASTM standards for mechanical testing of bonded joints. These test geometries are shown in Figures 2-1 and 2-2.
In order to improve the bonding, Huppe tested many combinations of composite surface preparation and metal surface preparation. The composites were either unprepped, cured with peel-ply instead of release film, or sanded. The aluminum adherends were prepared in a number of different ways. Some were sanded to remove the oxidation layer prior to bonding. Others were primed using BR-127 chemical etchant. Some of the primed components were also grooved to increase their bonding surface area. Still other metal parts were anodized. Of these combinations, Huppe observed the highest strength from sanded composites bonded to primed aluminum.
In addition to surface preparation, Huppe used two different manufacturing methods. In most cases, the adhesive bonding was performed as a secondary bond using previously
0 1000 2000 3000 4000 5000
Failure Stress (ps)
Figure 2-3: Bond strength against specimen preparation [2]
cured graphite-epoxy laminates. In the remaining cases, however, the laminae were co-cured with the adhesives into bonded specimens in a single cure. Using both methods, the bonded sheets were machined into test specimens after joining. While co-curing afforded higher strengths than using unpreparared composites, the co-cured specimens were not as strong as those made with sanded composites in a secondary cure. In addition, the process of cocuring was considered a more difficult manufacturing procedure, despite reducing the number of required cures. A summary of experimental results from Huppe are depicted in Figure 2-3.
The work completed by Huppe provides, in large part, the starting point for this work, which carries on using her conclusions about surface preparations, and seeks to identify complexities encountered in moving from flat coupons to curved components.
A large body of work exists in the fields of composite bonding [13, 14, 4], metal-composite bonding [15, 12, 16, 3, 2, 17-19], and metal-metal bonding [20]. The majority of this work, however, was conducted at the coupon level, using flat specimens assembled into either DLS or DCB samples. Loftus et al questioned the applicability of strength and fatigue data
procured from standard test geometries to more practical geometries [16]. Their specimens bonding small metal attachments to larger composite structures (as seen in race cars) were found to be significantly stronger than supposed using standard tests, with fatigue lives several times greater also.
There is agreement that adhesive bonding has vast potential for joining of composites, and composites with dissimilar materials [21, 11, 19, 12]. In applications where metal components are being replaced with lighter weight composites, the fastening methods also must often be replaced. Spot-welding, commonly used for joining steel automotive structures, is viable neither for aluminum nor composites [22], while adhesives produce stiffer bonds without additional weight. Using mechanical fasteners with composite laminates requires holes to be machined through the laminate, damaging the hole. Van Rijn states "to retain strength an increase in plate thickness by a factor of approximately 3 is required locally." [12]
2.2.3
Thermal Effects
Huppe identified residual thermal stresses as an important issue in bonding of dissimilar components. In addition to the thermal mismatch between the adherends and the adhesive, there is further mismatch between the adherends themselves. This introduces stresses into the structure, and particularly into the bond, which add to the stresses introduced by applied loading, thereby reducing the load-carrying capability of the structure. A closed-form analy-sis of thermal mismatch and stiffness imbalance in DLS joints was presented by Hart-Smith [23].
Further work in this area [3] was carried out by Watkins and Park in 2001, whose research was focused on determining the scale of the residual thermal stresses Huppe had encountered by varying the temperature difference between curing and testing. As with Huppe, DLS metal-composite specimens were subjected to tension tests using a servohydraulic load frame, but in these tests a thermal chamber was integrated to heat or cool the specimens to the desired temperature.
Watkins and Park estimated the thermal stresses present in the specimens using a ther-mal model analysed using ABAQUS software. Specimens were loaded to failure at various
Figure 2-4: Stresses in Al-GrEp DLS specimens [3]
temperatures. The maximum applied stress was superposed with the thermally-induced stress to determine the overall strength of the bond as a function of temperature. They measured approximately 500% greater strength of the bond at -250F than at 200F, with the strength varying quite linearly at temperatures in between. However, the strength benefit at low temperatures could not be realized, because while strength increased with lower tem-peratures, residual stress grew at an even greater rate. The actual load-carrying capability of the specimens improved with increasing temperature by slightly over 200%. These results are shown in Figure 2-4.
* Sum
a Average Stress Thermal Induced
-Linear (Sum)
-Linear (Average Stress)
Linear (Thermal Induced)
-300 -200 -100 0
Tenperature
Chapter 3
Finite Element Modeling
3.1
Introduction
This chapter discusses the set of numerical analyses carried out to predict the strength of the bonds between curved adherends that are the focus of this work. Two separate software packages were used to investigate four different failure criteria. The bulk of these analyses, concerned with quantifying stress and strain, proceeded using ABAQUS/CAE. Modeling of the structure for fracture analysis was primarily completed using FRANC2D. Details of the model creation are presented in this chapter. The results of these analyses are summarized in Chapter 4.
3.2
Failure Criteria
Various modes of failure are possible for bonded specimens. An attempt was made to de-termine the limiting behavior of these specimens by considering a number of failure criteria and using them to estimate specimen strength.
3.2.1
Maximum/Average Shear Stress
ABAQUS/CAE was used to estimate the maximum shear stress observed in the bond as the plug was steadily extracted. The software was also used to determine the mean shear stress
encountered throughout the bond.
3.2.2
Von Mises Yield Criterion
The ABAQUS software returns the Von Mises stress by default in its analyses. The Von Mises stress is calculated from the principal stresses according to:
012
= 1[(a,, - U11 1)2 + (Or - a111)2 + (a, - a1 1)2] (3.1) The criterion estimates that a material will yield in regions where the Von Mises stress exceeds the yield strength, ay:Ovm Jy (3.2)
3.2.3
Strain Invariant Failure Theory [1]
This criterion proposes that failure of a structure will occur when the first strain invariant, ei
exceeds some critical value Ec. The first strain invariant is defined as the sum of the principal strains, as expressed by equation 3.3.
E1 = 61 + El1 + Eii (3.3)
The property ei, can also be extracted from ABAQUS.
3.2.4
Fracture
Fracture mechanics is based upon the idea that for a crack to propagate, a certain energy per unit area of new crack is required. Assuming an initial pre-crack, one can determine the increase in energy J U required to create new crack area SA. Fast fracture is assumed to occur when the ratio of these quantities, known as the strain energy release rate G, exceeds the critical strain energy release rate Gc, a material parameter governing fracture. Since the energy stored in the structure U depends upon the thermomechanical loading, a critical crack size can be identified for fracture at a given load [24].
In this work the fracture analysis was carried out using FRANC2D software [25].
The stress intensity factor K, a measure relating the geometry and loading, can be de-termined from equation 3.4.
K = of-r (3.4)
At the onset of fast fracture, the quantity oV7ra is a constant, known as the critical stress intensity factor or fracture toughness Kc. By specifying the fracture toughness of the adhesive, Kc (= v/EGc), where E is the Young's modulus, the stress at which K exceeds Kc can be determined for a given crack length a. Conversely, the critical crack length at a given stress can be found if Kc is known.
3.3
Stress Analysis
3.3.1
Platform
The majority of the finite element simulation was carried out using ABAQUS/CAE. The models were run on a desktop computer in TELAC running Windows 2000 Professional on dual Pentium 4 processors. Model creation, analysis and results postprocessing all took place within CAE.
3.3.2
Geometry
The model constructed in ABAQUS/CAE is shown in Figure 3-2. The main model was constructed as axisymmetric, which was described by a planar section of the bonded specimen and an axis of revolution. There were three parts to the assembly: a representation of the tube, one of the plug, and a third to model the adhesive. Since the plug is shaped as a disk with a centered hole, its section was constructed as a 0.5" by 1.22" rectangle displaced from the axis by 0.5". Similarly, the tube was constructed as a rectangle measuring 2.5" long by 0.1" wide, while the bond was modeled in a number of ways to fit in the space between the two adherends.
0.5" 2.0" 0.5" 1.22"1
t I t I I
MMMMMO
-I
7777W
Figure 3-2: Finite element model of bonded specimen
3.3.3
Materials
There are three major material constituents of an assembled specimen. Each of the two adherends is made of a different material and the bond out of a third.
The tubes were made of AS4/3501-6 graphite epoxy 18-ply laminates. The stacking se-quence was [0t45]3,. Since this is a balanced, symmetric layup, the material is characterized as orthotropic, and is described by 9 elastic constants. These constants were determined us-ing Classical Laminated Plate Theory (CLPT) [26] by transformus-ing known properties of a unidirectional ply. The thermal expansion coefficients were derived also from ply properties, by constructing a flat laminate of the same stacking sequence in ABAQUS.
Due to the directionality of the laminate, a material coordinate system had to be specified in CAE. The properties specified in Table 3.2 are consistent with a coordinate system whose 1-direction extends radially outward from the tube axis, which lies collinear with the 2-direction. The 3-direction points circumferentially, lying in the plane of the laminate plies.
Table 3.1: Material data: Aluminum [5]
Material Name AL2024-T351
Material Type Isotropic
Elastic-Perfectly Plastic
E 10.5 Msi
v 0.33
a_ 12.9 pE/0
F
Oy 47.1 Ksi
Table 3.2: Material data: Graphite-Epoxy [6] Material Name AS4/3501-6
Material Type Orthotropic Elastic D1111 1.46 Msi D1122 0 Msi D2222 9.37 Msi D1133 0 Msi D2233 2.97 Msi D3333 8.67 Msi D1212 1.11 Msi D1313 1.11 Msi D2323 3.34 Msi ai 16.0 pe/*F a2 -0.51 pc/*F a3 3.58 Ae/*F
material with elastic-perfectly-plastic deformation behavior. The relevant material constants were specified by the vendor.
The bond material was assumed to be isotropic, elastic-perfectly plastic, with properties as supplied by the vendor.
The properties of the materials used are summarized in Table 3.1, 3.2 and 3.3. The coordinate system in which the graphite-epoxy orthotropic properties are expressed is found in Figure 3-1. The 1-direction is through-thickness, the 2-direction is longitudinal, and the 3-direction is transverse.
Table 3.3: Material data: Film Adhesive [7]
Material Name FM-123
Material Type Isotropic
Elastic-Perfectly Plastic E 390 Ksi v 0.3 a_ 40 pe|*F Oy 10.3 Ksi 'ry 5.15 Ksi
3.3.4
Assembly
The three model parts, representing the plug, the tube and the bond, were assembled in CAE such that the upper surfaces (those of circular section) of each aligned at the same station in the 2-direction. Since their diameters were already specified, this was sufficient to constrain fully the parts with respect to each other. The adhesive was 'tied' to the plug on its interior surface and to the tube on its exterior surface. This interaction effectively assumes no adhesive failure.
3.4
Boundary Conditions
The clamp used on the specimens gripped the bottom 1" of the composite tube, which was 4" long. In the ABAQUS model, this boundary condition was enforced by reducing the length of the tube to 3" and requiring displacements and rotations at the unbonded edge of the tube to be identically zero.
In addition, the presence of a closely-fitting bolt through the central hole in the plug necessitated another boundary condition. To keep the plug from overlapping the bolt as it deformed, the interior surface of the hole was denied any displacement in the radial direction.
3.4.1
Loads
ABAQUS allows the application and modification of loads and fields chronologically. Initial conditions are specified in the 'Initial Step', and additional steps are added to introduce or change any environmental condition. Since no stresses were present before joining the specimens, the initial step was specified to be the state of the specimens immediately after curing, while still at the cure temperature.
Thermal Loads
Since the test specimens were bonded before they were tested, thermal stresses were incorpo-rated before the applied mechanical stresses were. To simulate this, a uniform temperature field was created in the initial step. It was applied to the entire assembly. Initially then, the model was stress-free at 240 degrees Farenheit.
The first added step represented the cooldown period of the specimens to room temper-ature after curing. The isothermal field was brought down to 70F. At this point, the model would determine the thermally-induced stresses caused by the parts undergoing different rates of contraction.
Mechanical Loads
The last step introduced the loads caused by the servohydraulic test machine. The thermal field remained at 70F in this step. The underside of the aluminum plug experienced a uniform displacement in the 2-direction to apply the extraction force.
3.4.2
Meshing
The area of interest in and around the bond is small compared to the overall area of the model. To reduce processing time, large areas of the model were coarsely meshed, while the bond itself had a high resolution. The aluminum plug had the largest area, so large elements were desired away from the bond. However, in order to be compatible with the fine mesh where the plug meets the bond, one side of the aluminum plug also needed to be finely meshed. The plug was seeded with edge nodes using a bias function to set a ratio
of 25:1 between the element sizes at each end. The node spacing in the 2-direction was uniform throughout the model, except in the lower half of the tube, away from the bond, where the spacing was considerably larger. The smallest node spacing in the 1-direction was every 0.003" across the thickness of the bond. After preliminary modeling revealed that the bottom of the bond was the primary area of interest, additional refinement was added in this region. The model was meshed with quadratic, axisymmetric stress elements, referred to in ABAQUS as CAX8 elements.
3.4.3 Analysis and Data extraction
The loads and fields applied to the model were 'ramped' over a step. For the initial 'cooldown' step, the temperature field dropped linearly from 240F to 70F. Multiple frames were taken during each step. At each frame, the field variables were recorded for a fuller understanding of the bond behavior. For the elastic analyses, only one frame was necessary as linear ramps would result in linearly varying results. Analyses in ABAQUS determined component and principal stresses and strains within the bond, as well as nodal displacements. Visualizations of these field variables was completed using ABAQUS/CAE. In cases where averages or extrema were desired, the nodal values of these quantities were exported into Microsoft Excel for processing. Once processed, these results were plotted using Matlab.
3.5
Fracture Analysis
Fracture analyses were carried out using FRANC2D, published by Cornell University. The geometry, loads and boundary conditions used in ABAQUS for the stress analysis were carried over to FRANC2D, but there were some small differences. Firstly, the composite tube was modeled as isotropic rather than orthotropic as it had been in CAE. In addition, meshing was done somewhat differently in the fracture software, to provide sufficient refinement on the interior end of the bond for the fracture analysis. The thermal and mechanical loads were applied in separate load cases. The software calculated the stress intensity factor for each load case separately, as well as for the combined case.
The software was used for the fracture analyses for its ability to incorporate a crack after a model has been generated, and then to remesh adaptively the region around the crack as it propagates.
A crack of length a was incorporated starting at the interior end of the bond, midway between the aluminum and the composite. The software then calculated the stress intensity factor at the crack. By specifying Kc, the critical crack length to propagate the crack at that applied displacement could be found. From this, the failure load and thus the overall strength of the bond could be determined using the load-displacement results from ABAQUS.
Chapter 4
Modeling Results
A depiction of a bonded specimen is included as Figure 4-1, to illustrate reference points mentioned throughout this chapter.
4.1
Elasticity
Figure 4-2 is a plot of applied load versus displacement for a clamped bonded specimen. Both the elastic and plastic responses are plotted.
As can be expected, in the plastic case a smaller load is applied for a given displacement, once a sufficient load has been reached for plasticity to begin. However, comparing the two plots shows that the elastic and plastic curves both reach the average failure load encountered by the strongest specimens, which was approximately 12,500 lbs, at approximately 4.1mil. The elastic and plastic curves do not diverge significantly until loads approach 20,000 lbs. When the extension of the unclamped region of the tube, uB, is subtracted, this displacement indicates a maximum elastic shear strain in the bond of 6.1%.
C D
Figure 4-1: Reference locations on bonded specimen
4.2
Strain-Displacement
4.2.1
Cooldown
The total strain experienced in the structure is comprised of elastic, plastic and thermal components. These strains result in displacement of the structural components in three directions. Due to the cylindrical geometry involved, strain in the 'hoop' direction e33, is linked to a displacement in the 1-direction, Adi by Equation 4.1.
Adi = e3 3di (4.1)
All of the structural components undergo this diametric reduction after curing at 240F. Since the composite tube and the aluminum plug are far stiffer than the adhesive between them, the difference between their rates of contraction largely determines the strains within the bond. As the structure cools after curing, the spacing between the aluminum and the composite increases. The adhesive expands radially as the plug and tube move apart. Tensile
Load-displacement curve for bonded specimen 18000 16000 - 14000-12000 --Elastic Plastic 'C10000-*0 -' 8000- 6000- 4000- 2000-0 0 1 2 3 4 5 6 Displacement [in] X 10~ Figure 4-2: Load vs displacement curve for bonded specimen
strain in the adhesive is introduced in the 1-direction through this action.
The adhesive, if unconstrained, would also contract during cooling, but is unable to do so while it remains attached to both adherend surfaces. For equilibrium, this tendency for the bond to contract is overcome by tensile stresses applied to the adhesive by the plug and the tube. After cooling then, the bond is experiencing a positive stress and strain in the 1-direction.
Since the aluminum also contracts more than the composite in the 2-direction, the bond is forced to contract more at its interior surface bonded to the plug, and less at its exterior surface bonded to the tube. As a result, the strain along AC, C22, is smaller than along
BD. This gradient of e22 in the 1-direction creates a shear strain distribution e12, throughout the bond. Again the bond itself tends to contract in the 2-direction. Since the bond is not constrained in any planes normal to the 2-direction, the bond is able to contract between the two walls, but not at the walls themselves. The bond adopts a concave shape between C and D, and to a lesser extent between A and B.
4.2.2
Loadup
The adhesive material is primarily loaded in shear. Due to the stiffness of the aluminum and the composite, and the uniform displacement of the plug in the 2-direction, the aluminum and composite surfaces stay mostly parallel as they slide against the adhesive. The applied displacement creates shear stresses U1 2 which transmit the reaction forces holding the tube
in place, through the adhesive, to the plug which is being pulled upon.
The creation of shear stresses in the bond compounds the tensile stresses al caused by thermal mismatch during the cooldown step. With this additional source of stress, the maximum principal stress in the bond increases. When there are no thermal stresses present, the maximum shear stress in the bond, Tma,, equals r1 2. The principal stresses are then
[-T1 2, 0, T12], and are aligned in the coordinate system [a,
#,
y], as illustrated in Figure 4-3, aMohr's circle showing the stress state in the bond. For comparision, a possible Mohr's circle for the bond with residual tensile stresses through the bond is shown in Figure 4-4.
Figure 4-3: Stress Mohr's circle for bond in pure shear
12 12 3,Y 1
--- With residual stresses
- No residual stresses
Figure 4-4: Stress Mohr's circle for bond in tension and shear
thermal stresses are non-zero is greater than in the case where there are no thermal stresses present. For these diagrams, the thermal stresses created in the 2-direction were assumed to be zero. However, including normal stresses in the 2-direction would still result in a maximum shear stress greater than or equal to T1 2, as long as the 3-direction remains a
principal axis.
While it is not generally the case that a Mohr's circle with a greater maximum shear stress has a greater von Mises stress, it is only for specific values of the intermediate principal stress, <7,, that this is not so. Indeed, the intent of the von Mises yield criterion is that yield is governed by the maximum shear stresses in the three planes defined by the three principal directions.
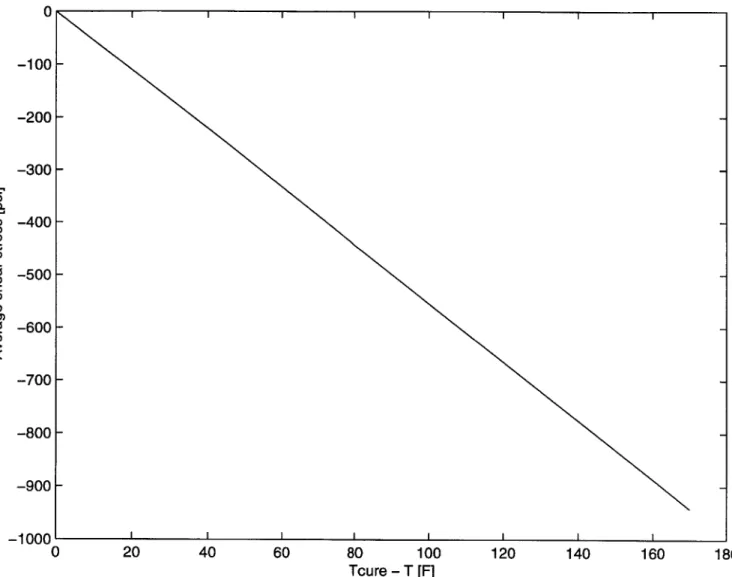
0 -100 -200--300 C. -400-c -500-CO a,) CD c -600--700 -800--900 -1000 I I I I I 0 20 40 60 80 100 120 140 160 180 Tcure - T [F]
Figure 4-5: Average shear stress in bond during cooldown
4.3
Failure Modes
4.3.1
Maximum/Average Shear Stress
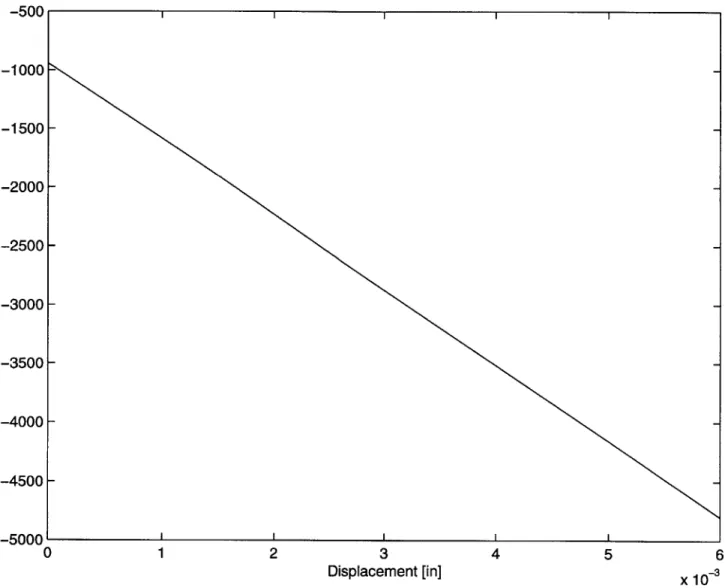
Using an elastic analysis, the average shear stress in the bond (measured at each element centroid), was found to be 4800psi, with a local maximum of 8380psi, when a displacement of 6 mil is applied. Allowing plasticity in the adhesive lowered the average shear stress to 4280psi, with a centroid maximum of 5940psi.
-500 -1000- -1500--2000 -CL CD -2500 U, U) c -3000--3500 -4000- -4500--5000 0 1 2 3 4 5 6 Displacement [in] X 10-3 Figure 4-6: Average shear stress in bond during loadup
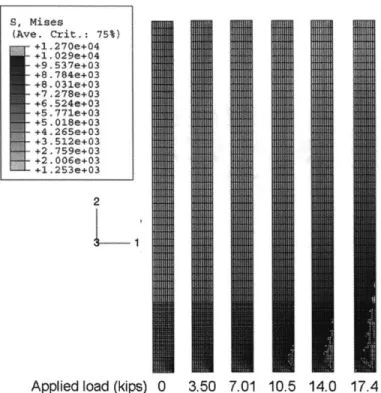
S, Mises (Ave. Crit.: 75%) +1.270e+04 +1. 029e+04 +9.537e+03 +8 .784e+03 +8. 031e+03 +7 .278e+03 +6. 524e+03 Ad377.e503 +5.018e+03 +4 .265e+03 +3.512e+03 +2.759e+03 +2.OO6e.03 +1.253e+03 2
Applied load (kips) 0 3.50 7.01 10.5 14.0 17.4 Figure 4-7: Plastic zone growth with applied load
4.3.2
Von Mises Yield Criterion
The von Mises stresses were plotted in the bond for increasing applied displacement. The plastic region of the bond originated near point B, and continued upward and inward with
increasing load. The onset of plasticity during the cooldown after curing is minimal. The spread of plasticity during applied displacement is illustrated in Figure 4-7 and the behavior local to point B in Figure 4-8. The von Mises stresses in the bond after cooldown are shown
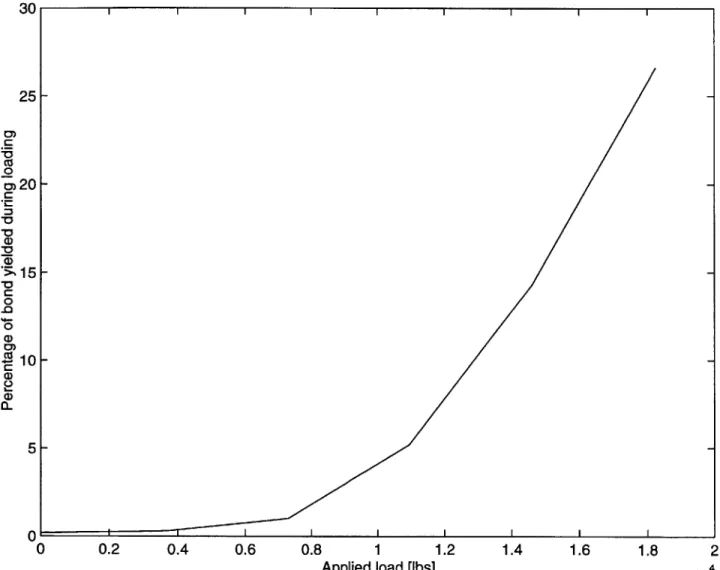
in these figures as the zero load image. The percentage of the bond that has reached the yield stress of the adhesive is plotted against applied load in 4-9.
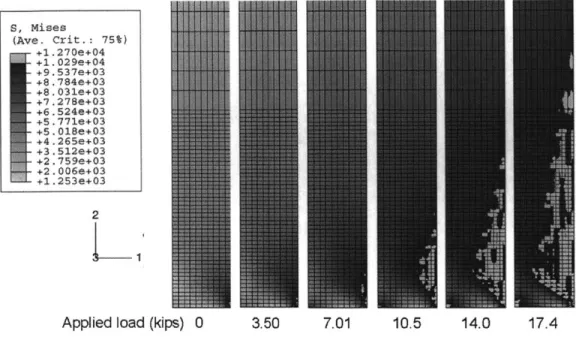
After cooling to room temperature following the bond cure, specimens bonded with FM-123 film adhesive are estimated to experience a plastic zone in 0.2% of the bond area, around point B. When subsequently loaded by a uniform displacement to approximately 14,000 lbs, the plastic region spreads to cover 14.3% of the bond area. Initially this spread proceeds upward in the direction BD, then through the thickness of the bond towards point C, but the plastic zone remains local around B.
S, Mises (Ave. Crit.: 75%) +1.270e+04 +1.029e+04 +9.537e+03 +8 .784e+03 +8. 031e+03 +7 .278e+03 +6 .524e+03 +5.771e+03 +5.018e+03 +4.265e+03 +3 .512e+03 +2 .759e+03 +2.006e+03 +1.253e+03 2
Applied load (kips) 0 3.50 7.01 10.5 14.0 17.4
Figure 4-8: Plastic zone growth locally around point B
4.3.3
Strain Invariant Failure Theory
The first strain invariant was extracted from ABAQUS for the bond region of the model. The average values are plotted against load in Figure 4-10. The values at zero applied load correspond to the strain caused by post-cure cooling. Since the cooldown process is elastic, these values vary linearly from zero at the cure temperature. The thermal strains gener-ated during cooldown remain constant while displacement is applied. The elastic, plastic
and thermal strains are summed and plotted as Total strain. Elastic strain in ABAQUS is all mechanically-induced strain up to the strain at which the elements undergo plastic
deformation. In elements that have undergone plastic deformation, the elastic strain is at a maximum, and the plastic strain is positive. Thermal strain is strain caused by a temperature field which changes spatially or temporally. Boundary conditions or thermally-mismatched
materials may induce elastic strains due to a change in temperature when there are no exter-nally applied loads present. The sum of these three components (when creep strain is zero), is referred to in ABAQUS as total strain.
While the elastic strain invariant is positive, inclusion of the thermal strain shifts the curve downward, so the invariant remains negative under applied displacement, with only
30 25-CO 0 0m20-C *0 0 a) 0-CD 10 CD 5--0O I I I I I I I I 0 0.2 0.4 0.6 0.8 1 1.2 1.4 1.6 1.8 2 Applied load [lbs] x 101
0.01 0.005-0 - - --...- - - ...- -- ...- - -...- - -- --. --. .. -. -- ---.. . --. ---. ..- --. ..-..-- -... - --. --. ..- --. .. - Total strain - - Elastic strain - -0.005 -- Plastic strain C -> Thermal strain C: --0.01 --0.015 --0.02 - - - - - - - - - -- - - . --. - - -- - -- -- -- -- ---- -- - --0.025 0 0.5 1 1.5 2 2.5 Applied load [lbs] x 104
small variation.
4.3.4
Fracture
A plot of KII against initial crack length is included as Figure 4-11, for a crack extending into the bond from the midpoint of AB. The mode II stress intensity factor, KIr, is calculated using the FRANC software by both the J-integral [27] and Displacement Correlation methods [28]. The structure experienced the same loading as was applied for the stress analysis in ABAQUS. The structure was cooled down from 240F to 70F, and subsequently a uniform displacement was applied to the bottom edge of the aluminum plug. The curve reaches a constant when the initial crack length exceeds approximately 0.03". Figure 4-12 shows the linear relationship between KII and applied displacement, u, in the linear elastic regime of the model.
4500 4000- 3500-3000 -2500 Z2000 - 1500- 1000- 500-0 I-ii I,
/
//
/ //
I
/ I/
/
I
/
I
/
0 0.01 0.02 0.03 0.04 - - J-integral - Displacement Correlation 0.05Initial crack length [in]
0.06 0.07
Figure 4-11: Mode II stress intensity factor (KII) under thermomechanical loading
3500 I 3000 -2500- K1 (DCT) . . K,, (J-integral) 2000- 1500-0 1 2 3 4 5 6
Applied displacement [in] x 10-3
Chapter 5
Experimental Procedure
5.1
Introduction
This chapter describes the experimental work that took place as part of this project. Man-ufacturing and joining methods are presented, as are preparation details for the specimen adherends. Extensive remarks on the experimental set-up are given, followed by testing and data collecting procedures. The chapter concludes with a matrix of tests completed, decribing the combination of surface preparation and joining method used in each.
5.2
Specimen Manufacture
In this section the methods employed are presented to produce the two components of the joined test specimens. The graphite-epoxy tubular laminates were fabricated using the facil-ities of TELAC, and were machined by Mr. Peter Morley of the MIT Central Machine Shop. The aluminum plugs were cut in the Gelb Laboratory in the Department of Aeronautics and Astronautics.
5.2.1
Composite Tubes
Graphite-epoxy tubes were made from AS4/3501-6 pre-impregnated tape ("pre-preg") using the TELAC lab facilities. The stacking sequence of the pre-preg plies was [0±45]3,, with the
Graphite-Epoxy Tubes
3.5"
Legs
14" Aluminum Mandrel
Figure 5-1: Three tubes layed up on aluminum mandrel 0 degree datum aligned with the longitudinal axis of the tube.
Lay-up
An aluminum mandrel measuring 5' x 3.5" diameter was used for laying up the laminates. Firstly, the mandrel was treated with Mold-Wiz and wrapped in non-porous teflon which was secured in place using 3M spray adhesive. The mandrel was to accommodate 3 laminates in a line, as shown in Figure 5-1, and so flash tape was wrapped at 3 locations on the mandrel as references for beginning the layup.
A spool of pre-preg was removed from cold storage and allowed to warm for one hour before unwrapping, to reduce condensation forming on the cold material. Plies were cut using 0 and 45 degree templates to make sheets measuring 12" by 14". Since the circumference of the laminate increased with each additional ply, the sheets were each trimmed down from 12" to the specific dimension required to abut itself exactly when wrapped. Care was taken to ensure no air was enclosed when wrapping plies. Following layup of all three laminates, the mandrel was transported to the autoclave room to be bagged for an autoclave cure.
Vacuum bag
Fiberglass bag ( x 3) Bleeder bag ( x 6) Porous Teflon Duel layer top plate GNPT (w/adhesive) Composite laminate GNPT (w/adhesive)
Aluminum mandrel
Figure 5-2: Schematic of bagging material placement Curing
To prepare the laminae for curing, the tubes had to be wrapped in a variety of materials. The wrapping sequence was succesfully determined by Kessler [8]. The first layer wrapped around the plies was GNPT, so that the cured tubes would not stick to the other curing materials. Next a dual layer metal top plate was tightly wrapped and generously taped to give the tubes a consistent thickness and surface finish. Porous teflon, bleeder paper and fiberglass were then wrapped to channel away and absorb excess epoxy, and to maintain vacuum. Finally the vacuum bag was wrapped and secured with vacuum tape at both ends, and along the length, of the mandrel. The bagging profile is reproduced from Kessler in Figure 5-2.
The autoclave cure followed a standard TELAC cure cycle. Firstly, a vacuum was pulled on the mandrel, removing the air from the laminae. Next, the internal pressure in the autoclave was increased to 85 psi, with a corresponding increase in internal temperature. At

![Figure 2-3: Bond strength against specimen preparation [2]](https://thumb-eu.123doks.com/thumbv2/123doknet/13870486.446189/21.918.256.650.119.532/figure-bond-strength-specimen-preparation.webp)
![Figure 2-4: Stresses in Al-GrEp DLS specimens [3]](https://thumb-eu.123doks.com/thumbv2/123doknet/13870486.446189/23.918.126.778.112.463/figure-stresses-in-al-grep-dls-specimens.webp)