HAL Id: hal-01393376
https://hal.archives-ouvertes.fr/hal-01393376
Submitted on 7 Nov 2016
HAL is a multi-disciplinary open access
archive for the deposit and dissemination of sci-entific research documents, whether they are pub-lished or not. The documents may come from teaching and research institutions in France or abroad, or from public or private research centers.
L’archive ouverte pluridisciplinaire HAL, est destinée au dépôt et à la diffusion de documents scientifiques de niveau recherche, publiés ou non, émanant des établissements d’enseignement et de recherche français ou étrangers, des laboratoires publics ou privés.
Automatic recognition of regional phonological variation
in conversational interaction
Vincent Aubanel, Noël Nguyen
To cite this version:
Vincent Aubanel, Noël Nguyen. Automatic recognition of regional phonological variation in con-versational interaction. Speech Communication, Elsevier : North-Holland, 2010, 52, pp.577-586. �10.1016/j.specom.2010.02.008�. �hal-01393376�
Automatic recognition of regional phonological variation in
conversational interaction
Vincent Aubanela,∗, Noël Nguyena
aLaboratoire Parole et Langage, CNRS & Aix-Marseille Université, 5 avenue Pasteur, 13100
Aix-en-Provence, France
Abstract
One key aspect of face-to-face communication concerns the differences that may exist between speakers’ native regional accents. This paper focuses on the characterization of regional phonological variation in a conversational setting. A new, interactive task was de-signed in which 12 pairs of participants engaged in a collaborative game leading them to produce a number of purpose-built names. In each game, the participants were native spea-kers of Southern French and Northern French, respectively. How the names were produced by each of the two participants was automatically determined from the recordings using ASR techniques and a pre-established set of possible regional variants along five phonolo-gical dimensions. A naive Bayes classifier was then applied to these phonetic forms, with a view to differentiating the speakers’ native regional accents. The results showed that native regional accent was correctly recognized for 79% of the speakers. These results also revealed or confirmed the existence of accent-dependent differences in how segments are phonetically realized, such as the affrication of /d/ in /di/ sequences. Our data allow us to better cha-racterize the phonological and phonetic patterns associated with regional varieties of French on a large scale and in a natural, interactional situation.
Keywords: conversational interaction, regional phonological and phonetic variation, automatic speech processing, French, Sociophonetics
1. Introduction
It is a common situation in our everyday life to engage in a conversation with someone who has a different accent. While there have been many studies on the processing of foreign-accented speech, increasing attention has in the last few years been also paid to the impact that phonological variation within the speakers’ language may have on speech communica-tion (Brunellière et al., 2009; Clopper and Bradlow, 2008; Conrey et al., 2005; Cutler et al., 2005; Delvaux and Soquet, 2007; Dufour et al., 2007; Evans and Iverson, 2004; Floccia et al., 2006; Hay et al., 2006; Kraljic et al., 2008; Sumner and Samuel, 2009). For example, the phonemic repertoire may be different in one regional variety relative to another and this may make it more difficult for listeners to recognize words in a variety that is not their native one. In a recent work on French (the language with which the present study is also concerned), Dufour et al. (2007) concentrated on the differences that exist between the vowel system of
∗. Corresponding author
Email addresses: [email protected] (Vincent Aubanel), [email protected] (Noël Nguyen)
Northern French and that of Southern French, and showed that these differences significantly affected the way in which spoken words were identified by speakers of both accents. Floccia et al. (2006) found that there was an initial and temporary processing cost associated with the recognition of words spoken in an unfamiliar regional accent. Delvaux and Soquet (2007) examined the effect that exposure to a non-native accent had on speech production in Bel-gium French, and found phonetic imitation patterns between accents. The mechanisms that allow speech communication to be successful across regional accents, however, remain to be fully characterized.
The present study aims to provide a contribution towards a better understanding of these mechanisms, with a focus on two major varieties of French as spoken in France, namely Northern French (NF) and Southern French (SF). There are well-documented differences between those two varieties at the phonological, phonetic, and prosodic levels (e.g., Carton et al., 1983; Durand, 1990; Durand and Lyche, 2004). This includes differences in the pho-nemic repertoire of each variety as well as differences in how segments may be phonetically implemented, as will be detailed in Section 2. The broad distinction between NF and SF has been shown to be perceptually relevant in a recent study conducted by Woehrling (2009). In this study, listeners were presented with sentences spoken by speakers from five different re-gions across France in a dialect identification task. The listeners’ responses were consistent with the existence of two major categories, i.e. NF and SF, with a greater proportion of confusion between dialects within each category than across the two categories.
We chose to concentrate on spontaneous speech, produced in the framework of a conver-sational interaction, as opposed to the highly-controlled experimental situations often used in previous work. One potential advantage of conversational interaction, compared with a non-interactive experimental setting, relates to the fact that the speaker’s spontaneous speech patterns should emerge more freely in a conversation. However, conversational speech is notoriously difficult to analyze, and another major objective of this work was therefore to develop tools that would help us overcome these difficulties.
The first of these tools is an interactive task in which two participants engage in a collaborative game (referred to as GMUP, see below), and which leads these participants to produce a number of purpose-built names. The names were expected to be pronounced in a different way in NF compared with SF. The advantage of resorting to a collaborative game such as GMUP to study conversational speech, is that this game allows us to elicit the production of accurately controlled phonological material in an interactional situation that preserves the spontaneity of the participants’ verbal exchanges.
To analyze the data collected during GMUP games, we devised a set of techniques that made it possible to characterize in an automatic manner how words were produced by the participants. There are long-established connections between research in experimental pho-nology and phonetics, on the one hand, and automatic speech techpho-nology, on the other hand. Over the last few years, these connections have been made yet stronger, owing to the shared collection and exploitation of the considerable resources that are now available to us in the domain of spoken language (Adda-Decker, 2007; Adda-Decker and Lamel, 1999; Scharenborg, 2007). These resources have come to play a major role both for phonologists and phoneticians, who endeavor to subject their theoretical hypotheses to empirical tests using large speech corpora, and for speech technology specialists, whose interest in spoken language is increasing. While these resources were first based on audio recordings of read speech, they have been progressively extended to spontaneous speech in conversational in-teraction. Such changes are raising theoretical and methodological issues that both
phonolo-gists/phoneticians and speech technology specialists have begun to address. In the following, we will indicate how we have exploited available automatic speech recognition techniques to provide a detailed characterization of accent-specific speech patterns in conversational interaction.
2. Method
2.1. Design and aims of the game
GMUP (which stands for “Group ’em up !”) is an interactive task that we have developed to elicit extensive production of purpose-built names by two participants. GMUP takes the form of a game that involves a number of characters presented as forming a social network, whose structure has to be uncovered by the participants in an interactive manner. Each character is attributed a name by the participants who are led to pronounce it a number of times in the course of the task.
The participants are seated on either side of a table, in the middle of which a vertical screen prevents them from seeing each other. Each of the two participants uses a computer to play the game, and wears a high-quality headset microphone.
GMUP consists of two parts. In the first part, the participants are asked to jointly assign one of a pre-established list of 16 names to each of 16 characters. Characters here designate women and men whose portrait photographs are displayed on the computer screen along with a subset of proposed written names. The participants are called on to decide which name they both find the most appropriate for each character, and to do this, they have to both verbally describe the characters they refer to, and pronounce the proposed names. This first phase of the game thus allows the participants to engage in a collaboration with each other as well as to familiarize themselves with the material. In doing so, the participants create and integrate what amounts to a shared social network.
In the second part, the two participants are told that the 16 characters are divided into four groups of variable size. The task assigned to the participants is to identify these groups and determine to which of the four groups each character belongs. Information about group membership is provided by written statements available for some of the characters. The statement refers either to the character that makes it, e.g. “I have 100 pairs of shoes”, or to another character, e.g. “X only eats low-fat yoghurts” (where X is that character’s name). Participants are expected to infer the existence of a group of fashion victims and of a group of health-conscious people from the statements given here as examples. For a given character, the two participants do not have access to the same statement. Therefore, to correctly categorize the characters, the participants have to share the information that is available to each of them, and to pronounce both the characters’ names and the associated statements. There is only one way to associate characters with groups.
GMUP shares a number of characteristics with other experimental protocols devised to study speech patterns in conversational interaction (Anderson et al., 1991; Bertrand et al., 2008; Bradlow et al., 2007; Kraljic et al., 2008; Natale, 1975). Among these protocols, the most widely used is perhaps the Map Task (Anderson et al., 1991), in which speakers must collaborate verbally to reproduce on one participant’s map a route printed on the other’s, and it is to the Map Task that GMUP is the closest. There are, however, a number of important aspects that are specific to GMUP. Both participants have symmetric roles in GMUP, as opposed to the giver–receiver asymmetry in the Map Task. Pardo (2006) indeed found that talker role had an impact on the way speakers interact with each other in a Map Task, with “Giver" speakers adopting the speech patterns of their “Receiver" partner
to a greater extent than the opposite. GMUP is also designed in such a way that the final outcome, i.e. the structure of the virtual social network, progressively emerges in the course of the game as a result of a collaborative process between the two participants, whereas this outcome is established from the outset in the Map Task, in the form of the labelled geographical map assigned to the giver. In addition, participants have complementary and consistent information about the characters in GMUP, whereas informational inconsistencies are purposely introduced across participants in the Map Task. Furthermore, GMUP favors both direct and reported speech (through the reading of the characters’ statements). Yet another feature of GMUP, and perhaps the most important one, is that it allows pseudo-words with highly-controlled phonological characteristics to be produced by speakers in a conversational interaction. Because of the above properties, GMUP seems suitable for the accurate characterization of phonological and phonetic patterns, in a balanced interaction between two participants.
2.2. Material
For each game, the material was made up of a set of 16 names. These names were constructed in a way that allowed us to focus on five phonological dimensions, with respect to which there are well-known differences between SF and NF (see, among others, Carton et al., 1983; Coveney, 2001; Durand, 1990; Durand and Lyche, 2004; Eychenne, 2006; Martinet, 1945). These dimensions are the following :
1. Schwa (Schw.) : word-final schwas are expected to be realized in SF but not in NF ; in word-internal position, between two single consonants, schwas should also be realized more frequently in SF than in NF (Eychenne, 2006). Schwas are also expected to be realized more frequently in SF when they correspond to a written ‘e’ (Durand et al., 2003b).
2. Back mid vowels (Back) : back mid vowels tend to be phonetically realized as fronted vowels in NF (Boula de Mareüil et al., 2008; Coveney, 2001; Fonagy, 1989; Martinet, 1958).
3. Mid vowels in word-final syllables (Mid.) : whereas contrastive distinctions exist in NF between /e/–/E/, /ø/–/œ/ and /o/–/O/, the distribution of the mid-high and mid-low variants in SF is said to be entirely governed by a variant of the loi de position : the mid-high allophone occurs in open syllables and the mid-low allophone in closed syllables and whenever the next syllable contains a schwa (Durand, 1990).
4. Coronal stops (Cor.) : coronal stops tend to be produced as post-alveolar affricates prior to high front vowels in SF, particularly in the variety spoken in the city of Marseille (a phenomenon referred to as palatalization in Binisti and Gasquet-Cyrus, 2003). This particular realization is traditionally associated with lower class and/or migrant speakers, but is thought to be spreading to higher social classes (Trimaille, 2008).
5. Nasal vowels (Nas.) : nasal vowels in NF are said to correspond to V + N sequences in SF (Durand, 1988). NF is said to no longer distinguish between /˜E/ and / ˜œ/ (Martinet, 1945, Malécot and Lindsay, 1976, cited by Fagyal, 2006). In that variety, nasal vowels are also described as going through a chain shift, with /˜E/ → /˜A/ ; /˜A/ → /˜O/ and /˜O/ → /õ/ (Hansen, 2001).
Within each of these phonological dimensions, more specific distinctions were established depending on the position within the word, the segmental context, and the features asso-ciated with the critical segments. For example, the name Santinais included a nasal open
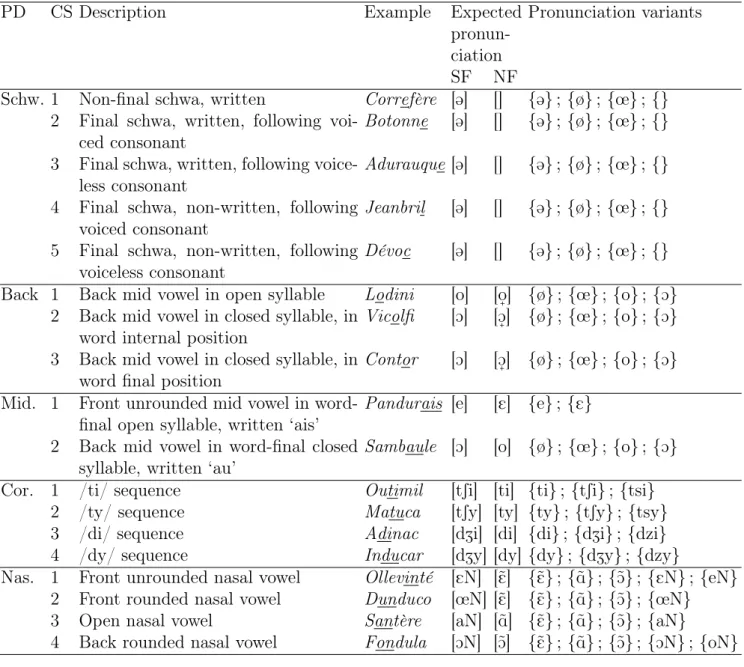
vowel, a voiceless coronal stop followed by a high front vowel, and a word-final front mid vowel, and its expected pronunciation was [s˜AtinE] in NF and [santSine] in SF. Altogether, there were on average 38 critical segments distributed across the 16 names. The complete list of critical segments is presented in Table 1.
PD CS Description Example Expected pronun-ciation
Pronunciation variants
SF NF
Schw. 1 Non-final schwa, written Correfère [@] [] {@} ; {ø} ; {œ} ; {} 2 Final schwa, written, following
voi-ced consonant
Botonne [@] [] {@} ; {ø} ; {œ} ; {}
3 Final schwa, written, following voice-less consonant
Adurauque [@] [] {@} ; {ø} ; {œ} ; {}
4 Final schwa, non-written, following voiced consonant
Jeanbril [@] [] {@} ; {ø} ; {œ} ; {}
5 Final schwa, non-written, following voiceless consonant
Dévoc [@] [] {@} ; {ø} ; {œ} ; {}
Back 1 Back mid vowel in open syllable Lodini [o] [off] {ø} ; {œ} ; {o} ; {O} 2 Back mid vowel in closed syllable, in
word internal position
Vicolfi [O] [Off] {ø} ; {œ} ; {o} ; {O} 3 Back mid vowel in closed syllable, in
word final position
Contor [O] [Off] {ø} ; {œ} ; {o} ; {O} Mid. 1 Front unrounded mid vowel in
word-final open syllable, written ‘ais’
Pandurais [e] [E] {e} ; {E}
2 Back mid vowel in word-final closed syllable, written ‘au’
Sambaule [O] [o] {ø} ; {œ} ; {o} ; {O}
Cor. 1 /ti/ sequence Outimil [tSi] [ti] {ti} ; {tSi} ; {tsi} 2 /ty/ sequence Matuca [tSy] [ty] {ty} ; {tSy} ; {tsy} 3 /di/ sequence Adinac [dZi] [di] {di} ; {dZi} ; {dzi} 4 /dy/ sequence Inducar [dZy] [dy] {dy} ; {dZy} ; {dzy}
Nas. 1 Front unrounded nasal vowel Ollevinté [EN] [˜E] {˜E} ; {˜A} ; {˜O} ; {EN} ; {eN} 2 Front rounded nasal vowel Dunduco [œN] [˜E] {˜E} ; {˜A} ; {˜O} ; {œN} 3 Open nasal vowel Santère [aN] [˜A] {˜E} ; {˜A} ; {˜O} ; {aN}
4 Back rounded nasal vowel Fondula [ON] [˜O] {˜E} ; {˜A} ; {˜O} ; {ON} ; {oN}
Table 1: Critical segments (CS) associated with the five phonological dimensions (PD). For each CS, the orthographic transcription of one carrier word is given as an example (with the underlined letters corres-ponding to the CS itself). The expected pronunciation of the CS in SF and NF, as well as the pronunciation variants used during automatic alignment, noted as acoustic model sequences between curly brackets, are also indicated. N represents a nasal consonant whose place of articulation is that of the following consonant in the word. It is replaced by [n] before [t] and [d], and by [m] before [p] and [b].
The names were automatically generated using a probabilistic grammar in the following way. First, templates were established which contained from one to three critical segments along with a number of empty slots. Complete phonological forms were then produced from these templates by means of the probabilistic grammar, which filled in the empty slots with critical segments. Template completion was performed in accordance with triphone
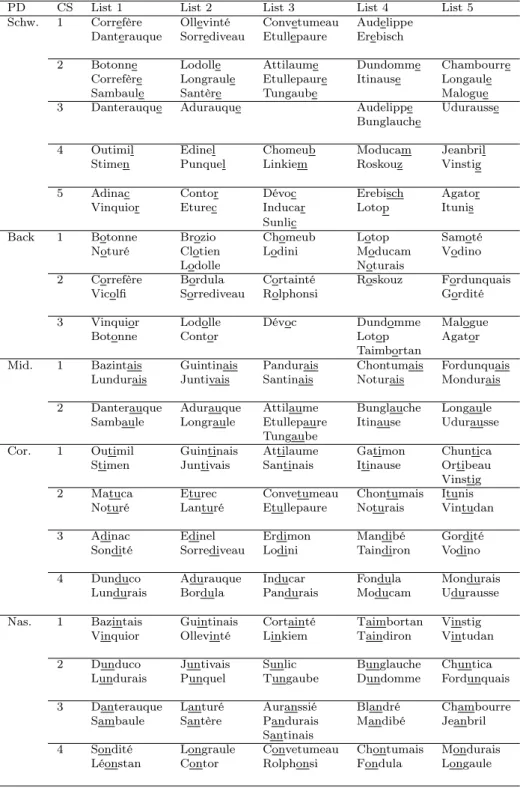
frequen-cies in French words, proper names and first names, as calculated using a variety of lexical databases (DicoLPL, VanRullen et al., 2005 ; Prénoms, New et al., 2004). These triphone frequencies were expected to reflect the phonotactics of French. For example, Santinais was generated from the template /.˜Ati.E/ where dots represent empty slots. The names had two syllables at least, and up to four syllables for those which included realized schwa(s). In spite of the fact that the templates were partially filled in with critical segments prior to being fed into the probabilistic grammar, a post hoc analysis showed that transitional probabilities between phonemes were in the upper range compared with those in our lexical databases. Finally, the resulting phonemic sequences were converted into orthographic forms, in kee-ping with the phoneme-to-grapheme rules of French. The five sets of 16 generated names are listed in the appendix.
2.3. Subjects
Our subjects were recruited in a major public high school in the center of Marseille, which we chose with the aim of getting access to a population of various social and regional backgrounds. In a first step, 41 students from seven different classes volunteered to fill in two questionnaires. The first questionnaire was established after the one used in the project Phonologie du français contemporain (PFC, Durand et al., 2003a) and its goal was to determine which regional variety of French was spoken by the student.
The second questionnaire was destined to measure the student’s social competence, by means of a French translation of the Social Desirability scale1 (Crowne and Marlowe, 1960, Marlowe and Crowne, 1961 ; social desirability refers to the need for social approval and acceptance and the belief that this can be attained by means of culturally acceptable and appropriate behaviors). We used this questionnaire to establish to what extent students were predisposed to engage in social interactions.
In a second step, 24 students were selected on the basis of their responses to the two questionnaires (20 female students and 4 male students, mean age 15.8 years, SD = 0.9). Twelve of them were speakers of NF and the other twelve speakers of SF. The speakers had a score ranging from 1.8 to 8.2 on the Social Desirability scale which extends from 0 (lowest need for social approval) to 10 (highest need for social approval). Finally, each of the NF speakers was matched with one of the SF speakers to form twelve pairs (dyads, hereafter). In a given dyad, the two subjects were of the same sex and did not know each other. They had a similar position on the Social Desirability scale (maximum absolute difference in the score between the two subjects : 1.8), and were therefore expected to interact in a balanced way.
2.4. Experimental procedure and recordings
The experiment took place in a quiet room in the high school and in the presence of the experimenter. It was divided into two sessions with a one-week interval in between. During the first session, subjects were individually recorded reading three sets of 16 names, within a carrier sentence and in a fully randomized order that was not the same for all of the subjects (pre-test).
1. The questionnaire also included the Self-Monitoring scale (Snyder, 1974, as revised by Lennox and Wolfe, 1984), but we only took the Social Desirability scale into account to select the subjects for the experiment. The French translations of the two scales were previously assessed on a different group of 82 subjects. Mean value and standard deviation for each scale were close to those obtained with the original American English versions : Social Desirability scale (original/translated) : N=120/82 ; Mean=4.16/4.77 ; SD=1.75/1.57 ; Self-Monitoring scale : N=210/82 ; Mean=6.46/6.28 ; SD=2.06/1.24.
In the second session, each pair of subjects underwent a short training phase that allowed them to get familiar with the game’s rules. They then took part in three successive games each of which involved using one of the three sets of 16 names, along with 16 photographs and the corresponding characters’ statements. On average, it took about 20 minutes for the dyads to accomplish the games. Upon completion of the third game, each of the two subjects was asked to read the 48 names mixed with another 32 names that had not been used in the games, within a carrier sentence and in a fully randomized order that was not the same for all of the subjects, as in the first session (post-test).
Subjects were digitally recorded using headset AKG C 420 condenser microphones connec-ted to a computer through an Edirol UA-25 high-quality audio interface. During the games, each subject’s speech was recorded on one of the two tracks of a stereo audio file in order for the recordings to be synchronized across subjects.
The subjects never saw each other during the entire duration of each of the two sessions. 2.5. Corpus segmentation and labelling
A word-spotting system was designed to semi-automatically locate the target names’ occurrences in the recordings. We used the HTK automatic speech recognition toolkit2 in combination with context-independent monophone acoustic models trained for French by J.-P. Goldman at the University of Geneva3, and a grammar with a vocabulary composed of the names occurring in the recording that was analyzed. We checked that no occurrence of a target name was missed and that the boundaries for each occurrence were correctly located, by means of a signal editor interacting with the word-spotting system.
In the following stage, a forced automatic alignment was performed between (a) the por-tion of speech signal associated with each produced name and (b) a pronunciapor-tion graph that represented the possible regional variants in the phonetic form of that name. These variants were established on the basis of our hypotheses and are listed in the rightmost column of Table 1. The goal of this alignment was to automatically classify the critical segments into pre-established phonetic categories associated with either the NF or SF regional varieties, and to determine the temporal boundaries of each segment in the signal (see Adda-Decker et al., 2008, and Boula de Mareüil et al., 2008, for a similar approach).
Preliminary analyses revealed inconsistencies in how word-final schwas were dealt with in the forced alignment procedure. This appeared to be due, at least in part, to the fact that the automatic aligner did not differentiate a word-final schwa from a hesitation mark or filled pause subsequent to the target name. Further work is needed to improve our alignment procedure in that respect and word-final schwas will be left aside in the remaining of this first report. We focus here on the data recorded during the three successive games for each dyad.
3. Results
We first checked that GMUP was successful in eliciting a number of repetitions for each name that was suitable for detailed phonetic analyses. On average, each name was found to be produced 4.5 times by each subject (standard deviation : 1.27). The number of tokens over the 16 available names was, on average, 89 for Game 1, 69 for Game 2, and 57 for Game 3, for each subject (there was an expected decrease in that number across games
2. URL : htk.eng.cam.ac.uk/
as subjects got increasingly familiar with the experimental situation). Table 2 contains the average number of name tokens over the three games for each of the phonological dimensions these tokens were associated with.
Phonological dimension N Word-internal schwas (Schw.) 26 Back mid vowels (Back) 78 Mid vowels in word-final syllables (Mid.) 57 Coronal stops (Cor.) 108 Nasal vowels (Nas.) 108
Table 2: Average number of name tokens associated with each phonological dimension over the three games for each speaker.
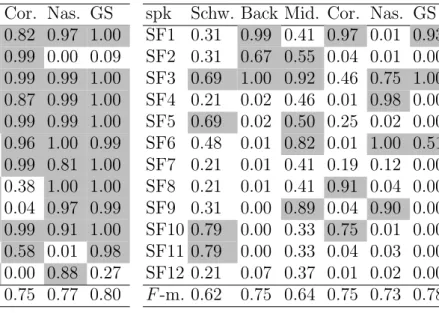
We then sought to determine to what extent it was possible to distinguish the NF speakers from the SF speakers from the data. To do this, we applied a naive Bayes classifier to the phonetic transcriptions automatically established for each name token. Classification was performed for each critical segment separately, e.g. all the occurrences of word-internal schwa. The classifier underwent a supervised training procedure that consisted in learning the mapping between the phonetic transcriptions, on the one hand, and the speakers’ native accent (as established from the questionnaire, see Section 2.3), on the other hand. For each speaker, a classifier was devised which was trained on the data available from all the other speakers, and was then tested on that speaker (cross-validation procedure). The predicted group membership is associated with a confidence level, referred to as normalized probability hereafter. One advantage of using a classification procedure such as a naive Bayes Classifier as opposed to a simple count of phonetic realizations is that it allows the system to handle more than one pronunciation variant per critical segment, and to combine information gathered across multiple critical segments to yield a global normalized probability. The overall performance of each of the 24 speaker-dependent classifiers is indicated in Table 3.
Sp. Schw. Back Mid. Cor. Nas. GS spk Schw. Back Mid. Cor. Nas. GS NF1 0.12 0.87 0.76 0.82 0.97 1.00 SF1 0.31 0.99 0.41 0.97 0.01 0.93 NF2 0.20 0.27 0.73 0.99 0.00 0.09 SF2 0.31 0.67 0.55 0.04 0.01 0.00 NF3 0.37 0.94 0.80 0.99 0.99 1.00 SF3 0.69 1.00 0.92 0.46 0.75 1.00 NF4 0.69 0.99 0.76 0.87 0.99 1.00 SF4 0.21 0.02 0.46 0.01 0.98 0.00 NF5 0.34 0.22 0.66 0.99 0.99 1.00 SF5 0.69 0.02 0.50 0.25 0.02 0.00 NF6 0.12 0.29 0.22 0.96 1.00 0.99 SF6 0.48 0.01 0.82 0.01 1.00 0.51 NF7 0.69 0.97 0.25 0.99 0.81 1.00 SF7 0.21 0.01 0.41 0.19 0.12 0.00 NF8 0.69 0.99 0.66 0.38 1.00 1.00 SF8 0.21 0.01 0.41 0.91 0.04 0.00 NF9 0.69 0.92 0.69 0.04 0.97 0.99 SF9 0.31 0.00 0.89 0.04 0.90 0.00 NF10 0.55 1.00 0.82 0.99 0.91 1.00 SF10 0.79 0.00 0.33 0.75 0.01 0.00 NF11 0.69 1.00 0.36 0.58 0.01 0.98 SF11 0.79 0.00 0.33 0.04 0.03 0.00 NF12 0.34 0.92 0.82 0.00 0.88 0.27 SF12 0.21 0.07 0.37 0.01 0.02 0.00 F -m. 0.55 0.75 0.69 0.75 0.77 0.80 F -m. 0.62 0.75 0.64 0.75 0.73 0.78
Table 3: Normalized probabilities for each speaker to be categorized as an NF speaker, as computed using the Bayes classifier. Grey cells contain values above 0.5.
For each of the five phonological dimensions, Table 3 gives the normalized probability for each subject to be categorized as an NF speaker, as computed over all the relevant segments, according to the following formula :
Pj = Πni=1(Pi)/(Πi=1n (Pi) + Πni=1(1 − Pi))
where Pj is the normalized probability for the jth phonological dimension, Pi refers to
the probability that critical segment i was produced by an NF speaker, and n is the number of segments. The classifier’s global score (GS) was computed from the five probability values using the formula :
GS = Πmj=1(Pj)/(Πmj=1(Pj) + Πmj=1(1 − Pj)), m = 1, ..., 5
A good indicator of the overall performance of the classification procedure is given by the F -measure4, which was calculated from the confusion matrix between the predicted and observed categories across the 24 speakers for each of the two speaker groups. The F -measure was 0.80 for the NF speakers and 0.78 for the SF speakers.
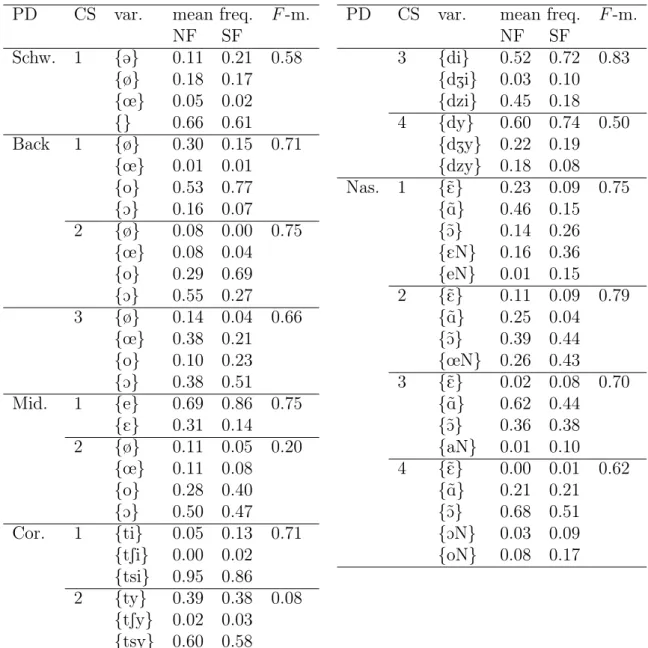
For each phonological dimension and each critical segment, we examined which of the phonetic variants in the aligner’s pronunciation dictionary was more frequently associated with the NF speaker group, and which was more frequently associated with the SF speaker group. For example, the distinction made by the classifier between the two speaker groups on the basis of word-final mid vowels, proved to be due to the higher number of open-mid /E/ (as opposed to close-mid /e/) in that position for NF speakers than for SF speakers. Table 4 presents the average frequencies of alignment of each critical segment with the pronunciation variants for NF and SF speakers, along with associated mean F -measures given by classification.
The phonological dimensions with respect to which NF speakers appeared to differ to the greatest extent from SF speakers were back mid vowel fronting, coronal stop affrication, and nasal vowels (mean F -measures of 0.75 in Table 3). In general, the observed tendencies were consistent with how the NF and SF varieties are usually characterized at the pho-nological/phonetic level (see Table 1). The back mid vowel tended to be categorized by the automatic aligner as fronted in NF speakers (33%) but much less frequently so in SF speakers (15%). As regards coronal stops, examination of the phonetic variants found by the aligner to best match the speech signal, along with complementary acoustic analyses, revealed that SF speakers tended to produce /d/ either as a voiced dental stop or as a voiced post-alveolar affricate in the context of /i/. In the NF speakers’ realization of that sequence, a short segment of friction noise associated with an alveolar place of articulation was often observed between the burst for /d/ and the following vowel (alveolar friction, NF : 45%, SF : 18%). Differences between the two speaker groups were more reduced for the other types of coronal stop + high vowel sequence. Finally, phonological nasal vowels were in most cases realized as phonetically nasal vowels by NF speakers (87%), but less frequently so by SF speakers (68%), whose phonetic patterns included V+N sequences.
Word-internal schwas between two consonants are known both to be generally less frequent in NF speakers than in SF speakers, and to show an important amount of va-riability in their rate of realization within the NF variety (e.g., Racine, 2008), and this was
4. The F -measure ranges from 0 (worst result) to 1 (perfect categorization), 0.5 corresponding to the chance level (Van Rijsbergen, 1979).
PD CS var. mean freq. F -m. PD CS var. mean freq. F -m. NF SF NF SF Schw. 1 {@} 0.11 0.21 0.58 3 {di} 0.52 0.72 0.83 {ø} 0.18 0.17 {dZi} 0.03 0.10 {œ} 0.05 0.02 {dzi} 0.45 0.18 {} 0.66 0.61 4 {dy} 0.60 0.74 0.50 Back 1 {ø} 0.30 0.15 0.71 {dZy} 0.22 0.19 {œ} 0.01 0.01 {dzy} 0.18 0.08 {o} 0.53 0.77 Nas. 1 {˜E} 0.23 0.09 0.75 {O} 0.16 0.07 {˜A} 0.46 0.15 2 {ø} 0.08 0.00 0.75 {˜O} 0.14 0.26 {œ} 0.08 0.04 {EN} 0.16 0.36 {o} 0.29 0.69 {eN} 0.01 0.15 {O} 0.55 0.27 2 {˜E} 0.11 0.09 0.79 3 {ø} 0.14 0.04 0.66 {˜A} 0.25 0.04 {œ} 0.38 0.21 {˜O} 0.39 0.44 {o} 0.10 0.23 {œN} 0.26 0.43 {O} 0.38 0.51 3 {˜E} 0.02 0.08 0.70 Mid. 1 {e} 0.69 0.86 0.75 {˜A} 0.62 0.44 {E} 0.31 0.14 {˜O} 0.36 0.38 2 {ø} 0.11 0.05 0.20 {aN} 0.01 0.10 {œ} 0.11 0.08 4 {˜E} 0.00 0.01 0.62 {o} 0.28 0.40 {˜A} 0.21 0.21 {O} 0.50 0.47 {˜O} 0.68 0.51 Cor. 1 {ti} 0.05 0.13 0.71 {ON} 0.03 0.09 {tSi} 0.00 0.02 {oN} 0.08 0.17 {tsi} 0.95 0.86
2 {ty} 0.39 0.38 0.08 {tSy} 0.02 0.03 {tsy} 0.60 0.58
Table 4: Mean frequencies of the aligner’s choice of pronunciation variant for each critical segment (CS) associated with each phonological dimension (PD), for NF and SF speakers. The average F -measure for each critical segment is given in the rightmost column.
confirmed in our analyses (66% of elision for NF speakers vs. 61% for SF speakers). In ad-dition, our data suggest that variability in the realization of word-internal schwas extends to the SF variety, since 4 out of 12 SF speakers tended not to produce those schwas. As indicated above, the distribution of the front mid vowels in word-final position conformed with our expectations, with a greater number of /E/ in NF speakers (31%) compared with SF speakers (14%). For the back mid vowel, however, the aligner more frequently selected the open-mid variant (50%) than the close-mid variant (28%) for the NF speakers, whereas this pattern was less marked for the SF speakers (open-mid : 47% ; close-mid : 40%).
One important issue is to what extent the words’ phonetic realizations for one spea-ker tended to mirror those of the other speaspea-ker during the interaction. Pardo (2006) found that perceived similarity in pronunciation between speakers increased over the course of a conversation, for a preselected set of words. To address this issue, we trained the classi-fier and evaluated its performance independently for each of the three successive games. Our assumption was that performance should decrease across the games, should phonetic convergence occur between the two speakers. The results showed that performance remained stable throughout the games. The mean F -measure was 0.79 (19 speakers correctly classified out of 24) for both Game 1 and Game 2, and 0.83 (20 speakers correctly classified) for Game 3. Although they do not preclude the possibility that phonetic convergence effects took place across the games, our results suggest that such effects were not large enough for the classifier to shift one speaker into the other speaker’s group in the course of the interaction.
Yet another possibility is that convergence effects occurred from the very outset of the interaction, as in Delvaux and Soquet’s (2007) experiment. To check this possibility, classifi-cation was also performed on the data recorded in the pre-test. Early convergence effects in the interaction should be characterized by a decrease in the classifier’s performance between the pre-test and the first game. However, we observed the opposite tendency, i.e. classification scores were lower for the pre-test relative to the first game. Examination of the alignments onto phonetic variants for each speaker group revealed that the reading task used in the pre-test may have had a confounding influence on how the names were produced, at least for a subset of the phonological dimensions. For example, both speakers in each dyad tended to produce more internal schwas during the pre-test (53 %) compared with the interaction (37 %).
As shown by Table 3, two NF speakers (NF2, NF12) and three SF speakers (SF1, SF3, SF6) were misclassified. Detailed examination of the phonetic labelling performed by the aligner suggests that these speakers displayed characteristics associated with both the NF and the SF variety. For NF2, the most frequent pronunciation variant chosen by the aligner was an alveolar realization of the coronal stop (consistent with our characterization of the NF accent) but a V + N sequence for nasal vowels (consistent with our characterization of the SF accent). For speaker NF12, the automatic phonetic labelling was in general agreement with the pre-established NF pronunciation, but strongly departed from it for the realization of the coronal stop, which was categorized as post-alveolar. Speaker SF1’s nasal vowels were processed as being typical of the SF variety, but her back mid vowels were associated with a fronted realization, and her coronal stops with an alveolar realization. SF3 was found to produce NF variants for all of the phonological dimensions except coronal stops. Speaker SF6’s pronounced word forms were categorized as being halfway between the NF variety (nasal vowels, distribution of word-final mid vowels) and the SF variety (back mid vowel, coronal stop).
4. Discussion and conclusion
In this study, we recorded 12 dyads formed by one NF speaker and one SF speaker during an interactive game, in which speakers had to repeatedly produce names designed according to a number of phonological criteria. The conversational speech data were submitted to an automatic alignment procedure in which a forced choice was performed within a pre-established set of phonetic realizations usually associated either with the NF or the SF variety of French. A naive Bayes classifier applied to the identified phonetic forms was able to determine whether speakers were in the NF or the SF group with a correct recognition score of 79%. Differences between the two speaker groups were observed for each of the five phonological dimensions with respect to which names were constructed, although they were greater for three of these dimensions.
In a large-scale investigation on the automatic characterization of regional accents of French, Boula de Mareüil et al. (2008) found that the phonetic characteristic that best allows contemporary NF and SF to be differentiated from each other is the fronting of the back mid vowels in NF. While our results were globally consistent with this finding, we observed that back mid vowel fronting in NF was dependent on the position of the carrier syllable in the word. In closed syllables, the vowel associated with the grapheme o was indeed found to be more frequently fronted in NF than in SF, but to a greater extent when the syllable was in word-final position (NF : 52%, SF : 25%) than in non-final position (NF : 16%, SF : 4%).
Another significant result that emerged from our study relates to the realization of co-ronal stops prior to a high front vowel in SF. Previous investigations often mentioned the palatalization that coronal stops are said to undergo in sequences such as tu as [tja] “you have” in SF. The phenomenon we have identified more specifically occurred in /di/ sequences, where /d/ was realized as either a voiced dental stop or a voiced post-alveolar affricate [dZ]. In the latter case, this realization can be more accurately characterized as affrication rather than palatalization. In NF, the phonetic variant that was most frequently associated with a coronal stop by the aligner was an alveolar affricate. Crucially, the /di/ sequence provi-ded the most important single contribution to differentiating the two accents in the Bayes classifier. To our knowledge, the fact that the phonetic realization of this sequence is such a strong regional marker appears to have been little noticed in the sociophonetic literature so far.
The overall good performance of the accent classification procedure sheds an interes-ting light on the sociolinguistic factors that may have an influence on the speakers’ speech patterns. In that respect, it is important to note that a majority of our NF speakers were born in Marseille, and that most of them had lived there for at least 10 years. In spite of this, these speakers were found to produce names with most of the phonological and pho-netic characteristics associated with standard NF. Such characteristics included an /e/–/E/ contrast in word-final position, even though these two vowels are considered as being in the process of merging together in young Parisian NF speakers (Fagyal et al., 2002). One potential explanation is that in addition to long-term exposure to another regional variety, the speakers’ speech patterns are conditioned by other factors such as identification to the social group that the speakers’ native variety may embody. This may be all the more true for our NF speakers, given the fact that the NF variety is often regarded as having a higher social status than the SF variety.
Another major focus of interest in the present study concerns the changes that may have occurred in the speakers’ speech patterns in the course of the interaction with their
partner. Although there clearly was a distinction between the two speaker groups in how the names were produced, this did not preclude mutual influence between speakers, particularly in the framework of a game such as GMUP, which requires tight collaboration as well as successful transfer of information through speech. Phonetic imitation of a non-native variety of the speaker’s language has been recently observed in French by Delvaux and Soquet (2007). In this work, we set to identify potential convergence effects by looking at the classifier’s performance across the three successive games. We reasoned that a greater number of cases of a speaker being incorrectly associated with the other speaker’s group, as the interaction develops, could be ascribed to a convergence effect between speakers. Our results did not reveal such a tendency, since there was no substantial change in the classifier’s performance over the three games. There is a possibility, however, that convergence effects took place at a more fine-grained, subcategorical level, which the forced-choice alignment of the speech signal onto phonetic categories did not allow to capture. It may also be the case that convergence occurred from the very beginning of the first game, and this would be consistent with Delvaux and Soquet (2007) findings, although their study was conducted in a non-interactional setting. In such a scenario, the classification scores would be expected to be higher for the pre-test compared with the first game. However, our analyses revealed that it was the reverse that was true. The lower classification scores for the pre-test may be attributable, at least in part, to the reading task used in that pre-test. A better way to identify early convergence effects across accents would be to record each speaker during an interaction with a same-accent partner in a preliminary phase. Further investigations are needed to determine whether phonetic convergence occurred at the very outset of the interaction, or at a fine-grained level, or both.
Acknowledgments
This work was supported by a Ph.D. scholarship awarded to the first author by the Région Provence-Alpes-Côte d’Azur, and by the project ANR-08-BLAN-0276-01. We are grateful to Stéphane Rauzy for statistical advice and to the staff and students of the lycée Thiers, Marseille, for their kind participation. We also thank two anonymous reviewers for helpful comments.
Appendix See Table .5.
PD CS List 1 List 2 List 3 List 4 List 5 Schw. 1 Correfère Ollevinté Convetumeau Audelippe
Danterauque Sorrediveau Etullepaure Erebisch
2 Botonne Lodolle Attilaume Dundomme Chambourre Correfère Longraule Etullepaure Itinause Longaule Sambaule Santère Tungaube Malogue 3 Danterauque Adurauque Audelippe Udurausse
Bunglauche
4 Outimil Edinel Chomeub Moducam Jeanbril Stimen Punquel Linkiem Roskouz Vinstig 5 Adinac Contor Dévoc Erebisch Agator Vinquior Eturec Inducar Lotop Itunis
Sunlic
Back 1 Botonne Brozio Chomeub Lotop Samoté Noturé Clotien Lodini Moducam Vodino
Lodolle Noturais
2 Correfère Bordula Cortainté Roskouz Fordunquais Vicolfi Sorrediveau Rolphonsi Gordité 3 Vinquior Lodolle Dévoc Dundomme Malogue
Botonne Contor Lotop Agator
Taimbortan
Mid. 1 Bazintais Guintinais Pandurais Chontumais Fordunquais Lundurais Juntivais Santinais Noturais Mondurais 2 Danterauque Adurauque Attilaume Bunglauche Longaule
Sambaule Longraule Etullepaure Itinause Udurausse Tungaube
Cor. 1 Outimil Guintinais Attilaume Gatimon Chuntica Stimen Juntivais Santinais Itinause Ortibeau Vinstig 2 Matuca Eturec Convetumeau Chontumais Itunis
Noturé Lanturé Etullepaure Noturais Vintudan 3 Adinac Edinel Erdimon Mandibé Gordité
Sondité Sorrediveau Lodini Taindiron Vodino 4 Dunduco Adurauque Inducar Fondula Mondurais
Lundurais Bordula Pandurais Moducam Udurausse Nas. 1 Bazintais Guintinais Cortainté Taimbortan Vinstig
Vinquior Ollevinté Linkiem Taindiron Vintudan 2 Dunduco Juntivais Sunlic Bunglauche Chuntica
Lundurais Punquel Tungaube Dundomme Fordunquais 3 Danterauque Lanturé Auranssié Blandré Chambourre
Sambaule Santère Pandurais Mandibé Jeanbril Santinais
4 Sondité Longraule Convetumeau Chontumais Mondurais Léonstan Contor Rolphonsi Fondula Longaule
Table .5: Five lists of generated names. Each list consists of 16 different names. When a name contains several critical segments, it appears as many times in a column. The written form of the critical segment is underlined. Its expected pronunciations in SF and NF are given in Table 1.
References
Adda-Decker, M., 2007. Corpus pour la transcription automatique de l’oral. Revue française de linguistique appliquée XII (1), 71–84.
Adda-Decker, M., Gendrot, C., Nguyen, N., 2008. Contributions du traitement automatique de la parole à l’étude des voyelles orales du français. Traitement Automatique des Langues 49 (3), 13–46.
Adda-Decker, M., Lamel, L., 1999. Pronunciation variants across system configuration, language and spea-king style. Speech Communication 29 (2), 83–98.
Anderson, A. H., Bader, M., Bard, E. G., Boyle, E., Doherty, G., Garrod, S., Isard, S., Kowtko, J., McAllister, J., Miller, J., Sotillo, C., Thomson, H. S., Weinert, R., 1991. The HCRC Map Task corpus. Language and Speech 34 (4), 351–366.
Bertrand, R., Blache, P., Espesser, R., Ferré, G., Meunier, C., Priego-Valverde, B., Rauzy, S., 2008. Le CID – Corpus of Interactional Data : Annotation et exploitation multimodale de parole conversationnelle. Traitement Automatique des Langues 49 (3), 105–134.
Binisti, N., Gasquet-Cyrus, M., 2003. Les accents de Marseille. Cahiers du français contemporain 8, 107–129. Boula de Mareüil, P., Vieru-Dimulescu, B., Woehrling, C., Adda-Decker, M., 2008. Accents étrangers et régionaux en français : Caractérisation et identification. Traitement Automatique des Langues 49 (3), 135–163.
Bradlow, A. R., Baker, R., Choi, A., Kim, M., Van Engen, K. J., 2007. The Wildcat corpus of native- and foreign-accented English. Journal of the Acoustical Society of America 121 (5, Pt. 2), 3072.
Brunellière, A., Dufour, S., Nguyen, N., Frauenfelder, U. H., 2009. Behavioral and electrophysiological evi-dence for the impact of regional variation on phoneme perception. Cognition 111 (3), 390–396.
Carton, F., Rossi, M., Autesserre, D., Léon, P., 1983. Les accents des Français. Hachette, Paris.
Clopper, C. G., Bradlow, A. R., 2008. Perception of dialect variation in noise : Intelligibility and classification. Language and Speech 51 (3), 175–198.
Conrey, B., Potts, G. F., Niedzielski, N. A., 2005. Effects of dialect on merger perception : ERP and beha-vioral correlates. Brain and Language 95, 435–449.
Coveney, A., 2001. The Sounds of Contemporary French : Articulation and Diversity. Elm Bank Publications, Exeter, UK.
Crowne, D. P., Marlowe, D., 1960. A new scale of social desirability independent of psychopathology. Journal of Consulting Psychology 24, 349–354.
Cutler, A., Smits, R., Cooper, N., 2005. Vowel perception : Effects of non-native language vs. non-native dialect. Speech Communication 47 (1-2), 32–42.
Delvaux, V., Soquet, A., 2007. The influence of ambient speech on adult speech productions through unin-tentional imitation. Phonetica 64 (2-3), 145–173.
Dufour, S., Nguyen, N., Frauenfelder, U. H., 2007. The perception of phonemic contrasts in a non-native dialect. Journal of the Acoustical Society of America Express Letters 121, 131–136.
Durand, J., 1988. Les phénomènes de nasalité en français du Midi : phonologie de dépendance et sous-spécification. Recherches Linguistiques de Vincennes 17, 29–54.
Durand, J., 1990. Generative and Non-Linear Phonology. Longman, London.
Durand, J., Laks, B., Lyche, C., 2003a. Le projet « Phonologie du français contemporain (PFC) ». La Tribune Internationale des Langues Vivantes 33, 3–9.
Durand, J., Laks, B., Lyche, C., 2003b. Linguistique et variation : quelques réflexions sur la variation phonologique. In : Delais-Roussarie, E., Durand, J. (Eds.), Corpus et variation en phonologie du français : méthodes et analyses. Presses Universitaires du Mirail, Toulouse, pp. 11–88.
Durand, J., Lyche, C., 2004. Structure et variation dans quelques systèmes vocaliques du français : l’en-quête Phonologie du français contemporain (PFC). In : Coveney, A., Sanders, C. (Eds.), Variation et Francophonie. L’Harmattan, Paris, pp. 217–240.
Evans, B. G., Iverson, P., 2004. Vowel normalization for accent : An investigation of perceptual plasticity in young adults. Journal of the Acoustical Society of America 115, 352–361.
Eychenne, J., 2006. Aspects de la phonologie du schwa dans le français contemporain. PhD dissertation, Université de Toulouse-Le Mirail.
Fagyal, Z., 2006. Phonetics and phonology. In : Fagyal, Z., Kibbee, D., Jenkins, F. (Eds.), French : A Linguistic Introduction. Cambridge University Press, Cambridge, pp. 17–78.
Fagyal, Z., Hassa, S., Ngom, F., 2002. L’opposition [e]-[E] en syllabes ouvertes de fin de mot en français parisien : étude acoustique préliminaire. Proceedings of the XXIVèmes Journées d’Etudes sur la Parole, Nancy, France, 24-27 June 2002, 165–168.
Floccia, C., Goslin, J., Girard, F., Konopczynski, G., 2006. Does a regional accent perturb speech processing ? Journal of Experimental Psychology : Human Perception and Performance 32 (5), 1276–1293.
Fonagy, I., 1989. Le français change de visage ? Revue Romane 24, 225–254.
Hansen, A. B., 2001. Les changements actuels des voyelles nasales du français parisien : confusions ou changements en chaîne ? La Linguistique 37 (2), 33–47.
Hay, J., Nolan, A., Drager, K., 2006. From fush to feesh : Exemplar priming in speech perception. The Linguistic Review 23 (3), 351–379.
Kraljic, T., Brennan, S., Samuel, A., 2008. Accommodating variation : Dialects, idiolects, and speech pro-cessing. Cognition 107 (1), 54–81.
Lennox, R. D., Wolfe, R. N., 1984. Revision of the self-monitoring scale. Journal of Personality and Social Psychology 46 (6), 1349–1364.
Malécot, A., Lindsay, P., 1976. The neutralization of /˜E/ – / ˜œ/ in French. Phonetica 33, 45–61.
Marlowe, D., Crowne, D. P., 1961. Social desirability and responses to perceived situational demands. Journal of Consulting Psychology 25, 100–115.
Martinet, A., 1945. La Prononciation du Français Contemporain, 2nd Edition. Droz, Geneva. Martinet, A., 1958. « C’est jeuli, le Mareuc ! ». Romance Philology 11, 345–355.
Natale, M., 1975. Convergence of mean vocal intensity in dyadic communication as a function of social desirability. Journal of Personality and Social Psychology 32 (5), 790–804.
New, B., Pallier, C., Brysbaert, M., Ferrand, L., 2004. Lexique 2 : A new French lexical database. Behavior Research Methods, Instruments, & Computers 36 (3), 516–524.
Pardo, J. S., 2006. On phonetic convergence during conversational interaction. Journal of the Acoustical Society of America 119, 2382–2393.
Racine, I., 2008. Les effets de l’effacement du schwa sur la production de la parole en français. PhD disser-tation, Université de Genève.
Scharenborg, O., 2007. Reaching over the gap : A review of efforts to link human and automatic speech recognition research. Speech Communication 49, 336–347.
Snyder, M., 1974. Self-monitoring of expressive behavior. Journal of Personality and Social Psychology 30 (4), 526–537.
Sumner, M., Samuel, A. G., 2009. The effect of experience on the perception and representation of dialect variants. Journal of Memory and Language 60, 487–501.
Trimaille, C., 2008. Consonnes dentales palatalisées/affriquées en français contemporain : indicateurs, mar-queurs et/ou variantes en développement ? AFLS Conference, Oxford, 3-5 September.
Van Rijsbergen, C. J., 1979. Information Retrieval, 2nd Edition. Butterworths, London.
VanRullen, T., Blache, P., Portes, C., Rauzy, S., Maeyhieux, J., Guénot, M., Balfourier, J., Bellengier, E., 2005. Une plateforme pour l’acquisition, la maintenance et la validation de ressources lexicales. Procee-dings of Traitement Automatique des Langues Naturelles 2005, Dourdan, France, 6-10 June 2005. Woehrling, C., 2009. Accents régionaux en français : Perception, analyse et modélisation à partir de grands