Publisher’s version / Version de l'éditeur:
FEMS Microbiology Ecology, 2016-7-06
READ THESE TERMS AND CONDITIONS CAREFULLY BEFORE USING THIS WEBSITE.
https://nrc-publications.canada.ca/eng/copyright
Vous avez des questions? Nous pouvons vous aider. Pour communiquer directement avec un auteur, consultez la
première page de la revue dans laquelle son article a été publié afin de trouver ses coordonnées. Si vous n’arrivez pas à les repérer, communiquez avec nous à PublicationsArchive-ArchivesPublications@nrc-cnrc.gc.ca.
Questions? Contact the NRC Publications Archive team at
PublicationsArchive-ArchivesPublications@nrc-cnrc.gc.ca. If you wish to email the authors directly, please see the first page of the publication for their contact information.
NRC Publications Archive
Archives des publications du CNRC
This publication could be one of several versions: author’s original, accepted manuscript or the publisher’s version. / La version de cette publication peut être l’une des suivantes : la version prépublication de l’auteur, la version acceptée du manuscrit ou la version de l’éditeur.
For the publisher’s version, please access the DOI link below./ Pour consulter la version de l’éditeur, utilisez le lien DOI ci-dessous.
https://doi.org/10.1093/femsec/fiw130
Access and use of this website and the material on it are subject to the Terms and Conditions set forth at
Hydrocarbon biodegradation by Arctic sea-ice and sub-ice microbial communities during microcosm experiments, Northwest Passage (Nunavut, Canada)
Garneau, Marie-Ève; Michel, Christine; Meisterhans, Guillaume; Fortin, Nathalie; King, Thomas L.; Greer, Charles W.; Lee, Kenneth
https://publications-cnrc.canada.ca/fra/droits
L’accès à ce site Web et l’utilisation de son contenu sont assujettis aux conditions présentées dans le site LISEZ CES CONDITIONS ATTENTIVEMENT AVANT D’UTILISER CE SITE WEB.
NRC Publications Record / Notice d'Archives des publications de CNRC:
https://nrc-publications.canada.ca/eng/view/object/?id=7c0aa52f-edde-4536-bc0b-f3df34a692ee https://publications-cnrc.canada.ca/fra/voir/objet/?id=7c0aa52f-edde-4536-bc0b-f3df34a692ee
1 Hydrocarbon biodegradation by Arctic sea-ice and sub-ice microbial communities during microcosm experiments, Northwest Passage (Nunavut, Canada)
Marie-Ève Garneau1*, Christine Michel1, Guillaume Meisterhans1, Nathalie Fortin2, Thomas L. King3, Charles W. Greer2 and Kenneth Lee4
1 Fisheries and Oceans Canada, Marine Productivity Laboratory, 501 University Crescent,
Winnipeg, MB, Canada, R3T 2N6
2 Energy, Mining and Environment, National Research Council of Canada, 6100 Royalmount
Avenue, Montréal, QC, Canada, H4P 2R2
3 Fisheries and Oceans Canada, Bedford Institute of Oceanography, PO Box 1006, Dartmouth, NS,
B2Y 4A2, Canada
4 Oceans and Atmosphere National Research Flagship, Australian Resources Research Centre,
CSIRO, 26 Dick Perry Avenue, Kensington, WA 6151, Australia *Corresponding author. Email address: me.garneau@gmail.com
Running title: Hydrocarbon biodegradation by ice-associated microbes
In revision for FEMS Microbiol Ecol
by guest on July 7, 2016
http://femsec.oxfordjournals.org/
Abstract
The increasing accessibility to navigation and offshore oil exploration brings risks of hydrocarbon releases in Arctic waters. Bioremediation of hydrocarbons is a promising mitigation strategy but challenges remain, particularly due to low microbial metabolic rates in cold, ice-covered seas. Hydrocarbon degradation potential of ice-associated microbes collected from the Northwest Passage was investigated. Microcosm incubations were run for 15 days at -1.7°C with and without oil to determine the effects of hydrocarbon exposure on microbial abundance, diversity and activity, and to estimate component-specific hydrocarbon loss. Diversity was assessed with automated ribosomal intergenic spacer analysis and ion torrent 16S rRNA gene sequencing. Bacterial activity was measured by 3H-leucine uptake rates. After incubation, sub-ice and sea-ice communities degraded 94% and 48% of the initial hydrocarbons, respectively. Hydrocarbon exposure changed the composition of sea-ice and sub-ice communities; in sea-ice microcosms, Bacteroidetes (mainly
Polaribacter) dominated whereas in sub-ice microcosms, Epsilonproteobacteria contribution
increased, but that of Alphaproteobacteria and Bacteroidetes decreased. Sequencing data revealed a decline in diversity and increases in Colwellia and Moritella in oil-treated microcosms. Low
concentration of dissolved organic matter (DOM) in sub-ice seawater may explain higher
hydrocarbon degradation when compared to sea ice, where DOM was abundant and composed of labile exopolysaccharides.
Keywords
Arctic; Sea ice; Hydrocarbon biodegradation; Bioremediation; 16S ribosomal RNA gene sequencing; Microbial community fingerprinting
by guest on July 7, 2016
http://femsec.oxfordjournals.org/
Introduction
The warming of the Arctic drives an accelerated decline in sea-ice cover extent and duration, which opens navigation routes and improves access to natural resources (Meier et al. 2014; Kwok & Cunningham 2015). Extensive offshore oil and gas activities have been taking place in the Arctic since the 1940s (AMAP 2010), but increased accessibility made possible by a longer open water season has created new opportunities for the petroleum industry (AMAP 2012; Meier et
al. 2014). Higher risks of accidental hydrocarbon releases in the Arctic, either as oil spills or
discharges from ships, are anticipated. One of the major transportation routes, the Northwest Passage in the Canadian Arctic Archipelago, has seen an increase in vessel transits in recent years (AMAP 2012; Michel 2013), thereby making the area particularly vulnerable to accidental leaks of hydrocarbons. Hydrocarbon pollution poses a major threat to Arctic marine ecosystems, particularly to the survival of seabirds and marine mammals (Meltofte et al. 2013). Oil may persist in the Arctic marine environment longer than in southern regions in part because of the challenges associated with oil spill clean up in ice-infested waters (Meltofte et al. 2013).
While mechanical and chemical methods used to remove hydrocarbons from contaminated sites have limited effectiveness and can be expensive, microbial degradation of hydrocarbons appears as a non-invasive and relatively cost-effective bioremediation technique (Das & Chandran 2011). This natural process is responsible for the removal of the last traces of oil along polluted shores (ITOPF 2011). In marine environments, oil biodegradation is mostly attributable to bacteria, with an efficiency ranging from 0.003 to 100%, whereas degradation by fungi and algae (Das & Chandran 2011) and archaea (Brakstad & Bonaunet 2006) are considered negligible. Hydrocarbon-degrading bacteria exist in very low abundance (usually less than 1%) in the world’s marine environments (Atlas & Cerniglia 1995), but may reach 10% of the total bacterial population in contaminated sites, especially where the pollution is chronic such as in harbors (Hassanshahian & Cappello 2013). The complete degradation of hydrocarbon components requires a large consortium
by guest on July 7, 2016
http://femsec.oxfordjournals.org/
of indigenous bacteria with overall broad enzymatic capabilities (Leahy & Colwell 1990) and the presence of microorganisms possessing adequate metabolic potential (Das & Chandran 2011).
Rates of biodegradation depend on oil characteristics, temperature, and the availability of oxygen and nutrients (mainly nitrogen in marine systems) (ITOPF 2011; Das & Chandran 2011). Temperature also directly affects oil contaminant solubility and viscosity, with degradation efficiency decreasing at low temperatures (Atlas 1981; Das & Chandran 2011). Nonetheless, cold-adapted bacteria that possess hydrocarbon-degrading genes have been found in Arctic soils (Whyte
et al. 1999; Yergeau et al. 2012) and seawater (McFarlin et al. 2014). Sea ice is another distinctive
Arctic ecosystem, characterized by very cold temperature and high brine content, and yet it harbors abundant and diverse microbial assemblages thriving in several distinct microhabitats (Bowman et
al. 2012). Some studies have addressed the hydrocarbon degradation potential of ice-associated
microbes (Atlas et al. 1978; Gerdes et al. 2005; Deppe et al. 2005; Brakstad et al. 2008), but overall this area of research is rather unexplored, especially regarding first-year sea ice. The identification of key oil-degrading microorganisms that live in and below the sea ice is essential for the
development of bioremediation strategies suitable for the ice-covered Arctic Ocean.
The Canadian Arctic Archipelago is a region of high biological production that supports large populations of seabirds and marine mammals (McLaughlin et al. 2004; Michel et al. 2006). Bottom ice maintains the highest ice-algal biomass reported for the Arctic (Arrigo et al. 2010) and contains elevated sea-ice bacterial abundances (Smith et al. 1989; Maranger et al. 1994). We studied the potential for hydrocarbon degradation of natural microbial communities thriving in first-year sea ice and sub-ice seawater, in the eastern part of the Northwest Passage during spring 2012. The objectives were to evaluate (i) the diversity of bacterial communities and the presence of oil-degrading taxa; (ii) the hydrocarbon degradation potential, including preferential degradation of certain components; and (iii) changes in communities induced by hydrocarbon exposure in terms of abundance, activity and diversity. We hypothesized that (i) the hydrocarbon degradation rates would be different in sea ice and sub-ice seawater because of variations in microbial abundance,
by guest on July 7, 2016
http://femsec.oxfordjournals.org/
activity, and environmental conditions and that (ii) exposure to hydrocarbons would favor oil-degrading taxa. These hypotheses were tested in microcosms, in which natural microbial
communities collected during the ice-algae bloom period were exposed to persistent hydrocarbons. Our study is one of the few that has combined data on hydrocarbon components and bacterial metabolic rates, as well as phylogenetic analysis and community fingerprinting, to investigate oil degradation by ice-associated bacteria.
Materials and methods
Study site and sample collection
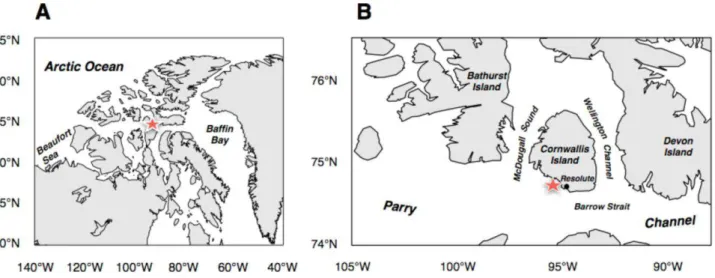
Samples were collected on 1 May 2012 at a station located on the landfast ice of the
Resolute Passage (74.7°N, 95.5°W), a sub-section of the Northwest Passage in the Canadian Arctic Archipelago (Fig. 1A, B). The Northwest Passage is the main channel across the archipelago, linking Baffin Bay in the east to Beaufort Sea in the west (Fig. 1A). The region is extensively covered by first-year ice during most of the year, i.e. from mid/late November to the end of June. The Northwest Passage is influenced by different water masses, mainly Pacific waters to the west, Atlantic waters to the east, and modified Arctic waters flowing from the northern channels
(McLaughlin et al. 2004).
Two types of samples were collected: first-year sea-ice cores and samples of the seawater immediately under the ice cover, hereafter referred to as sub-ice seawater. Sub-ice seawater receives brine rejections during sea-ice formation from autumn to spring, at times making it more saline than the surface seawater found in ice-free areas (Petrich & Eicken 2009). Salinity in the sub-ice samples was 32.0 (Table 1), which is comparable to what is typically found at surface in Barrow Strait during open-water periods (McLaughlin et al. 2004). A total of 40 liters of sub-ice seawater was collected with a pump submersed at the ice-water interface; 20 liters were used for ancillary measurements and 20 liters were used in microcosms (see below). The water was stored in acid-washed containers in the dark at -1 ºC until further processing (see below). Thirteen sea-ice cores
by guest on July 7, 2016
http://femsec.oxfordjournals.org/
were collected using a manual ice corer (Mark II coring system, 9 cm internal diameter, Kovacs Enterprises). The ice cores were cut with a stainless steel saw to collect the bottom 3 cm, where most of the microbial biomass is found (e.g. Michel et al. 1996). Sterile gloves were worn at all times when handling the cores. All cores were kept in sterile Whirl-Pak® bags or in an acid-washed isothermal container in cold, dark conditions until further processing and analysis.
Initial conditions (T0) in sea ice and sub-ice seawater were characterized in terms of microbial variables, i.e. autotroph abundance, prokaryote abundance and heterotrophic activity (herein referred to as bacterial abundance and bacterial production, respectively). Biochemical analyses were performed to determine concentrations of nutrients, dissolved organic carbon (DOC), dissolved nitrogen (DN) and salinity. Microbial variables in sea ice were measured on 3 ice cores that were previously combined in an acid-washed isothermal container and melted in filtered surface seawater (0.22 µm, 142 mm diameter GV Durapore® filter, Millipore). The addition of 500 ml filtered seawater per core gave an average dilution factor of 3.7. One core was kept in a sterile Whirl-Pak® bag for salinity, nutrients, DOC and DN analyses without the addition of filtered seawater to avoid a dilution effect of dissolved materials.
Salinity was measured with a salinometer (Portasal 8410A, Guildline) according to Müller (1999). Inorganic nutrients, i.e. nitrate (NO3-), phosphate (PO43-) and silicic acid (Si[OH]4), were
analyzed ona SmartChem discrete analyzer (Westco Scientific Instruments, Inc.) according to Hansen & Koroleff (1999). DOC and DN concentrations were determined by high-temperature catalytic combustion on a Shimadzu TOC-VCPH analyzer with an ASI-V auto sampler and TNM-1 Total Nitrogen module (Knap et al. 1996). Chlorophyll a (chl a), a proxy for autotroph biomass, was measured by fluorometry using 10AU Turner Designs after filtration onto Whatman GF/F 25mm filters, according to Parsons et al. (1984). Protist and bacterial cell numbers, as well as high nucleic acid content (HNA) bacteria, were stained with SYBR Green I and counted on an Epics Altra flow cytometer (Beckman Coulter) according to Belzile et al. (2008).
by guest on July 7, 2016
http://femsec.oxfordjournals.org/
Microcosm experiments
The remaining 20 liters of sub-ice seawater and nine ice cores were used in microcosm experiments, which started the day following sample collection. The ice cores were combined with 4.5 liters of 0.2 µm filtered surface seawater (total volume of 6.2 liters) into a 9-liter acid-washed Nalgene carboy, and were left to melt slowly overnight in a cold room in the dark. The dilution factor was 3.6. Melted and diluted sea ice samples are convenient and routinely used because microbes in the liquid phase can be reached by stable isotope additions while at the same time be protected from osmotic shock and cell lysis caused by the fresher salinities of melt water (Deming 2010). The use of melted sea ice in the microcosms also ensured that the entire sea-ice bacterial community was exposed to hydrocarbons. This approach was based on previous experimental results showing that upward infiltration of hydrocarbons in sea-ice channels was very low in May (Karlsson et al. 2011).
Control microcosms without oil were set up in duplicate for both sub-ice seawater and diluted ice samples. Triplicate microcosms of sub-ice seawater and diluted sea-ice were spiked with 25 mg L-1 of Arabian Light oil. The oil was previously weathered to remove volatiles. Arabian Light oil is a moderately waxy crude oil (McKetta 1997) and has a pour point of -40 °C (ITOPF 2011). The API gravity (i.e. oil density in relation to pure water, a standard established by the American Petroleum Institute) of this oil varies between 31.8° to 33.4° (Environment Canada 1991), which indicates that it is lighter than water (which has an API gravity of 10°). The oil is classified in Group 3 (°API 17.5–35) and is considered persistent (ITOPF 2011).
Samples were incubated for 15 days in oil-treated and control microcosms and those were gently mixed by a custom-made rotating shaker. Incubations were run in sterile transparent Nalgene polycarbonate bottles at near in situ temperature (-1.7 ± 0.02 ºC; average ± standard error) and under light conditions comparable to those under the sea ice (7.8 ± 0.8 µE m-2 s-1). Temperature was recorded every 10 min during the incubation period and light was measured on ten occasions. Average under-ice PAR at sampling stations visited was 9.4 µE m-2 s-1. Water was collected from
by guest on July 7, 2016
http://femsec.oxfordjournals.org/
each microcosm and control at 5 time points (T), i.e. days 0, 3, 7, 11 and 15, using 250-ml Nalgene bottles for sea ice and 250-ml or 1-liter Nalgene bottles for sub-ice seawater, depending on the analytical volume required. Bacterial production and hydrocarbon composition were measured at each time point. Bacterial abundance was analyzed at the beginning (T0) and at the end (T15) of the experiment by flow cytometry (as mentioned above). Community composition was evaluated using automated ribosomal intergenic spacer analysis (ARISA) fingerprinting and 16S rRNA gene
sequencing at T0 and T15.
Bacterial production
Bacterial production was measured from the incorporation rates of the titriated (3H-) amino acid leucine (leu) according to the centrifugation protocol (Smith & Azam 1992). This approach measures the production rate of proteins (Kirchman & Ducklow 1993) in both bacteria and archaea (Herndl et al. 2005), although we assume a minor contribution of archaea in our samples, as
observed on the Beaufort Sea shelf (< 1% to 7% of archaea in total DAPI counts; Garneau et al. 2006) and in the Northwest Passage (2 to 13%; Wells & Deming 2003). Triplicate subsamples of 1.2 ml were spiked with 3H-leucine (specific activity, 60 Ci mmol-1) to give a final concentration of 10 nM. Duplicate controls were immediately spiked with 50% trichloroacetic acid (TCA; 5% final concentration) to kill the bacteria. Vials for uptake measurement and killed control vials were incubated in the dark at -1.7 °C for 4 h. At the end of the incubation, TCA (5% final concentration) was immediately added to the vials. All samples were frozen at -80 °C until final analysis in our main laboratory. Samples were then thawed at 4 °C and centrifuged at 14000 rpm for 10 min. The supernatant was removed and pellets were rinsed by adding 1 ml of TCA (5% final concentration). This rinsing TCA was removed after a second centrifugation. Scintillation cocktail (Ecolume, MP Biomedicals) was added to the vials and bacterial cells were resuspended by vortex mixing. 3 H-Leucine incorporation was measured using a liquid scintillation counter (TRI-CARB 2100 TR, Packard BioScience) after 48 h of incubation in the dark at 4 °C. Data are given in pmol leu L-1 h-1.
by guest on July 7, 2016
http://femsec.oxfordjournals.org/
Hydrocarbon composition
Gas chromatography-mass spectroscopy (GC-MS) was used to quantify the different
petroleum components at each experimental time point. Alkanes, polycyclic aromatic hydrocarbons and their alkylated homologues represent > 80% weight of the total oil in Arabian Light oil
(Environment Canada, 2001). Thus, these three major groups of hydrocarbon compounds were analyzed: (i) alkanes, including 28 linear n-alkanes ranging in carbon number from C10 to C35, the
branched alkanes pristane and phytane, and the cyclic alkane hopane; (ii) polyaromatic hydrocarbons (PAHs) consisting of the 2-, 3- and 4-ring aromatics (anthracene, chrysenes, dibenzothiophenes, fluorenes, fluoranthenes, naphthalenes, naphthobenzothiophenes, perylenes, phenanthrenes, pyrenes); and (iii) the methylated homologs of these aromatics (C1- to C4
-methylated PAHs). These analytes were selected because they are most likely to contribute to toxicity in fish exposed to an oil spill, as the high molecular weight resins and asphaltenes are not expected to cross fish tissue membranes. In parallel, we also analyzed 9 internal standards (5α-androstane, d10-anthracene, d12-chrysene, d12-perylene, d22-n-decane, d34-hexadecane, d42
-n-eicosane, d62-n-tricontane and d8-naphthalene) and 10 surrogate standards (5β-cholestane, d10
-phenanthrene, d10-pyrene, d12-benzo[a]pyrene, d12-benzo[b]fluoranthene, d14-dibenz[a,h]anthracene,
d26-dodecane, d36-heptadecane, d50-n-tetracosane and d66-n-dotriacontane). A GC-MS detection of
<100 ng L-1 was applied.
Sub-ice seawater and sea ice samples (100 ml) were placed in clean amber glass bottles sealed with Teflon tape after adding dichloromethane (5% final concentration). The samples were refrigerated until analysis, which was performed within 4 months of collection. Hydrocarbons were extracted in dichloromethane and quantified using an Agilent 6890 Series GC with a 5973N MSD operated in the selected ion-monitoring mode. The column was a 30 m × 0.25 mm internal
diameter, with 0.2 m film thickness MS-5 or equivalent column (Supelco, Supelco Park). Concentrations of the analytes at a given time point were divided by the concentration of the internal marker 17α(H),21β(H)-hopane to avoid any bias caused by physico-chemical losses of
by guest on July 7, 2016
http://femsec.oxfordjournals.org/
hydrocarbons (Prince et al. 1994). Hopane-normalized concentrations allow for the measurement of oil biodegradation as the internal marker biodegrade very slowly. The coefficients of variation on the measured concentrations (expressed in ng L-1) between the triplicate filters confirmed that the precision and repeatability of the assay were good. The average coefficient of variation was 1% (N = 81) for the internal standards, 9% (N = 90) for the surrogate standards, and 19% for the analytes (N = 429). The hydrocarbon loss (in %) was calculated as HCloss = (HCT0− HCTx) ÷ HCT0 × 100,
where HCT0 is the hydrocarbon concentration at T0 (initial concentration) and HCTx is the
hydrocarbon concentration at sampling time x.
Hydrocarbon compound concentrations in seawater and melted ice cores were measured before the addition of Arabian Light oil. Methyl-PAH and PAH concentrations were below detection. Alkanes were detected but were, on average, at < 4% of initial concentrations in spiked bottles (5.3 ± 3.5 ×10⁴ ng L-1). Unfortunately, contamination occurred in T15 sub-ice samples
during the preservation and results were excluded from the data analysis.
Bacterial community fingerprinting
Automated ribosomal intergenic spacer analysis (ARISA) fingerprinting (Fisher & Triplett 1999) was used to determine bacterial community structure under the experimental conditions. Sub-ice seawater (1400 ml) and bottom sea-Sub-ice (75 ml) samples that were taken at T0 and T15 were filtered onto 0.2 µm sterile filters (Millipore, 47 mm diameter). DNA was extracted by bead-beating and purified using a PowerWater DNA isolation kit (MO BIO Laboratories). The amount of DNA was then determined by spectrofluorometry (Tecan Safire) using Quant-iT PicoGreen dsDNA assay (Invitrogen). The PCR amplification of the 16S-23S rRNA intergenic transcribed spacer (ITS) region was conducted in triplicate for each DNA extract and according to Ranjard et al. (2000). We used the universal bacterial primers SDBact (eubacterial rRNA gene small subunit, 5’-TGC GGC TGG ATC CCC TCC TT-3’) and LDBact (eubacterial rRNA gene large subunit, 5’-CCG GGT TTC CCC ATT CGG-3’) (Normand et al. 1996). The primers were synthesized by Molecular Probes Invitrogen. The primer SDBact was labeled at the 5’ end with the phosphoramidite dye
by guest on July 7, 2016
http://femsec.oxfordjournals.org/
FAM fluorochrome for subsequent analysis by ARISA. The three-step thermal PCR amplification protocol was: (i) 94 °C for 5 min; (ii) 35 cycles of 94 °C for 1 min, 55 °C for 1 min, 72 °C for 1 min, and (iii) 72 °C for 5 min. The 25 µl-reaction mixtures contained 1× PCR buffer, 1.5 mM MgCl2, 0.2 mM of each deoxynucleoside triphosphate (dNTP), 0.1 µM of each primer, 1U of rTaq
polymerase (GE Healthcare), and 10 ng of DNA template. Triplicate amplified ITS fragments were pooled together and then purified using a QIAquick PCR Purification Kit (QIAgen) to eliminate primer surplus that could interfere during electrophoresis. The bacterial ITS fragments were quantified by spectrofluorometry.
Bacterial ITS products were denatured using Hi Di formamide followed by a heat treatment at 95 °C for 5 min. An internal fluorescent size marker (LIZ1200) was added to each sample and 10 ng of bacterial product were run on a 3130XL Capillary Genetic Analyzer (Applied Biosystems) using a 50 cm capillary. ARISA electrophoresis profiles were analyzed with Genemapper software (Applied Biosystems). Peak lengths and absolute areas that characterized the different operational taxonomic units (OTUs) and their abundances were used in data analysis. Peaks with a length inferior to 200 bp and superior to 1200 bp were considered noise and were thus excluded from further analysis. The area of each peak was divided by the total area of the sample to obtain relative abundance (%). Background and electrophoresis internal deviation were eliminated using the variable percentage threshold method (Osborne et al. 2006) and the binning procedure under R environment (interactive and automatic binning algorithms; Ramette 2009). Data were transformed to abundance matrices, from which Bray-Curtis dissimilarities (BCdiss) between samples were
calculated using the Primer software (Clarke & Warwick 2001). The complement of the Bray-Curtis measure was used to calculate the similarities.
Ion Torrent 16S rRNA gene sequencing
At the beginning of the experiment (T0), triplicate samples of sub-ice seawater (1400 ml) and melted sea ice (75 ml) were filtered onto 0.2 µm sterile filters (Millipore, 47 mm diameter) for DNA extraction using hexadecyltrimethylammonium bromide (CTAB), following a slightly
by guest on July 7, 2016
http://femsec.oxfordjournals.org/
modified version of the method published by Ausubel et al. (2002). A phenol/chloroform extraction was first performed and was followed by a chloroform/isoamyl alcohol (24:1) extraction. This extraction method gives superior DNA purity than the bead-beating method we used for DNA fingerprinting, but it produces toxic phenol-chloroform wastes. The DNA was precipitated overnight at -20 °C. The DNA pellet was resuspended in 100 µl of sterile deionized water and quantified using the Quant-iT PicoGreen dsDNA assay (Invitrogen). The water from triplicate oiled microcosms was harvested at T15. The control treatments at T0 and T15 were in duplicate. These samples were filtered and extracted as described above for the initial sub-ice seawater and melted sea ice samples.
Partial 16S ribosomal (rRNA) gene amplicons were produced using the universal primers F343 (5’-TAC GGR AGG CAG CAG-3’) and R534 (5’-ATT ACC GCG GCT GCT GGC-3’) as in Yergeau et al. (2014). The primers contained 10-bp multiplex identifiers (MIDs) and adaptor sequences for Ion Torrent sequencing (Yergeau et al. 2012; Bell et al. 2013). Reactions were performed in 25-µl volumes containing: 10 ng of DNA, 0.3 µM of each primer, 0.4 mg ml–1 of bovine serum albumin, 0.2 µM of dNTPs and 0.05 U µl–1 of rTaq DNA polymerase (GE
Healthcare). The PCR cycling conditions involved an initial denaturation step at 95 °C for 5 min, followed by (i) 30 cycles of 30 sec at 95 °C, (ii) 30 sec at 55 °C, (iii) 45 sec at 72 °C, and (iv) a final elongation step of 3 min at 72 °C. The PCR products were purified on agarose gel using the QIAquick gel extraction kit from QIAGEN and quantified with the Quant-iT PicoGreen dsDNA assay (Invitrogen). All of the 20 purified products were pooled in equimolar ratios. A total of 39.15 ×10⁷ molecules was used in the emulsion PCR using the Ion PGM Template 0T2 200 and the OneTouch instrument (Life Technologies). Community composition assessment was performed using the RDP pyrosequencing pipeline (http://pyro.cme.msu.edu/); sequences were separated based on their adapter, as well as deconvoluted and binned according to their respective MIDs.
Sequencing was performed on an Ion Torrent personal genome machine using the Ion 314 chip and the Ion PGM Sequencing 200 kitV2 (Life Technologies) following the manufacturer’s
by guest on July 7, 2016
http://femsec.oxfordjournals.org/
instructions. Sequences with an average Phred quality score below 20 or a length of less than 150 were filtered out of the data set. Taxonomic identities were assigned by classifying sequences in parallel with a boostrap value of 80% using the MultiClassifier tool from the Ribosomal Database Project Pipeline Classifier (Release 9; Wang et al. 2007). Number of reads before and after quality control generated during the 16Sr RNA gene sequencing analysis are presented in Table S1. The results of the replicate sequences belonging to a given taxonomic level were averaged and
expressed as a percentage of all sequences. Raw sequence data produced in this study was deposited in NCBI under the Bioproject accession PRJNA321190 and the SRA accession xxxx (pending).
Statistical analysis
Differences between two groups (i.e. control versus oil-treated microcosms; ice versus sub-ice seawater) were tested with the R software (R Core Team, 2013). The Student’s t-test was used since data distributions were not far form a normal distribution and variances were equal.
Differences between incubation days were tested with the Kruskal-Wallis test (KW) and multiple comparison post-hoc tests were run using the kruskalmc function in the pgirmess package of R software (Giraudoux 2014). Mean values are presented with standard error (SE).
Bray-Curtis similarities were illustrated using non-metric multidimensional scaling (MDS), where each data point represents a bacterial assemblage, and the distance between data points represents the level of similarity in bacterial assemblages; the longer the distance, the lower the similarity. Bacterial community composition was assessed using ANalysis Of SIMilarity
(ANOSIM), based on a random Monte-Carlo test of 100,000 permutations (Primer V06 software; Clarke & Warwick 2001). The test compares ranks of distances between groups with ranks of distances within groups. Resulting R values > 0.75 are interpreted as well distinct, R > 0.5 as different but overlapping, and R < 0.25 as barely different (Clarke & Gorley 2001). The Mann-Withney U test (MW) was performed to test difference in assemblage similarity between (i) sub-ice seawater and sea-ice microcosms, (ii) controls and oil-treated microcosms, and (iii) T0 and T15.
by guest on July 7, 2016
http://femsec.oxfordjournals.org/
Results
Environmental parameters and initial experimental conditions
Environmental conditions in sub-ice seawater and in sea ice at the time of the sampling were typical of the spring period (Table 1). Nutrient inventories were high in sub-ice seawater but
bacterial (2.3 ×10⁵ cells ml-1) and phytoplankton biomass (< 0.2 mg chla m-3) were low, indicating pre-bloom conditions. Pre-bloom nitrate concentrations in the surface waters of the Canadian Archipelago are typically ca. 10 mmol m-3 (Codispoti et al. 2013), which is concordant with our nitrate concentrations (Table 1). Comparatively, sea ice had more nutrients and dissolved matter, and had higher bacterial (16 ×106 cells ml-1) and algal (> 4000 mg chl a m-3) biomasses (Table 1). Concentrations of DOC and chl a, and protist abundance were 3 to 5 orders of magnitude higher in the ice than in sub-ice seawater (Table 1), indicating that the ice-algal bloom was well underway.
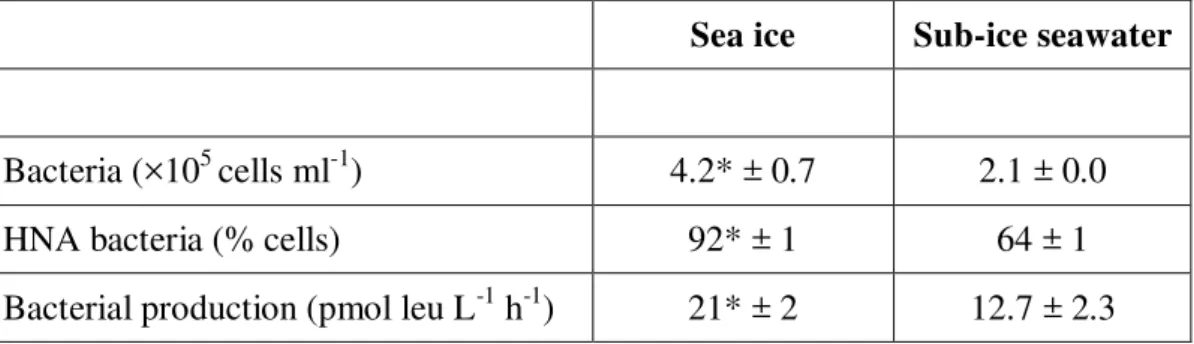
For microcosm experiments, sea ice was diluted to reach a bacterial abundance comparable to what was measured in sub-ice seawater (Table 2). Initial (T0) bacterial abundance and production in the microcosms, as well as the proportion of HNA bacteria, were significantly higher in the sea ice than in sub-ice seawater (t-test, p < 0.01; Table 2). Nonetheless, values were of the same order of magnitude (Table 2).
Bacterial production
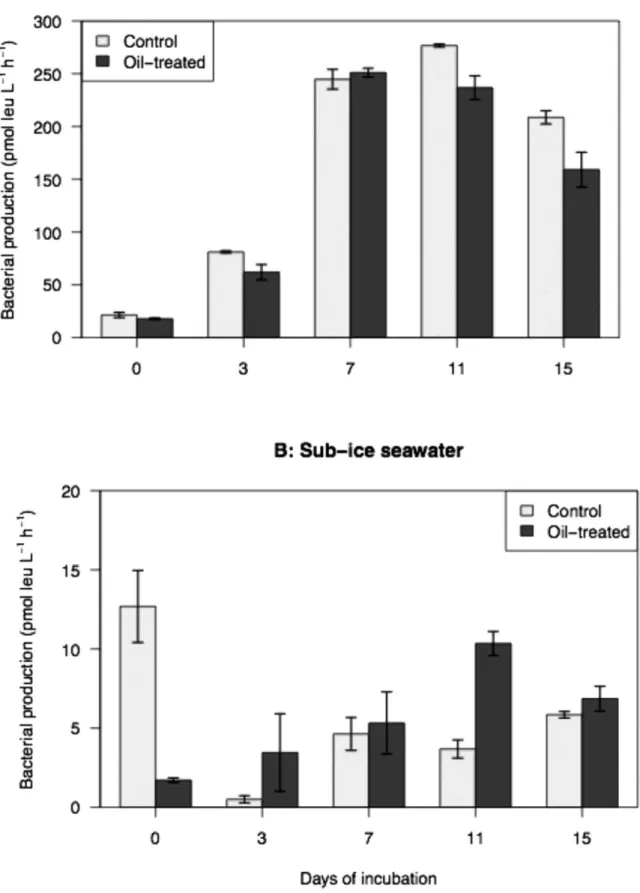
Bacterial production during the incubation reached values that were about 10 times higher in sea ice (Fig. 2). Bacterial production in sub-ice microcosms at T0 was significantly higher in the controls than in the oil-treated microcosms (13 versus 2 pmol leu L-1 h-1; t-test, p < 0.01; Fig. 2B).
This situation was reversed during the remainder of the incubation (i.e. excluding T0) with a mean of 6.5 ± 1.0 pmol leu L-1 h-1 in oil treatment compared to a mean of 3.7 ± 0.8 pmol leu L-1 h-1 in controls (t-test, p < 0.05; Fig. 2B).
In the experiments with sea ice however, there was no significant difference in bacterial production between the oil-treated and control microcosms (t-test, p > 0.05; Fig. 2A). The overall
by guest on July 7, 2016
http://femsec.oxfordjournals.org/
bacterial production in the sea-ice microcosms increased significantly over the course of the experiment, with a 4-fold increase from T0 to T7 (19 ± 1 versus 248 ± 4 pmol leu L-1 h-1; KW, p < 0.05, Fig. 2A).
Hydrocarbon degradation in oil-treated microcosms
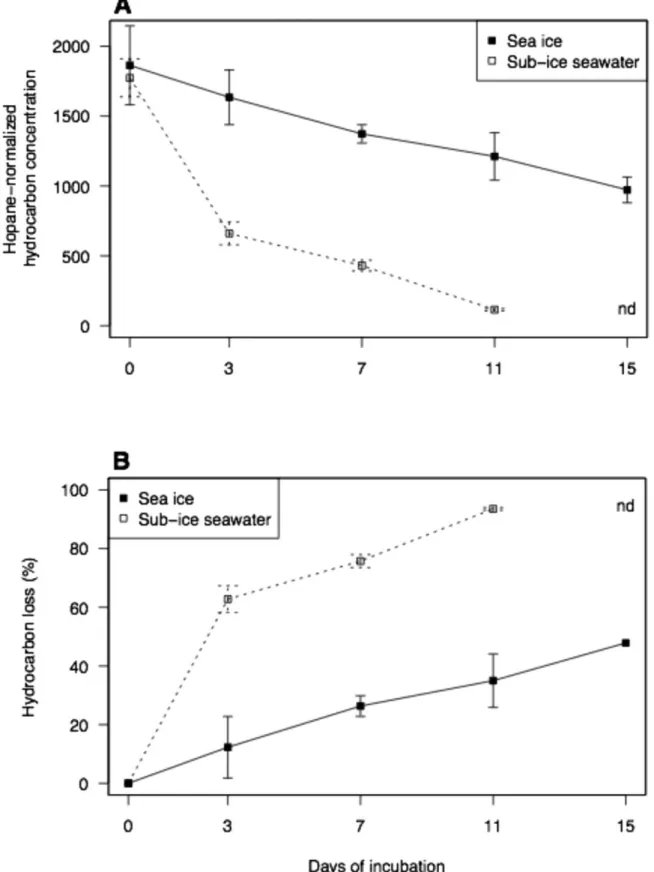
Total hydrocarbon concentrations at the beginning of the incubation (T0) were not significantly different between sea ice and sub-ice seawater, averaging 1819 ± 141 hopane-normalized units (t-test, p > 0.05; Fig. 3A). The 28 alkanes analyzed were detected in both microcosms at T0 (data not shown). Three low-molecular-weight (LMW) PAHs (i.e. 2 or 3 rings; Canadian Council of Ministers of the Environment 1999) were also detected. They were
phenanthrene, naphthalene and dibenzothiophene, but there was no PAH compound of high molecular weight (HMW; 4 to 7 rings; Canadian Council of Ministers of the Environment 1999). Twenty-six methyl-PAHs were detected in the microcosms at T0 (data not shown).
Total concentrations decreased in both sea-ice and sub-ice seawater microcosms during the experiment (Fig. 3). Concentration in sea-ice microcosms was 972 ± 92 hopane-normalized after 15 days, but there was no significant difference between T0 and T15 (t-test, p > 0.05). In sub-ice seawater, there was a significant difference between T0 and T11, at which time the concentration was 115 ± 8 hopane-normalized units remaining after 11 days (t-test, p < 0.005).
The hydrocarbon loss rate in sea-ice microcosms was constant over the duration of the experiment, as shown by the consistent slope of percent hydrocarbon loss by incubation days (Fig. 3B). In these microcosms, 1635 ± 195 hopane-normalized units remained at T3 (Fig. 3A),
corresponding to a loss of 12 ± 11% (Fig. 3B). Comparatively, in sub-ice seawater microcosms most of the total hydrocarbon loss (63 ± 5% of initial concentrations) occurred during the first days, with 660 ± 82 hopane-normalized units remaining at T3 (Fig. 3A). The estimated loss rate of
hydrocarbons between T0 and T3 was significantly higher in sub-ice seawater than in the sea-ice microcosms (371 versus 76 hopane-normalized unit d-1, respectively; test on slopes, p < 0.01). On
by guest on July 7, 2016
http://femsec.oxfordjournals.org/
average, the loss of hydrocarbon components by the end of the incubation was 94% in sub-ice seawater and 48% in sea ice (Fig. 3B). Based on the time series of hydrocarbon percent loss, the overall half-life of crude oil in Resolute Passage would be ca. 3 days in seawater under ice cover, but at least 2 weeks when in contact with sea-ice bacteria under similar environmental conditions.
There was no significant difference in the initial (T0) amounts of the major groups of hydrocarbon compounds between sea-ice and sub-ice seawater microcosms (Fig. S1, Supporting Information), which consisted mainly of alkanes (85 ± 1 %), followed by methylated PAHs (15 ± 1 %) and PAHs (0.50 ± 0.03%). These proportions remained unchanged from T0 to T15 in sea-ice (Fig. S1A) microcosms (KW, p > 0.05), but slightly changed in sub-ice seawater microcosms during the incubation although the difference was not statistically significant (Fig. S1B). The final hydrocarbon composition in sub-ice seawater consisted of 65 ± 4% alkanes, 34 ± 4% methylated PAHs and 1.8 ± 0.3% PAHs (T11).
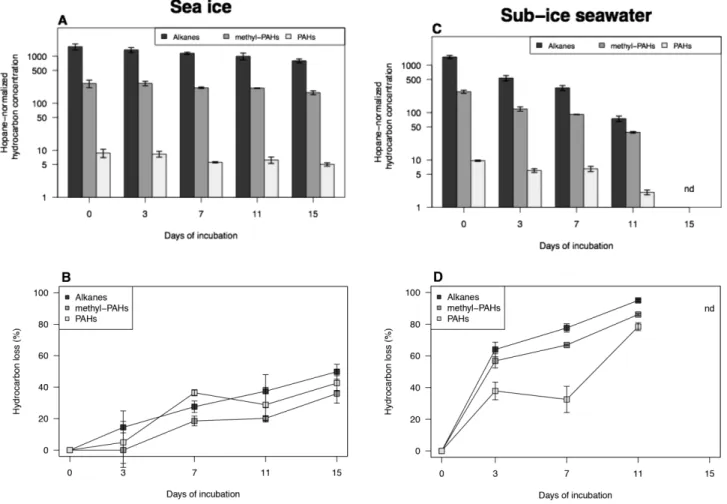
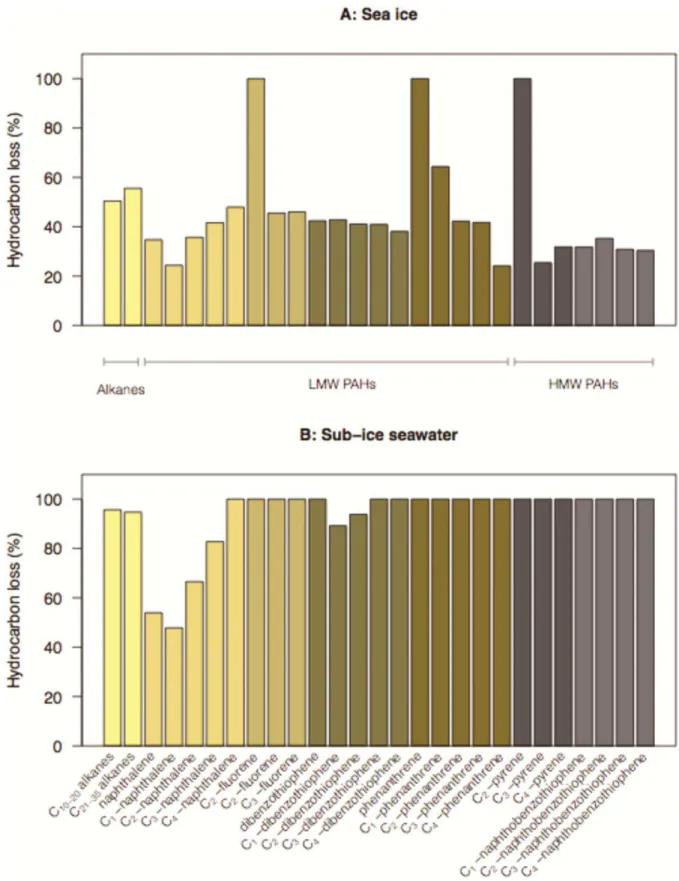
The three majors groups of hydrocarbon compounds showed different rates of decrease during the incubation period (Fig. 4). Alkanes showed the highest loss in terms of absolute
concentrations, followed by methyl-PAHs and PAHs in both sea ice and sub-ice seawater, and this trend is especially evident in sub-ice microcosms (Fig. 4A, C). This also applied to the relative loss values (in %) measured in sub-ice water microcosms (Fig. 4D), but not to sea-ice microcosms where the PAHs experienced higher loss (43 ± 5 %) than methyl-PAHs (36 ± 9 %) throughout the experiment (Fig. 4B). Loss rates (in % per day) of alkanes and methyl-PAHs were significantly higher in sub-ice seawater than in sea ice (t-test, p < 0.01, Fig. 4).
Few aromatics were completely biodegraded in sea-ice microcosms (Fig. 5A); only C1
-methylated fluorene, phenanthrene and C2-methylated pyrene were fully degraded. The loss of
alkanes varied between 50 and 56%, whereas the loss of other compounds was below the average total hydrocarbon loss of 48% for sea ice (Fig. 5A). Comparatively, many aromatics were
completely biodegraded (i.e. 100% loss) in sub-ice seawater: C1- to C3-methylated fluorenes,
phenanthrene and its C1- to C4-methylated forms, C1- to C4-methylated naphthobenzothiophenes, as
by guest on July 7, 2016
http://femsec.oxfordjournals.org/
well as C4-methylated naphthalenes, and the dibenzothiophene and its C3- and C4-methylated forms
(Fig. 5B). The loss of linear n-alkanes (C10 to C35) was close to the average total hydrocarbon loss
of 94%, whereas the loss of the small methylated aromatics C0-C2 naphthalenes and C1-C2
dibenzothiophenes was below that average (Fig. 5B).
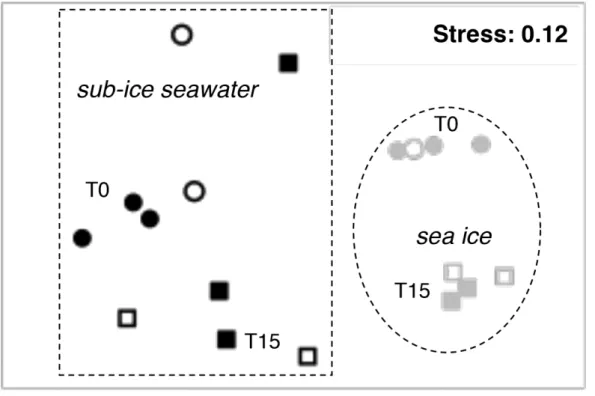
Bacterial community composition
Differences in bacterial community composition were observed between sub-ice seawater and sea-ice microcosms (ANOSIM, R = 0.77, p < 0.01; Fig. 6). The non-metric MDS plot had a 2D stress of 0.12, indicating good representations of the similarity matrices (Fig. 6). The initial (T0) bacterial community structure was similar in oil-enriched and control microcosms for a given sample type; similarity was 75 ± 6% (MW, p < 0.01) in sea ice and 69 ± 5% (MW, p < 0.01) in sub-ice seawater. There was a significant difference in bacterial community between T0 and T15 in sea ice (ANOSIM, R = 1, p < 0.05), but at T15 the control and oil-treated microcosms were similar (MW, p > 0.05; Fig. 6). Significant difference between T0 and T15 was also observed in oil-treated microcosms for the sub-ice seawater (ANOSIM, R = 0.61, p < 0.05). The similarity in community structure was significantly higher between T0 and T15 in the controls (38 ± 6%, MW, p < 0.01) when compared to the similarity in oil-treated microcosms over the same period (26 ± 7%, MW, p < 0.01). In other terms, the bacterial community composition in sub-ice seawater changed more in oil-enriched microcosms than in controls after the incubation time.
In sea ice at the beginning of the experiment, an average of 5474 ± 970 16S rRNA gene sequences were obtained from each replicate sample (Table S1), and chloroplasts (a proxy for algal sequences) represented 72 ± 2% of the total sequences. After two weeks of incubation, less than 0.1% of the sequences were chloroplast for both the oiled-enriched microcosms and the controls (data not shown). In sub-ice seawater microcosms, an average of 5964 ± 540 16S rRNA gene sequences were obtained (Table S1). Of these, 1.9% ± 0.1 were affiliated to chloroplasts in both treatments at T0 and T15 (not shown). This is consistent with the higher algal biomass (chl a) measured in our sea-ice samples when compared to sub-ice seawater (Table 1). Sea-ice bacterial
by guest on July 7, 2016
http://femsec.oxfordjournals.org/
community composition at T0 consisted of, on average, 77 ± 1% of Proteobacteria (alpha: 0.3%;
gamma: 49% and others: 28%), 23 ± 1% of Bacteroidetes (Flavobacteria: 9%) and ˂ 1% of
Actinobacteria, Acidobacteria and Firmicutes (data not shown). In sub-ice seawater, the bacterial
community at T0 was composed of, on average, 72 ± 1% of Proteobacteria (alpha: 7%; epsilon: 0.1%; gamma: 58% and others: 6%), 28 ± 1% of Bacteroidetes (Flavobacteria: 17%), and ˂ 2% of
Actinobacteria, Verrucomicrobia, Fusobacteria, Firmicutes and Planctomycetales (not shown).
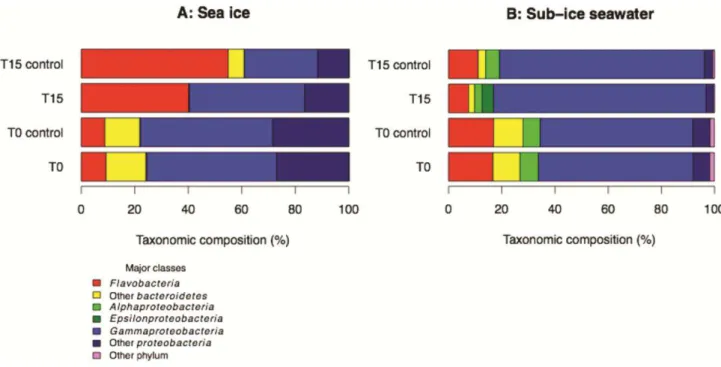
Amplicon sequencing analyses of the 16S rRNA gene also revealed that the bacterial community composition changed significantly over the course of the experiment (i.e. between T0 and T15) in the control and oil-enriched microcosms for both sea ice and sub-ice seawater (Fig. 7). All sea-ice microcosms experienced an increase in the relative contribution of
Flavobacteria/Bacteroidetes and a decrease in Proteobacteria (Fig. 7A). The reduction in
Proteobacteria was less important in oil-enriched microcosms. Community composition evolved
differently in the sub-ice seawater microcosms; the relative contribution of Bacteroidetes decreased and relative contribution of Proteobacteria increased, especially the Gammaproteobacteria (Fig. 7B). Notably, in the oil-enriched microcosms the contribution of Epsilonproteobacteria increased (T15: 4 ± 2% versus T0: 0.1 ± 0.0%; t-test, p < 0.01) whereas the contribution of
Alphaproteobacteria decreased significantly (T15: 3 ± 1% versus T0: 7 ± 1%; t-test, p < 0.01).
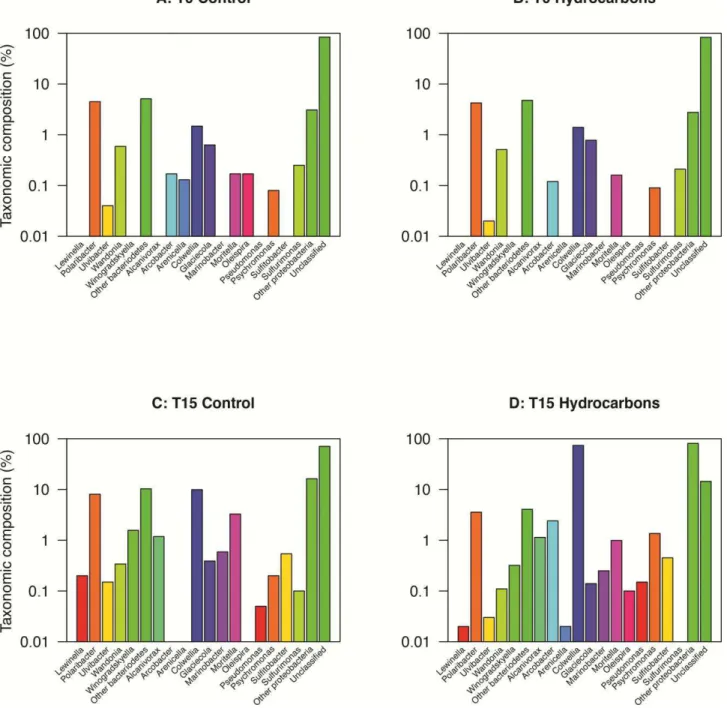
Resolution at lower taxonomic ranks revealed finer changes in sea ice (Fig. 8). Increases in the relative contribution of the genera Polaribacter and Moritella were observed at T15 in control and oil-treated microcosms, as well as a decrease in the relative contribution of Glaciecola (Fig. 8C, D). Polaribacter contributed for 99 ± 1% of the Bacteroidetes, whereas Moritella and Glaciecola contributed 69 ± 7% and 1.2 ± 0.4% of the Proteobacteria, respectively. Moritella was the only genus that was more abundant in oil-treated microcosms (41%) than in the controls (24%). The most striking change was in oil-treated microcosms where the community diversity decreased because minor taxa (i.e. Arenicella, Octadecabacter, Lewinella, Ulvibacter and Perscivirga) were
by guest on July 7, 2016
http://femsec.oxfordjournals.org/
below detection (Fig. 8D). Sequences from the genus Algicola were only detected after incubation with crude oil (Fig. 8D).
Interestingly, the sub-ice seawater at T0 in both the oil-treated and controls microcosms consisted of ~25% unclassified bacteria at the class level, which increased to 97% unclassified bacteria at the genus level (Fig. 9A, B). The presence of oil stimulated the growth of Colwellia, which constituted 33% of the population at the end of the incubation period (Fig. 9D). Three genera were only obtained after two weeks in the oil-treated microcosms; Alcinovorax, Sulfitobacter and
Oleispira contributed to 0.52%, 0.20% and 0.05%, respectively (Fig. 9D). Even though new genera
were detected after two weeks in the oil-treated microcosms, the overall diversity had decreased; the contribution of unclassified bacteria was to 61% in oil-treated microcosms at T15, whereas it was 96% in controls (Fig. 9C, D).
Discussion
Contrasting hydrocarbon degradation within and under first-year sea ice
Ice-associated microorganisms are able to substantially degrade typical crude oil
components at temperatures as low as -1.7 °C, without additional nutrients nor oil dispersant. The biodegradation capacity of the indigenous ice-associated microbes of the eastern Canadian Arctic Archipelago was markedly distinct whether they lived in the ice matrix or in the underlying waters. Bacterial communities in sub-ice seawater were much more efficient in degrading hydrocarbons than those living in sea ice, as the former degraded the bulk (94%) of added hydrocarbons within 11 days (Fig. 3B). Sea ice bacteria removed less than 40% of the hydrocarbons over a similar period (Fig. 3B), although these cells were two times more abundant at the beginning of the experiment (Table 2).
Sub-ice seawater bacteria depleted almost all the resolvable alkanes (C9 to C40, pristane and
phytane; sensu Atlas & Bragg 2009) within 11 days at -1.7°C (Fig. 5B). Alkanes are major
components of crude oil, and are typically utilized as carbon and energy sources by bacteria (Rojo
by guest on July 7, 2016
http://femsec.oxfordjournals.org/
2009), including Arctic populations growing at 4°C (Deppe et al. 2005) down to 1°C (Gerdes et al. 2005), and as low as -1°C (McFarlin et al. 2014). Interestingly, the methylated forms of PAHs were degraded almost as much as the alkanes by the sub-ice seawater bacteria (Fig. 4B). This contrasts with recent experimental results obtained with Arctic seawater bacteria where parent PAHs were degraded before their methylated homologues (McFarlin et al. 2014). These compounds are considerably toxic and bioaccumulate more than the non-methyl forms because the addition of a methyl group decreases water solubility (Seo et al. 2009). Methylated PAHs are nonetheless
biodegradable under aerobic conditions, but few studies have addressed this topic (Seo et al. 2009). Sea-ice bacteria were not as efficient in degrading methyl-PAHs; only two compounds out of the 26 detected were fully metabolized (Fig. 5A) whereas the remaining ones were partially degraded (24 to 64%).
LMW-PAHs are highly toxic to most aquatic organisms (Peng et al. 2008), naphthalenes being the most noxious (International Association of Oil & Gas Producers 2002), but they can be metabolized by microorganisms (van Agteren et al. 1998). Phenanthrene, a biodegradable and relatively water-soluble PAH (Head et al. 2006), was completely degraded by all ice-associated microbes, whereas naphthalene and dibenzothiophene were degraded to a lesser extent (Fig. 5). Nonetheless, naphthalene-degrader microbes in cold Arctic ecosystems are as efficient as their temperate counterparts (Bagi et al. 2014). Assuming the degradation rate observed during our experiment would persist, 15 more days would be needed for the complete degradation of these components. Our results indicate that sub-ice microbial communities have the physiological capabilities to degrade crude oil and could possibly biodegrade naphthalenes from an accidental spill within a month, even under seasonal sea-ice cover.
Microcosms to study hydrocarbon degradation
The bacterial communities studied in microcosms are representative, in terms of abundance, production and diversity, of natural communities found in the Northwest Passage in spring. In May-June, the area is typically covered with first-year ice that supports high ice algal production (Cota et
by guest on July 7, 2016
http://femsec.oxfordjournals.org/
al. 1991), which was reflected by the very high bottom-ice chl a concentrations at the time of our
experiment (Table 1). Bacterial abundances in sub-ice seawater and in sea ice (Table 1) were comparable to previous records for the same region; 1.0 ×10⁵ cells ml–1 were found at the ice-water interface, and from 1.5 up to 100 ×105 cells ml–1 in sea ice of Resolute Passage during April-May (Maranger et al. 1994). When applying the conservative conversion factor of 1.5 ×10⁶ mg C mol-1 leucine (Ducklow 2003) to our leucine uptake rates at T0, daily bacterial production was 0.77 mg C m-3 d-1 in sea ice and 0.46 mg C m-3 d-1 in sub-ice seawater. These rates are consistent with
rates in sea ice of 0.48 to 3 mg C m-3 d-1, and a mean of 0.72 mg C m-3 d-1 in sub-ice waters of the Resolute Passage (Maranger et al. 1994).
Gammaproteobacteria is typically the predominant group in Arctic sea ice (Junge et al.
2002; Brinkmeyer et al. 2003; Bowman et al. 2012) followed by Bacteroidetes (Deming 2010), whereas Alphaproteobacteria dominates in Arctic surface waters (Garneau et al. 2006; Alonso-Sáez
et al. 2008). Accordingly, our results showed a dominance of Gammaproteobacteria and
Bacteroidetes in the marine communities on the underside of landfast ice but no
Alphaproteobacteria were detected (Fig. 7A), which is concordant with observed low abundance
(ca. 4% of 16S rRNA gene sequence tags) in Arctic multi-year ice (Bowman et al. 2012). Bacterial composition in sub-ice seawater at the beginning of our experiment showed the presence of the same three dominant groups, but with a predominance of the Gammaproteobacteria over the
Alphaproteobacteria (Fig. 7B). This could be related to the phytoplankton pre-bloom conditions,
sub-ice conditions, or exchange of ice bacteria with sub-ice seawater. Given that our experiment was run in oxic conditions, as would be expected in the diffusive interfacial sea-ice layer,
sequencing results did not reveal the presence of anaerobic bacteria. However, anoxic micro-sites have been found in sea-ice brine channels in the Arctic (Rysgaard & Glud 2004), where anaerobic bacteria were detected (Petri & Imhoff 2001; Bowman et al. 2012). Biodegradation of hydrocarbon is also possible in anoxic pockets when NO3-, Fe3+, and SO42- are used as electron acceptors
by guest on July 7, 2016
http://femsec.oxfordjournals.org/
(Widdel & Rabus 2001). The extent of anaerobic oil biodegradation in ice could not be estimated in our oil-treated microcosms, and would require further investigation.
One cannot rule out that part of naphthalene losses may be due to volatilization in the headspace of the incubation microcosms. Irwin and colleagues (1997) showed that volatilization in soils accounted for about 20% and 30% of the loss of C1-methylnaphthalene and naphthalene,
respectively, but for the 12 remaining HMW-PAHs, volatilization was not an important loss mechanism. Given that at low temperature the volatilization of short-chain alkanes is reduced (Yang et al. 2009), volatilization of naphthalenes in our microcosms was probably smaller than what was observed in soils, and therefore most losses were likely due to biodegradation.
The overall half-life of low-pour point oil spilled in Resolute Passage would be ca. 3 days in seawater under ice cover. This is faster than other recent experimental results, which suggest that the half-life of crude oil would be ca. 60 days in the Chukchi Sea at sub-zero temperatures (McFarlin et al. 2014). No bacterial activity was measured during that experiment, but nutrient concentrations were below the detection limit in the Chukchi Sea, suggesting that bacterial growth may have been limited and explaining the comparatively shorter half-life measured in our
microcosms. In contrast, a half-life of 14 days was suggested for crude oil in temperate (8°C) seawater offshore of New Jersey, USA (Prince et al. 2013).
Microbial response to oil exposure
Initial bacterial abundances in microcosms did not have much impact on the overall
degradation of oil because even though cell abundance in sub-ice seawater microcosms was half the count in ice (Table 2), sub-ice microbes degraded three times more hydrocarbons in 3 days (Fig. 3). Results rather support the idea that difference in the starting community composition and/or
environmental conditions (e.g., DOC concentrations) were key factors. The relative contribution of
Gammaproteobacteria to the total bacteria was higher in sub-ice seawater than in the ice matrix,
where the contribution of other Proteobacteria was also important (Fig. 7). Gammaproteobacteria
by guest on July 7, 2016
http://femsec.oxfordjournals.org/
were confirmed to be the main players of oil biodegradation in cold marine environments (Yakimov
et al. 2004; Gerdes et al. 2005; Brakstad & Bonaunet 2006; Brakstad et al. 2008). Bacterial
diversity also changed in the presence of hydrocarbons (Figs. 7, 8, 9) and shifted towards a higher contribution of Gammaproteobacteria in both sub-ice seawater and sea ice, further supporting the contention that oil-degrading bacteria are affiliated to this class. Interestingly, the
Epsilonproteobacteria in sub-ice seawater also seemed to have benefited from the presence of oil,
as their contribution increased in oil-enriched microcosms but not in controls (Fig. 7B). Several genera of this class that are able to oxidize sulfur compounds dominated the microbial biomass in groundwater contaminated by crude-oil extraction activities (Kodama & Watanabe 2003; Hubert et
al. 2011). This may explain why dibenzothiophene, a sulfur-containing compound, and its
methylated forms were highly oxidized (average of 97% loss) in sub-ice waters but not in sea ice (< 40% loss; Fig. 5).
Bacteroidetes increased the most after 15 days of incubation in sea-ice microcosms,
regardless of the presence of hydrocarbons (Fig. 7A) and following bacterial production rates (Fig. 2), i.e. Bacteroidetes increased in sea ice, but decreased in seawater. These changes agree with previous observations of a Bacteroidetes predominance associated with high bacterial biomass and production (Teira et al. 2008). Bacteroidetes are the main degraders of complex polymeric organic compounds (Cottrell & Kirchman 2000; Fernández-Gómez et al. 2013); therefore the presence of extracellular polymeric substances (EPS) in the sea ice of the Canadian Arctic Archipelago (Aslam
et al. 2016) could have provided a competitive advantage for resources to the Bacteroidetes over
the Gammaproteobacteria. Conversely, the low organic matter content in sub-ice seawater (Table 1) could have been more advantageous for the Gammaproteobacteria.
The characterization at the genus level indicated that crude-oil addition reduced microbial diversity (Fig. 8, 9), as previously shown for oil-polluted fjord ice (Brakstad et al. 2008) and Arctic multi-year ice (Gerdes et al. 2005). Three genera benefited from the oil enrichment in sea ice, the
Gammaproteobacteria genera Moritella, Algicola and Colwellia (Fig. 8). Moritella was recently
by guest on July 7, 2016
http://femsec.oxfordjournals.org/
reported to be the second most abundant genus in naphthalene-spiked Arctic seawater (Bagi et al. 2014), whereas the genus Algicola has not been previously described as oil-degrader. It is unclear if
Algicola strains metabolized the added hydrocarbons or if they were rather secondary consumers
that profited from other compounds released by oil-degrading bacteria.
Members of the genus Colwellia, which are oil-degrading Gammaproteobacteria (Yakimov
et al. 2004; Redmond & Valentine 2012), were also stimulated by the presence of oil in sub-ice
seawater (Fig.9). Like Polaribacter (Bacteroidetes), Colwellia are known psychrophiles and may have benefited from the low incubation temperature (< -1°C), like previously observed in cold marine environments (Yakimov et al. 2004; Brakstad et al. 2008). Three typical marine
hydrocarbonoclastic bacteria, i.e. Alcinovorax and Oleispira (Yakimov et al. 2007), only grew in oil-treated sub-ice seawater microcosms, as well as Sulfitobacter, a sulfite-oxidizing
Alphaproteobacteria bacterium. This genera was also obtained in beach sands in the Gulf of
Mexico after the Deepwater Horizon oil spill (Kostka et al. 2011). The very high percentage of unclassified bacteria in the sub-ice seawater (97%) at the genus level indicates that the majority of bacteria in cold Arctic waters have yet to be discovered.
The oil treatment in sea-ice microcosms did not induce an increase in bacterial production as it did in sub-ice microcosms after 3 days and until the end of incubation (Fig. 2). This lag period was similar to the 5 to 8 day lag observed during other carbon enrichment experiments on polar bacterial communities (Dyda et al. 2009; Ducklow et al. 2011). Bacterial communities usually need time to activate the pathway of enzymes required for hydrocarbon degradation (Rojo 2009). The fast response to hydrocarbon exposure observed in our study may be due to a subpopulation of alkane degraders that is maintained by alkanes, which are ubiquitous in the marine environment, being continuously produced by many organisms (plants, green algae, bacteria and animals; Rojo 2009). The sub-ice carbon:nitrogen (DOC:DN, mol:mol) ratio of 6:1 (Table 1) suggests a carbon-limited community because it is below the ratio of 10:1 for optimal hydrocarbon degradation (Alexander 1999). The addition of hydrocarbons very likely stimulated the activity of the
by guest on July 7, 2016
http://femsec.oxfordjournals.org/
limited sub-ice bacteria. Likewise, the addition of 3H-leucine may have induced an artificial stimulation of the uptake rates, explaining why bacterial production in control microcosms at T0 were much higher than at any other time point (Fig. 2). Toxic stress on bacteria after oil addition (e.g., Siron et al. 1993) may have impeded such stimulation in the oil-treated microcosms.
In sea ice, the DOC:DN ratio of 16:1 (Table 1) was above the optimal ratio, indicating that the biodegradation of spilled hydrocarbons would rather be limited by nutrients. Accordingly, the addition of hydrocarbons did not lead to a sharp increase in bacterial production (Fig. 2A). Nutrient limitation after oil spills is common in marine environments because hydrocarbons have high organic carbon content and no bioavailable nitrogen (Das & Chandran 2011). The limited biodegradation in sea ice may also be explained by the availability of highly labile dissolved organic matter produced by sea-ice algae (Amon et al. 2001). Algal-derived carbon supports
substantial bacterial growth (Riedel et al. 2008), and most alkane-degrading bacteria were shown to prefer such labile compounds than alkanes when available (Rojo 2009). The very high DOC and chl a concentrations found in sea ice as well as the apparent absence of (or a short) lag period in sea-ice bacterial activity would agree with a bacterial production supported by sea-ice organic carbon.
Factors governing hydrocarbon degradation in ice-covered Arctic waters
Among the 59 crude oils classified in ITOPF’s technical paper (2011), about 61% have a pour point < -2°C (including the Arabian Light used in this study), implying that a majority of oils would still behave like fluids and spread in droplets under wave action even if the Arctic seawater is at its coldest. Arabian Light oil was efficiently degraded in this study in part because the oil was still fluid and accessible to microorganisms, even at sub-zero temperatures. High degradation rates could be found in the field for several other low pour-point oils, although in some cases oil
composition could lead to divergent results. In ice-covered areas however, where temperature in first-year ice varies between -2 and -20°C (Junge et al. 2004), degradation rates would potentially be much lower than what was observed in ice microcosms because only 39% of the
by guest on July 7, 2016
http://femsec.oxfordjournals.org/
classified oils would exhibit liquid characteristics below -15°C. At temperature as low as -25 °C in multi-year ice (Perovich & Elder 2001), biodegradation rates would be negligible, if not null, because most oils will solidify (ITOPF 2011) and because very cold ice has little brine volume fraction and thus, fewer microhabitats to support an active bacterial community (Deming 2010).
The “law of five” states that sea ice that has a brine volume fraction of 5% and the typical salinity of 5 ppt will be impermeable at temperatures below -5°C (Golden et al. 1998). Conversely, at temperatures warmer than -5 °C, the sea ice will be permeable because brine inclusions become connected, allowing heat, brine, nutrients and seawater to move through ice (Golden et al. 1998). Thus, whether an oil spill occurs in winter or during the warmer ice melting season has important implications for the biodegradation of hydrocarbons. In winter, chances are that sea ice would be impermeable because the temperature can drop below -5 °C (Junge et al. 2004). This means that oil spilled on the ice cover would not percolate and be in contact with bottom-ice bacterial
communities, thereby limiting biodegradation. However, if some oil was floating at the ice-water interface, it could reach the lowermost part of the ice where the temperature remains near to the seawater freezing point of -1.8 °C (Notz & Worster 2009).
Field observations indicate that oil spilled in calm seas spreads out under the ice where it gradually fills depressions (Fingas & Hollebone 2003). Our results imply that bacteria in these cavities and growing close to the ice-water interface should be capable of biodegradation during winter. Bacteria were shown to be active in the upper water column even in winter, but rates were low at < 0.05 mg C m-3 d-1 (Garneau et al. 2008). Assuming the oil reaches the ice-water interface, biodegradation rates could be higher than the ones measured in the microcosms because bottom-ice DOC and EPS concentrations are very low in winter (Riedel et al. 2008), as well as the primary producer biomass (< 0.04 mg chl a m-3; Garneau et al. 2008). In such carbon-limiting conditions, oil additions could enhance bacterial production.
It is unclear if under-ice biodegradation during cold seasons could be significant. Limited oil biodegradation was found under a winter ice cover in the St. Lawrence River, a temperate marine
by guest on July 7, 2016
http://femsec.oxfordjournals.org/
system, and was attributed to the low productivity of the microbial communities (Siron et al. 1993). Another study in the Beaufort Sea investigated the movement of oil under first-year ice and showed that oil spilled in October was encapsulated in ice within days, and remained in the bottom 5-10 cm of the first-year ice until February, without apparent degradation (NORCOR Engineering Research Limited 1975). Recent results show that full-depth connectivity between the top and bottom of first-year ice can happen in spring, well before summer melt (Jardon et al. 2013), potentially favoring bacterial degradation in the event of oil release during spring. Therefore, remediation strategies for oil mitigation in the Arctic likely need to vary according to seasonal conditions. Finally, the biodegradation potential of microbial communities in melt ponds formed at the ice-cover surface remains to be determined.
Concluding remarks
The experimental results demonstrate great potential for bioremediation techniques in the Arctic Ocean, whether in sea ice or in the water beneath it. Nutrient concentrations should not be a limiting factor if a small amount of contamination occurs during the pre-bloom period, considering that 94% of the initial hydrocarbons were lost within 2 weeks in our oil-treated microcosms. So far, biostimulation (i.e., supply of limiting resources; Brakstad 2008) has been more successful than bioaugmentation in cold environments because the added microorganisms were stressed by the polar conditions and were outcompeted by indigenous species (Yang et al. 2009). Biostimulation in winter or early spring, when nutrient concentrations in surface water are elevated, will likely have little effect. However, such a technique could be beneficial if used after the phytoplankton bloom period, when the surface water is depleted of nutrients. Likewise, biostimulation could be
efficiently used in case of an accidental release of large amounts of hydrocarbons, which would result in rapid depletion of the available nutrients.
Our results highlight the influence of the natural, ice-algal carbon resources on the activity of oil-degrading bacteria. Hydrocarbon degradation by sub-ice planktonic bacteria under high DOC concentration (i.e. during the phytoplankton bloom), as well as by sea-ice bacteria under low DOC
by guest on July 7, 2016
http://femsec.oxfordjournals.org/
concentration (before the ice-algal bloom), could provide a better understanding of bioremediation during the spring-summer transition. Further studies could also target the oil-degradation functional genes of ice-associated bacteria, as was previously reported for Arctic soils (Yergeau et al. 2012). All this information will provide a finer comprehension of natural oil degradation and help in developing bioremediation strategies for the Arctic.
Acknowledgements
We sincerely thank Anke Reppchen, Michel Poulin, Matthew Dunbar and Julie Champagne for their assistance in the field and laboratory, Gary Wohlgeschaffen, and 3 anonymous referees for constructive comments on the manuscript. We are also grateful to the Hunters and Trappers
Association of Resolute Bay for their continued support, and we appreciated the excellent logistical support of the Polar Continental Shelf Program in Resolute, Nunavut. The authors have no conflict of interest to declare.
Funding
This research was supported by: the Program of Energy Research Development (Portfolio Frontier Oil and Gas, Program 1.2.4); Natural Sciences and Research Council of Canada (Discovery Grant no 327416 to C.M.); and the Natural Resources Canada Polar Continental Shelf Program (Project 107-12 to C.M).
References
Alexander M. Biodegradation and Bioremediation. Ithaca: Gulf Professional Publishing, 1999. Alonso-Sáez L, Sánchez O, Gasol JM et al. Winter-to-summer changes in the composition and
single-cell activity of near-surface Arctic prokaryotes. Environ Microbiol 2008;19:2444–54. AMAP. Assessment 2007: Oil and Gas Activities in the Arctic - Effects and Potential Effects.
Volume 1. Oslo: Arctic Monitoring and Assessment Programme (AMAP), 2010.
by guest on July 7, 2016
http://femsec.oxfordjournals.org/
AMAP. Arctic Climate Issues 2011: Changes in Arctic Snow, Water, Ice and Permafrost. Arctic Monitoring and Assessment Programme (AMAP), 2012.
Amon RMW, Fitznar H-P, Benner R. Linkages among the bioreactivity, chemical composition, and diagenetic state of marine dissolved organic matter. Limnol Oceanogr 2001;46:287–97.
Arrigo KR, Mock T, Lizotte MP. Primary producers and sea ice. Sea Ice. Oxford: Blackwell Publishing, 2010, 283–325.
Aslam SN, Michel C, Niemi A et al. Patterns and drivers of carbohydrate budgets in ice algal assemblages from first year Arctic sea ice. Limnol Oceanogr 2016;61:919–37.
Atlas RM, Bragg J. Bioremediation of marine oil spills: when and when not - the Exxon Valdez experience. Microb Biotechnol 2009;2:213–21.
Atlas RM, Cerniglia CE. Bioremediation of petroleum pollutants. BioScience 1995;45:332–8. Atlas RM, Horowitz A, Busdosh M. Prudhoe crude oil in Arctic marine ice, water, and sediment
ecosystems: degradation and interactions with microbial and benthic communities. J Fish Res
Bd Canada 1978;35:585–90.
Atlas RM. Microbial degradation of petroleum hydrocarbons: an environmental perspective.
Microbiol Rev 1981;45:180–209.
Ausubel FM, Brent R, Kingston RE et al. eds. Short Protocols in Molecular Biology: A
Compendium of Methods from Current Protocols in Molecular Biology. New York: John Wiley
and Sons, 2002.
Bagi A, Pampanin DM, Lanzén A et al. Naphthalene biodegradation in temperate and arctic marine microcosms. Biodegradation 2014;25:111–25.
Bell TH, Yergeau É, Maynard C et al. Predictable bacterial composition and hydrocarbon
degradation in Arctic soils following diesel and nutrient disturbance. ISME J 2013;7:1200–10. Belzile C, Brugel S, Nozais C et al. Variations of the abundance and nucleic acid content of
heterotrophic bacteria in Beaufort Shelf waters during winter and spring. J Mar Syst 2008;74:946–56.
Bowman JS, Rasmussen S, Blom N et al. Microbial community structure of Arctic multiyear sea ice and surface seawater by 454 sequencing of the 16S RNA gene. ISME J 2012;6:11–20.
by guest on July 7, 2016
http://femsec.oxfordjournals.org/
Brakstad OG, Bonaunet K. Biodegradation of petroleum hydrocarbons in seawater at low
temperatures (0–5 °C) and bacterial communities associated with degradation. Biodegradation 2006;17:71–82.
Brakstad OG, Nonstad I, Faksness L-G et al. Responses of microbial communities in Arctic sea ice after contamination by crude petroleum oil. Microb Ecol 2008;55:540–52.
Brakstad OG. Natural and stimulated biodegradation of petroleum in cold marine environments. In: Margesin R, Schinner F, Marx J-C, et al. (eds.). Psychrophiles: From Biodiversity to
Biotechnology. Berlin Heidelberg: Springer-Verlag, 2008, 389–407.
Brinkmeyer R, Knittel K, Jurgens J et al. Diversity and structure of bacterial communities in Arctic versus Antarctic pack ice. Appl Environ Microbiol 2003;69:6610–9.
Canadian Council of Ministers of the Environment. Canadian sediment quality guidelines for the protection of aquatic life: Polycyclic aromatic hydrocarbons (PAHs). Canadian Environmental
Quality Guidelines. Winnipeg: Canadian Council of Ministers of the Environment, 1999.
Clarke KR, Gorley RN. PRIMER V5: User Manual/Tutorial. Plymouth UK: PRIMER-E Limited, 2001.
Clarke KR, Warwick RM. Change in Marine Communities: An Approach to Statistical Analysis
and Interpretation. Plymouth: PRIMER-E Limited, 2001.
Codispoti LA, Kelly V, Thessen A et al. Synthesis of primary production in the Arctic Ocean: III. Nitrate and phosphate based estimates of net community production. Progr Oceanogr
2013;110:126–50.
Cota GF, Legendre L, Gosselin M et al. Ecology of bottom ice algae: I. Environmental controls and variability. J Mar Syst 1991;2:257–77.
Cottrell MT, Kirchman DL. Natural assemblages of marine proteobacteria and members of the Cytophaga-Flavobacter cluster consuming low- and high-molecular-weight dissolved organic matter. Appl Environ Microbiol 2000;66:1692–7.
Das N, Chandran P. Microbial degradation of petroleum hydrocarbon contaminants: an overview.
Biotechnol Res Int 2011;2011:1–13.
Deming JW. Sea ice bacteria and viruses. In: Thomas DN, Dieckmann GS (eds.). Sea Ice. Oxford: Blackwell Publishing, 2010, 247–82.
by guest on July 7, 2016
http://femsec.oxfordjournals.org/