HAL Id: insu-00173352
https://hal-insu.archives-ouvertes.fr/insu-00173352
Submitted on 19 Sep 2007HAL is a multi-disciplinary open access archive for the deposit and dissemination of sci-entific research documents, whether they are pub-lished or not. The documents may come from teaching and research institutions in France or abroad, or from public or private research centers.
L’archive ouverte pluridisciplinaire HAL, est destinée au dépôt et à la diffusion de documents scientifiques de niveau recherche, publiés ou non, émanant des établissements d’enseignement et de recherche français ou étrangers, des laboratoires publics ou privés.
regenerating cutover peatlands.
Rebekka R.E. Artz, Stephen J. Chapman, A.H. Jean Robertson, Jacqueline
M. Potts, Fatima Laggoun-Défarge, Sébastien Gogo, Laure Comont,
Jean-Robert Disnar, Andre-Jean Francez
To cite this version:
Rebekka R.E. Artz, Stephen J. Chapman, A.H. Jean Robertson, Jacqueline M. Potts, Fatima Laggoun-Défarge, et al.. FTIR spectroscopy can predict organic matter quality in regenerating cutover peat-lands.. Soil Biology and Biochemistry, Elsevier, 2008, 40 (2), pp.515-527. �insu-00173352�
1
FTIR spectroscopy can predict organic matter quality in
2regenerating cutover peatlands
3(Running title: Whole soil FTIR on peat) 4
5
Rebekka R.E. Artz1, Stephen J. Chapman1, A.H. Jean Robertson1, Jacqueline M. 6
Potts2, Fatima Laggoun-Défarge3, Sébastien Gogo3, Laure Comont3, Jean-Robert 7
Disnar3 and Andre-Jean Francez4
8 9
1 Soils Group, The Macaulay Institute, Craigiebuckler, Aberdeen, AB15 8QH, UK.
10
2 Biomathematics and Statistics Scotland (BioSS), The Macaulay Institute,
11
Craigiebuckler, Aberdeen AB15 8QH, UK.
12
3 Institut des Sciences de la Terre d'Orléans (ISTO), UMR 6113 CNRS/Université
13
d’Orléans, Bt Géosciences, Rue de St Amand, BP 6759, 45067 Orléans cedex 2,
14
France.
15
4 Interactions biologiques et transferts de matières, UMR CNRS 6553 Ecobio,
16
Université de Rennes 1, 35042 Rennes cedex, France.
17 18
Date of receipt: 19
Keywords: Fourier-Transform Infrared Spectroscopy, peat, organic matter quality,
20
carbohydrates, C:N ratio, organic micro-remains
21 22 23
Corresponding author: Rebekka R.E.Artz, The Macaulay Institute, fax: (+44) (0)1224
24
498207; e-mail: [email protected]
25
Abstract 26
Vegetational changes during the restoration of cutover peatlands leave a legacy 27
in terms of the organic matter quality of the newly formed peat. Current efforts 28
to restore peatlands at a large scale therefore require low cost, and high 29
throughout, techniques to monitor the evolution of organic matter. In this study, 30
we assessed the Fourier Transform Infrared (FTIR) spectra of the organic 31
matter in peat samples at various stages of peatland regeneration from five 32
European countries. Using predictive partial least squares analyses, we were able 33
to reconstruct both peat C:N ratio and carbohydrate signatures, but not the 34
micromorphological composit ion of vegetation remains, from the FTIR datasets. 35
Despite utilising different size fractions, both carbohydrate (< 200 µm fraction) 36
and FTIR (bulk soil) analyses report on the composition of plant cell wall 37
constituents in the peat and therefore essentially reveal the composition of the 38
parent vegetational materia l. This suggests that FTIR analysis of peat may be 39
used successfully for evaluation of the present and future organic matter 40
composition of peat in monitoring of restoration efforts. 41
42
1. Introduction 43
Northern Peatlands are composed almost entirely of decomposing plant 44
material and store approximately a third of all soil organic matter (Gorham, 1991) 45
even though their total cover only extends to 3-5 % of the global land area. Peat 46
extraction for fuel and horticultural use has steadily diminished this carbon stock, 47
with the largest quantities of peat having been extracted in the mid to late 20th century
48
(Chapman et al., 2003). Various restoration programs have since been designed to 49
encourage revegetation of cut-over peatlands (Gorham and Rochefort, 2003). 50
Although some of these programs have demonstrated that annual gaseous emissions 51
show a return to net carbon sequestration (Tuittila et al., 1999) or at least reduce net 52
emissions (Waddington and Warner, 2001), it is not known how peatland restoration 53
affects the pool of soil organic matter and hence the long-term regeneration of the 54
carbon sequestration potential. Increased losses of dissolved organic carbon (DOC) 55
have been observed from many peatland ecosystems in the past decades (Freeman et 56
al., 2001), and some of this can be ascribed to increased turnover of the soil organic 57
matter (Glatzel et al., 2003). Currently, monitoring efforts of the evolution of soil 58
organic matter quality during restoration of peatlands have only a limited array of 59
tools. Generally, bulk measures such as total and soluble organic carbon and nitrogen, 60
and their ratios, have been most often used to assess restoration success (Andersen et 61
al., 2006; Comont et al., 2006). Similarly, a technique often employed in peat organic 62
matter compositional studies is analysis of the patterns of carbohydrate monomers 63
derived from plant cellulose and hemicelluloses as these are indicative of the source 64
plant composition and the preservation status of these remains (Cheshire, 1979; Moers 65
et al., 1989, 1990; Bourdon et al., 2000). Comont et al., (2006) used peat C:N ratios 66
combined with micromorphological and carbohydrate composition of peat in a 67
pioneering study to elucidate the evolution of organic matter with regeneration. These 68
techniques, however, are expensive and time consuming processes. FTIR 69
spectroscopy is a commonly used technique capable of distinguishing the principal 70
chemical classes in soil organic matter, such as carbohydrates, lignins, cellulose, fats 71
and/or lipids and proteinaceous compounds, through the vibrational characteristics of 72
their structural chemical bonds.The use of attenuated total reflectance accessories, in 73
particular those utilising very hard crystals such as diamond, has further advanced the 74
use of FTIR in soils and other solid residues. Dilution with KBr is no longer 75
necessary, reproducibility is increased and the nondestructive nature of this analysis 76
allows the sample to be re-used for other analyses. FTIR spectroscopy has been used 77
successfully on whole soils to describe the status of decomposition in different 78
horizons (Haberhauer et al., 1998, 1999; Chapman et al., 2001), for example through 79
following the reduction of the carbohydrate markers with depth. Using multivariate 80
statistics, FTIR data can be used as quantitative indicators of the composition of the 81
soil organic matter to distinguish soil horizons (Haberhauer et al., 1999, 2000). 82
Models utilising partial least squares (PLS) analysis have been applied to FTIR data 83
to predict various chemical and physical qualities of organic materials, including 84
studies of the lignin and carbohydrate contents of wood and woody peat (Durig et al., 85
1988; Tucker et al., 2001; Bjarnestad and Dahlman, 2002) and the phenolic and 86
carbohydrate contents of food (e.g. Coimbra et al., 2005). This study investigated the 87
potential use of FTIR spectroscopy data as indicators of peat organic matter quality in 88
regenerating peatlands. We determined various chemical and micromorphological 89
characteristics of peat samples from profiles at sites at different stages of regeneration 90
from five cutover European peatlands and tested the power of partial least squares 91
analysis using FTIR data to predict these organic matter characteristics. In large scale 92
restoration projects, it would be advantageous to be able to use low cost and high 93
throughput techniques in order to assess the success of restoration efforts. Our results 94
are therefore discussed with respect to the utility of FTIR spectroscopy coupled to 95
predictive PLS in the assessment of organic matter quality with peatland regeneration. 96
97
2. Materials and Methods 98
2.1. Sampling procedure
99
Sites within gradients of unaided regeneration were selected in previously cut-100
over peatlands in five countries in Europe (Table 1). Cores (n = 3) were obtained from 101
each site with a double-skinned peat corer (to avoid compaction) and were sectioned 102
into 4 horizons of different stages of decomposition. The horizons were designated 103
horizons 3 (surface layer 0-5 cm), 4 (5-10 cm), 6 (22.5-27.5 cm) and 8 (42.5 to 47.5 104
cm). Core samples were cut into 1 cm3 subsamples and the subsamples mixed to 105
ensure homogeneity. Portions were shipped on ice packs to partner laboratories for the 106
relevant analyses contributing to this study. For the purpose of this comparative study, 107
only a single replicate from each Country x Site x Horizon combination was analysed 108
for all analytes. Samples where not all analyses could be completed due to low sample 109
size were excluded from statistical analyses, reducing the dataset for statistical 110 analyses to n = 68 (Table 1). 111 112 2.2. FTIR spectroscopy 113
Spectral characterisation of peat samples was performed by diamond 114
attenuated total reflectance FTIR spectroscopy using a Nicolet Magna-IR 550 FTIR 115
spectrometer (Thermo Electron, Warwick, U.K.) fitted with a potassium bromide 116
beam splitter and a deutroglycine sulphate detector. A Diamond Attenuated Total 117
Reflectance (DATR) accessory, with a single reflectance system, was used to produce 118
transmission-like spectra. The samples were dehydrated by freeze drying and 119
powdered by ball milling with zirconium balls. Samples were placed directly on a 120
DATR/KRS-5 crystal and a flat tip powder press was used to achieve even 121
distribution and contact. Spectra were acquired by averaging 200 scans at 4 cm-1
122
resolution over the range 4000 – 350 cm-1. A correction was made to spectra for the 123
ATR to allow for differences in depth of beam penetration at different wavelengths 124
(Omnic software, version 7.2, Thermo Electron). All spectra were also corrected for 125
attenuation by water vapour and CO2. Minor differences in the amplitude and baseline
126
between runs were corrected by normalisation of the data by subtraction of the sample 127
minimum followed by division by the average of all data points per sample. First and 128
second derivatives were calculated to determine and test correlations of organic matter 129
variables which formed ‘shoulders’ rather than distinct peaks in the FTIR profiles. 130
131
2.3. Micromorphological analysis
132
Micromorphological identification and quantification of peat microremains 133
were carried out using a DMR XP Leica photonic microscope under transmitted light. 134
Wet bulk peat samples were mounted as smearslides and analysed with ×20 and ×50 135
objectives. The surfaces of the main categories were counted (in relative numeric 136
frequencies) through a grid reticule, used as surface unit, and placed on the 137
microscope ocular. Three thousand to 5000 items per sample were counted with an 138
estimated counting error of about 10%. 139
140
2.4. C and N determination
141
Carbon and nitrogen contents were determined by combustion at 1100°C with 142
a CNS-2000 LECO apparatus, on dried and crushed peat samples. Due to the total 143
lack of carbonates, total carbon (TC) was assumed to be total organic carbon (TOC). 144
145
2.5. Characterisation of carbohydrate signatures
146
Carbohydrate analyses were generally performed on fine-grained peat 147
fractions (<200 µm, isolated by wet-sieving at 200 µm under positive pressure using 148
water circulation), although bulk peat samples were also analysed in some cases, for 149
comparison. Cellulosic and hemicellulosic sugars were identified and quantified by 150
gas chromatography after appropriate hydrolysis. Total sugars were determined by 151
hydrolysis after treatment with concentrated acid (see below) whereas labile 152
(hemicellulosic) sugars were determined independently without this treatment. 153
Cellulosic sugars where determined by difference between the total and 154
hemicellulosic sugars. A detailed procedure is given in Comont et al. (2006). Briefly: 155
for total sugar determination, 1 ml of 24 N H2SO4 was added to 100 mg sample dry
156
weight. After 12 h at room temperature, samples were diluted to 1.2 M H2SO4 and
157
heated at 100°C for 4 h (hemicellulosic sugar analysis begins directly at this 158
hydrolysis stage). After cooling, deoxy-6-glucose was added as an internal standard 159
and samples were neutralised with CaCO3. Precipitate was discarded removed
160
following centrifugation and the supernatant evaporated to dryness. After 161
resuspension in methanol, the solution was purified by centrifugation and the 162
supernatant transferred and evaporated under vacuum. The resulting carbohydrates 163
were dissolved in trimethylsilylated pyridine (Sylon BFT, Supelco) and immediately 164
analysed by GC-FID using a 25 m x 0.25 mm CPSil5CB (0.25 µm film thickness) 165
column. Oven settings were as follows: an initial oven temperature (60°C) was 166
ramped at 30°C min-1 to 120°C where it was maintained for 1 min, then ramped to 167
240°C at 3°C min-1 and finally at 20°C min-1 up to 310°C where it was maintained for
168
10 min. The injector split was off at the start time and turned on after 2 min. The 169
injector and detector were maintained at 240°C and 300°C, respectively. A mixture of 170
eight monosaccharides (ribose, arabinose, xylose, rhamnose, fucose, glucose, 171
mannose and galactose) was used as an external standard for compound identification 172
through peak retention times and for individual response coefficient determination. 173
174
2.6. Statistical analyses
175
All statistical analyses were performed using Genstat for Windows (8th 176
edition, VSN International). FTIR spectral data in the diamond interference region 177
(2200-1900 cm-1) were excluded from analyses. Relationships between FTIR spectra 178
(‘x’ variate, as zero, first and second order derivatives) and the corresponding organic 179
matter (micromorphological and carbohydrate signature) datasets as well as carbon 180
and nitrogen contents and their ratios (‘y’ variates) were assessed using partial least 181
squares (PLS) analyses. We investigated both each parameter separately in univariate 182
PLS and also within multivariate datasets in multivariate PLS, with leave-one-out 183
validation. The Genstat procedure returned the number of latent roots (dimensions), 184
the predicted residual error sum of squares (PRESS), percentage of variance explained 185
and PLS loadings. The number of roots for each PLS analysis was set at the number 186
that returned minimum PRESS. The root mean square error of cross-validation 187
(RMSECV) was calculated from PRESS using the square root of PRESS/n. 188
Significance levels were estimated using Osten’s F-test. Assessment of the predictive 189
qualities of PLS was performed by principal component analysis (PCA) of the 190
observed and predicted values for both micromorphological analyses and plant-191
derived carbohydrate monomer signatures. 192
193
3. Results 194
3.1. Patterns of FTIR carbon chemistry signatures
195
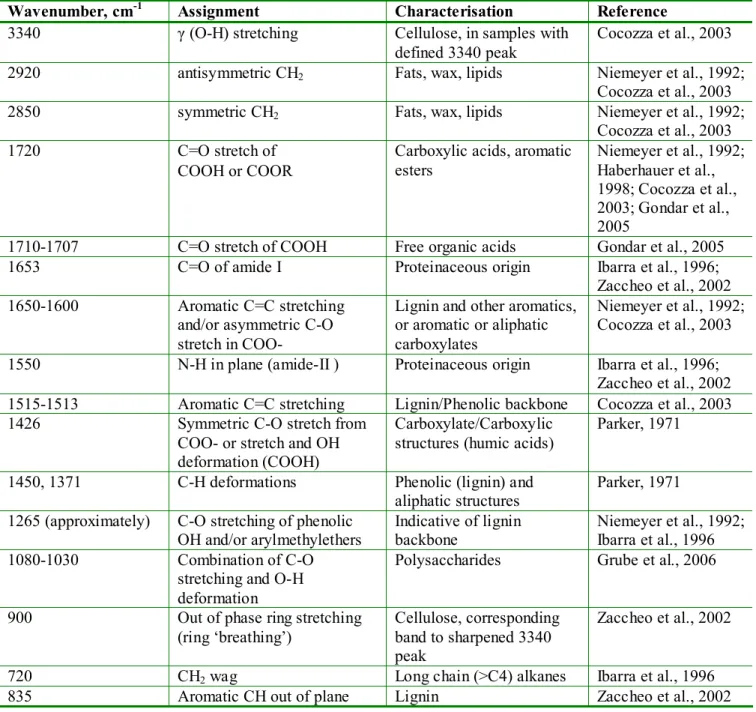
Sample characterisation using FTIR spectroscopy concerned the correct 196
assignment of the observed spectral characteristics to the most likely origin of the 197
absorption bands. A summary of the most characteristic bands observed in peat and 198
their assignment is presented in Table 2. Generally, FTIR analysis on the peat horizon 199
samples showed a decline of the main polysaccharide markers (absorption bands 200
around 3400 and 1040 cm-1) and relative increase of the main bands assigned to 201
lignin-like (1513, 1450, 1371, 1265 and 835 cm-1 ) and aliphatic structures (2920 and
202
2850 cm-1) with depth, as expected with increasing humification. Figure 1 shows an 203
example from a Scottish peat core at an advanced stage of regeneration. Spectral 204
bands indicative of ‘carboxylates’, which include contributions from vibrations of 205
aromatic and aliphatic carboxylates (R-COO¯) and/or aromatic C=C structures also 206
increased in relative terms with depth (1650-1600 and 1426 cm-1). 207
208
3.2. PLS calibrations with chemical and organic matter parameters
209
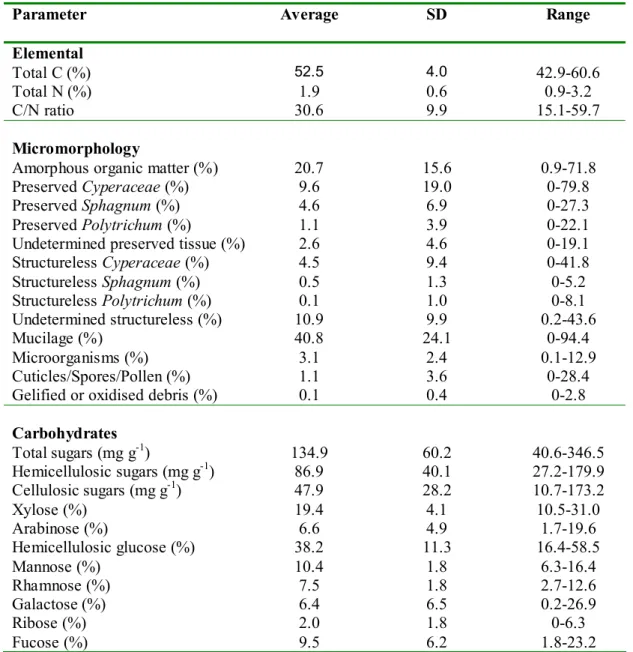
The FTIR data were assessed against the data obtained from organic matter 210
analyses (variation of the original data shown in Table 3) using both univariate and 211
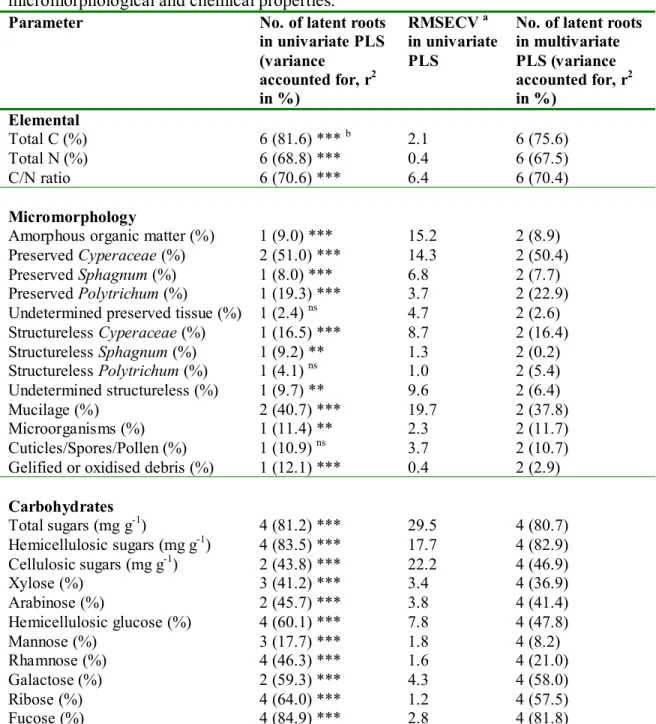
multivariate PLS analyses. In the cases of the elemental and carbohydrate analyses, 212
the percentage variance explained was > 60% for the majority of the analytes (Table 213
4) and all were highly significant in PLS of the zero order FTIR data. PLS using the 214
first or second derivative did increase the percentage variance explained, but only 215
marginally (data not shown). The RMSECV values (Table 4) were generally lower 216
than the standard deviation of the original datasets (Table 3). Total C content was 217
associated with positive loadings in the main polysaccharide envelopes at 3300 and 218
1030 cm-1 and negative loadings of the wax markers at 2920 and 2850 cm-1 (Fig. 2A). 219
Total N content was associated with positive loadings in the bands representing the 220
amide I and II regions (Table 2) as previously reported by Chapman et al (2001) and 221
there an additional negative correlation with the wax markers at 2920 and 2850 cm-1 222
(Fig 2B). The loading plots for hemicellulosic sugars (Fig 2C) showed a similar 223
positive relationship with the main polysaccharide bands but there was also a strong 224
negative relationship with the carboxylate marker region. Loadings generated for 225
fucose (Fig 2D) primarily demonstrated a strong negative correlation with the wax 226
markers at 2920 and 2850 cm-1.
227
In some cases, the differences in loadings were more subtle. For example, the 228
PLS loadings for mucilage were visually very similar to those of total C content (not 229
shown). We therefore also examined the relative differences in PLS loadings between 230
organic matter parameters using subtraction. Examples of relative differences in PLS 231
loadings are shown in Fig 3. The relative difference in PLS loadings between those 232
generated for mucilage and those for total C (Fig 3A) showed that both the main 233
polysaccharide envelope around 1100 cm-1 and the wax markers (2920 and 2850 cm-1) 234
were less discriminatory for prediction of mucilage content than for total C. Similarly, 235
for the prediction of structureless Cyperaceae versus preserved Cyperaceae, the wax 236
marker bands and various other bands indicative of more humified tissue (1710-1707, 237
1650-1600, and 1515-1513 cm-1) were more discriminatory (Fig 3B). For most neutral 238
sugars, however, the main discriminatory region was within the main 1200-800 cm-1 239
polysaccharide envelope (Fig 3C-F). Within this polysaccharide envelope, there were 240
subtle differences in the bands which contributed more or less to the discrimination 241
between different neutral sugars. 242
243
3.3. Predictive PLS of FTIR spectra as a tool in organic matter studies of
244
regenerating peatlands
245
To assess the potential of predictive PLS of FTIR spectra for organic matter 246
parameters, we reconstructed the composition of the organic matter datasets (i.e. 247
micromorphological fingerprints, carbohydrate signatures) using the PLS outputs. 248
Examples of the changes of the organic matter parameters and correlation with the 249
predicted values with depth are shown for two contrasting sites of the peatland at Le 250
Russey, France (Fig. 4). The fitted and observed values were in close agreement for 251
the carbohydrate parameters. 252
Over the entire dataset of 68 samples from all sites in Europe, values for the 253
observed versus predicted C:N ratio’s were highly correlated and linear regression 254
explained 70.6 % of the variance (Fig 5A). To test whether PLS analyses were 255
adequate in predicting the organic matter composition of each of the peat samples, we 256
combined the predicted values from univariate PLS analyses for each subset of 257
multivariate organic matter analyses (i.e. micromorphological and carbohydrates) and 258
analysed these reconstructed organic matter datasets using PCA. We subsequently 259
compared them to PCA of the observed OM characteristics using linear regression of 260
the 1st principal components (Fig. 5B and C). Linear regression explained 51.0 and
261
82.1 % of the variance in comparisons of the first principal components of the 262
micromorphological and carbohydrate composition obtained by univariate PLS 263
models, respectively (Fig. 5B and C). We also tested the predicted values of 264
multivariate PLS. The regressions of multivariate PLS explained a marginally lower 265
percentage of the variance in the datasets (data not shown). The first principal 266
components of the carbohydrate datasets explained the majority of the variance in 267
both the observed and fitted datasets (88.7 and 94.9 %, respectively). The observed 268
strength of the regression therefore indicates that PLS is able to predict the 269
carbohydrate signature of a wide range of peat samples. 270
271
4. Discussion 272
4.1. FTIR spectral characteristics and the potential effect of spectral interferences on
273
PLS models
274
We observed a few samples which showed spectral interference from silicate 275
minerals. A notable example is shown in Fig 1A in the Scottish sample from an 276
advanced stage of regeneration at horizon 6 (22.5-27.5 cm depth), which shows the 277
diagnostic peaks at 3700 and 467 cm-1 of kaolinite. Where mineral interferences 278
manifest themselves in samples obtained from deeper horizons, they may have 279
originated from wind-blown material from nearby exposed mineral surfaces during 280
the formation of the peatlands. We also observed spectral signals from silicate 281
minerals in a few surface samples from sites on, or close to, nearly exhausted 282
peatlands. Mineral interference also manifests itself in the 1030 cm-1 polysaccharide 283
band (Farmer, 1974) and could therefore potentially skew the accuracy of prediction 284
of the polysaccharide markers. Other notable results were the low relative absorption 285
values in the 1707 cm-1 region in the samples from the Baupte peatland (data not 286
shown). Peat samples from Baupte had consistently higher pH values and we 287
therefore attributed this lack of absorption in the 1707 cm-1 region to the majority of 288
acids being present in the carboxylate form. A reduction in intensity of the 1720 cm-1
289
absorption band with increasing pH values was been previously shown in FTIR 290
analyses on peat samples where the sample pH was moderated (Gondar et al., 2005). 291
In low pH environments however, for example as observed in the profile of the 292
Scottish peat samples (e.g. Fig.1), this variation is related to peat decomposition rather 293
than pH changes and increases in intensity of this band illustrate progressive free acid 294
release with increasing humification. Analysis without samples that were 295
characterised by spectral interference by silicate minerals, or those with elevated pH 296
values, did not increase the amount of variability explained by PLS (data not shown). 297
298
4.2. Principal calibrations
299
Infrared spectroscopic data from peat samples, both in the mid and near IR 300
ranges, have been used previously to predict various organic matter parameters. Good 301
correlations by PLS between various parameters such as total C and N, pH, ash 302
content, total organic matter etc, and IR analyses of organic soils have been shown on 303
numerous occasions (Palmborg and Nordgren, 1993; Chapman et al., 2001; Tremblay 304
and Gagne, 2002, Couteaux et al., 2003). Some studies have attempted to predict a 305
small range of functional chemical signatures of peat, such as relative concentrations 306
of amino acids and amino sugars (Holmgren and Norden, 1988) or humic and fulvic 307
acids (Tremblay and Gagne, 2002). The use of ATR accessories produces more 308
consistent data and the use of an additional water correction has been shown to 309
increase the accuracy of total C predictions (Tucker et al., 2001). A possible reason 310
for the generally poor relationships of FTIR data with micromorphological analyses 311
may be the size of sample used in direct microscopic analysis compared to the use of 312
a homogenised sample as for FTIR spectroscopy. Another possible factor is the three-313
dimensionality of the chemical analyses (as these are based on mass), compared to 314
micromorphological analyses which essentially extrapolate the mass of microremains 315
based on the area they occupy within smearslides. The variance explained by PLS 316
with some of the more prevalent tissues observed (e.g. proportion of preserved 317
Cyperaceae and mucilage) are generally more encouraging (Table 4). Other reports
318
have, however, shown the ability to separate major vegetational differences using near 319
infrared spectroscopy, where the authors were able to build good PLS models with 320
high levels of explained variance for the content of leaf material from Ericales and 321
Sphagnum spp. in a single peat core sectioned to 1 cm samples (McTiernan et al.,
322
1998). In the near infra-red, the vibrational characteristics of the N-H and O-H stretch 323
regions are more separated, while the mid-IR is dominated by the O-H stretch regions. 324
Use of data from near infrared analyses may therefore improve the prediction of 325
organic matter parameters. 326
We also observed cases where the variance explained within the carbohydrate 327
parameters was rather low (Table 4). The carbohydrate chemistry was assessed on the 328
fine fraction (< 200 micron) because this size fraction offers greater sensitivity as it is 329
composed of the biodegraded plant material admixed with products of secondary 330
microbial production. The bulk fraction signature is effectively ‘swamped’ by intact 331
or only partially degraded plant tissues (Comont et al., 2006). This may, however, 332
also offer an explanation for the relatively low variance explained for the total 333
cellulosic sugar content as well as the relative amounts of arabinose and xylose by 334
PLS on the bulk sample derived FTIR data. The latter monomers are the principal 335
biomarkers of sedges (e.g. Cyperaceae; Moers et al., 1989; Comont et al., 2006), 336
which in most samples appear to be the dominant preserved tissues (Table 3). 337
Similarly, single correlations for each of the principal biomarkers of intact 338
bryophytes, mannose, rhamnose and galactose (Popper and Fry, 2003) were rather 339
poor (Table 3). FTIR spectroscopy has been successfully used previously to predict 340
the neutral sugar monomers of plant cell wall polysaccharides in foodstuffs, including 341
such monomers as those described as vegetation biomarkers in peatlands. Examples 342
are prediction of mannose content (from mannans and mannoproteins) in wines 343
(Coimbra et al., 2005) and xylose content from olive pulp polysaccharides (Coimbra 344
et al., 1999). That we were able to successfully reassemble the neutral sugar profiles 345
(Fig. 5) of a large variety of peatland samples from five European locations with large 346
differences in plant cover and degree of decomposition despite observing low 347
correlation of each principal monomer with FTIR spectra may at first seem puzzling. 348
Kačuráková et al. (2000) investigated individual plant cell wall compounds (pectic 349
polysaccharides, hemicelluloses and monosaccharides) by FTIR spectrocopy and were 350
able to determine spectral marker regions for a large number of these compounds 351
within the 1200-800 cm-1 region. They attributed the main differences to both C-OH 352
relative steric positions within the monomer side chains as well as the vibrational 353
characteristics of the pyranose backbones. Carbohydrate analysis reports on the 354
individual components of each (hemi)cellulose type present in the more biologically 355
decomposed size fractions, whereas the FTIR spectra report on the spectral properties 356
of both the side-chain monomers and the pyranose backbones. In agreement with 357
Kačuráková et al., we showed in this study that the spectral markers within the 1200-358
800 cm-1 region were discriminatory for the relative differences in PLS prediction 359
between neutral sugars (Fig. 3). The correlation of the multivariate datasets is 360
therefore most likely explained by both methodologies essentially reporting on the 361
original composition of the parent vegetational material. 362
363
4.3. Predictive potential of peat FTIR-based PLS models and applications in
364
restoration monitoring
365
The main strength of this study is the ability to satisfactorily reconstruct (Fig. 366
5) the relative differences between peat samples from different stages of regeneration 367
and from widely differing locations with their associated differences in vegetation 368
structures, and hence micromorphological and chemical composition. In peatland 369
restoration projects, it is often difficult to ascertain the regeneration boundary, i.e. the 370
interphase between the cut horizon of remaining catotelm and the accumulated 371
organic matter during regeneration. The C:N ratio and micromorphological 372
composition of peat have been previously used as an indicator of this regeneration 373
boundary by Comont et al., (2006). The composition of carbohydrate monomers is 374
also indicative of the origin of the OM (i.e. vegetation-type specific, Moers et al., 375
1989: Wicks et al., 1991) and fucose has been proposed as an indicator of microbially 376
produced polysaccharide monomers (Murayama et al., 1988; Comont et al., 2006). A 377
simple ratio of the polysaccharide to carboxylate FTIR band intensity has previously 378
been shown to explain 68.7 % of the community catabolic response to a suite of 379
simple carbon sources (Artz et al., 2006) and other studies have shown good 380
predictive properties of PLS analyses on FTIR and NIR data with microbial biomass 381
(Chapman et al., 1998; Couteaux et al., 2003). There are other reports where IR data 382
have been used in prediction of various organic matter parameters such as cellulose 383
content and cellulose decomposition rates (Hartmann and Appel, 2006) or the relative 384
quantities of phenolic compounds and leaf litter decomposition rates (Stolter et al., 385
2006). The botanical composition of peat, i.e. the composition of litter entering the 386
organic matter pool, has been implicated in the degree of decomposition on numerous 387
occasions (Verhoeven and Toth, 1995; Belyea, 1996; Frolking et al., 2001) and 388
therefore the composition of the organic matter in restored peatlands may be critical to 389
their long term carbon sequestration potential. Indeed, Andersen et al. (2006) showed 390
that the substrate quality (in terms of availability of N, P and soluble organic carbon) 391
of the organic matter in vegetational successions on cutover peatlands was related to 392
the evolution of the total microbial biomass and their respiration activity. Therefore, 393
monitoring of restoration projects should include evaluations whether organic matter 394
parameters return to values more closely resembling intact peatland systems. FTIR 395
spectroscopy coupled with predictive PLS analysis may be a useful, low-cost, 396
addition to the toolbox in the assessment and monitoring of restoration success in 397
peatland ecosystems. 398
399 400
Acknowledgements
This work was part of the RECIPE initiative, funded through a grant by the EU Framework 5. SJC is funded by the Scottish Executive Environment and Rural Affairs Department. The authors gratefully acknowledge analytical assistance provided by M. Hatton and N. Lottier. We would like to thank Dr. David Elston (BioSS) and Dr. Charlie Shand (Macaulay Institute) for constructive comments on this manuscript.
References
Andersen, R., Francez, A.-J., Rochefort, L., 2006. The physicochemical and microbiological status of a restored bog in Québec: Identification of relevant criteria to monitor success. Soil Biology and Biochemistry 38, 1375-1387.
Artz, R.R.E., Chapman, S.J., Campbell, C.D. 2006. Substrate utilisation profiles of microbial communities in peat are depth dependent and correlate with whole soil FTIR profiles. Soil Biology and Biochemistry 38, 2958-2962.
Bjarnestad, S., Dahlman, O. 2002. Chemical compositions of hardwood and softwood pulps employing photoacoustic Fourier transform infrared spectroscopy in combination with partial least-squares analysis. Analytical Chemistry 74, 5851-5858.
Belyea, L.R. 1996. Separating the effects of litter quality and microenvironment on decomposition rates in a patterned peatland. Oikos 77, 529-539.
Bourdon, S., Laggoun-Défarge F., Disnar, J.-R., Maman, O., Guillet, B., Derenne, S., Largeau, C., 2000. Organic matter sources and early diagenetic degradation in a tropical peaty marsh (Tritrivakely, Madagascar). Implications for environmental reconstruction during the Sub-Atlantic. Organic Geochemistry 31, 421-438.
Chapman, S.J., Buttler, A., Francez, A.-J., Laggoun-Defarge, F., Vasander, H., Schloter, M., Combe, J., Grosvernier, P., Harms, H., Epron, D., Gilbert, D., Mitchell, E.A.D. 2003. Exploitation of northern peatlands and biodiversity maintenance: a conflict between economy and ecology. Frontiers in Ecology and Environment 1, 525-532.
Chapman, S.J., Campbell, C.D., Fraser, A.R., Puri, G., 2001. FTIR spectroscopy of peat in and bordering Scots pine woodland: relationships with chemical and biological properties. Soil Biology and Biochemistry 33, 1193-1200.
Cheshire, M.V. 1979. Nature and origin of carbohydrates in soil. Academic Press, London.
Cocozza, C., D'Orazio, V., Miano, T.M., Shotyk, W. 2003. Characterization of solid and aqueous phases of a peat bog profile using molecular fluorescence spectroscopy, ESR and FT- IR, and comparison with physical properties. Organic Geochemistry 34, 49-60.
Coimbra, M.A., Barros, A.S., Coelho, E., Goncalves, F., Rocha, S.M., Delgadillo, I. 2005. Quantification of polymeric mannose in wine extracts by FT-IR spectroscopy and OSC-PLS1 regression. Carbohydrate Polymers 61, 434-440. Coimbra, M.A., Barros, A.S., Rutledge, D.N., Delgadillo, I. 1999. FTIR spectroscopy
as a tool for the analysis of olive pulp cell-wall polysaccharide. Carbohydrate Research 317, 145-154.
Comont, L., Laggoun-Défarge, F., Disnar, J.-R. 2006. Evolution of ogranic matter indicators in reponse to major environmental changes : the case of a formerly cutover peatbog (Le Russey, Jura Mountains, France). Organic Geochemistry (In press).
Couteaux, M.M., Berg, B., Rovira, P. 2003. Near infrared reflectance spectroscopy for determination of organic matter fractions including microbial biomass in coniferous forest soils. Soil Biology and Biochemistry 35, 1587-1600.
Durig, D.T., Esterle, J.S., Dickson, T.J., Durig, J.R. 1988. An Investigation of the Chemical Variability of Woody Peat by FT-IR Spectroscopy. Applied Spectroscopy 42, 1239-1244
Farmer, V.C. The Infrared spectra of minerals. Mineralogical Society Monograph 4. Mineralogical Society London, 1974.
Freeman, C., Evans, C.D., Monteith, D.T., Reynolds, B., Fenner, N., 2001. Export of organic carbon from peat soils. Nature 412, 785.
Frolking, S.E., Bubier, J.L., Moore, T.R., Ball, T., Bellisario, L.M., Bhardwaj, A., Carroll, P., Crill, P. M., Lafleur, P. M., McCaughey, J. H., Roulet, N. T., Suyker, A., Verma, S. B., Waddington, J. M., Whiting, G. J. 1998. Relationship between ecosystem productivity and photosynthetically active radiation for northern peatlands. Global Biogeochemical Cycles 12, 115-126. Glatzel, S., Kalbitz, K., Dalva, M., Moore, T., 2003. Dissolved organic matter
properties and their relationship to carbon dioxide efflux from restored peat bogs. Geoderma 113, 397-411.
Gondar, D., Lopez, R., Fiol, S., Antelo, J.M., Arce, F. 2005. Characterization and acid-base properties of fulvic and humic acids isolated from two horizons of an ombrotrophic peat bog. Geoderma 126, 367-374.
Gonzalez, J.A., Gonzalez-Vila, F.J., Almendros, G., Zancada, M.C., Polvillo, O., Martin, F. 2003. Preferential accumulation of selectively preserved biomacromolecules in the humus fractions from a peat deposit as seen by analytical pyrolysis and spectroscopic techniques. Journal of Analytical and Applied Pyrolysis 68, 287-298.
Gorham, E., 1991. Northern peatlands: Role in the carbon cycle and probable responses to climatic warming. Applied Soil Ecology 1, 182-195.
Gorham, E., Rochefort, L. 2003. Peatland restoration: A brief assessment with special reference to Sphagnum bogs. Wetlands Ecology and Management 11, 109-119. Guo,Y., Bustin, R.M. 1998. FTIR spectroscopy and reflectance of modern charcoals
and fungal decayed woods: implications for studies of inertinite in coals. International Journal of Coal Geology 37, 29-53.
Haberhauer, G., Feigl, B., Gerzabek, M.H., Cerri, C. 2000. FT-IR spectroscopy of organic matter in tropical soils: Changes induced through deforestation. Applied Spectrocopy 54, 221-224.
Haberhauer, G., Gerzabek, M.H., 1999. Drift and transmission FT-IR spectroscopy of forest soils: an approach to determine decomposition processes of forest litter. Vibrational Spectroscopy 19, 413-417.
Haberhauer, G., Rafferty, B., Strebl, F., Gerzabek, M.H., 1998. Comparison of the composition of forest soil litter derived from three different sites at various decompositional stages using FTIR spectroscopy. Geoderma 83, 331-342.
Hartmann, H.P., Appel, T. 2006. Calibration of near infrared spectra for measuring decomposing cellulose and green manure in soils. Soil Biology and Biochemistry 38, 887-897.
Holmgren, A., Norden, B. 1988. Characterization of peat samples by diffuse reflectance FT-IR spectroscopy. Applied Spectroscopy 42, 255-262.
Ibarra, J.V., Munoz, E., Moliner, R. 1996. FTIR study of the evolution of coal structure during the coalification process. Organic Geochemistry 24, 725-735.
Kačuráková, M., Capek, P., Sasinkova, V., Wellner, N., Ebringerova, A. 2000. FT-IR study of plant cell wall model compounds: pectic polysaccharides and hemicelluloses. Carbohydrate Polymers 43, 195-203.
McTiernan, K.B., Garnett, M.H., Mauquoy, D., Ineson, P., Couteaux, M.M. 1998. Use of near-infrared reflectance spectroscopy (NIRS) in palaeoecological studies of peat. Holocene 8, 729-740.
Moers, M.E.C., Baas, M., de Leeuw, J.W., Boon, J.J., Schenck, P.A., 1990. Occurrence and origin of carbohydrates in peat samples from a red mangrove environment as reflected by abundances of neutral monosaccharides. Geochimica et Cosmochimica Acta 54, 2463-2472.
Moers, M.E.C., Boon, J.J., de Leeuw, J.W., Baas, M., Schenck, P.A. 1989. Carbohydrate speciation and Py-MS mapping of peat samples from a subtropical open marsh environment. Geochimica et Cosmochimica Acta 53, 2011-2021. Murayama, S., 1988. Microbial synthesis of saccharides in soils incubated with 13
C-labelled glucose. Soil Biology and Biochemistry 20, 193-199.
Niemeyer, J., Chen, Y., Bollag, J.M. 1992. Characterization of humic acids, composts, and peat by diffuse reflectance Fourier-Transform infrared-spectroscopy. Soil Science Society of America Journal 56, 135-140.
Palmborg, C., Nordgren, A. 1993. Modelling microbial activity and biomass in forest soil with substrate quality measured using near infrared reflectance spectroscopy. Soil Biology and Biochemistry 25, 1713-1718.
Parker, F.S. Applications of infrared spectroscopy in biochemistry, biology and medicine. Adam Hilger, London, 1971.
Popper Z.A., Fry S.C., 2003. Primary cell wall composition of bryophytes and charophytes. Annals of Botany 91, 1-12.
Stolter, C., Julkunen-Tiitto, R., Ganzhorn, J. 2006. Application of near infrared reflectance spectroscopy (NIRS) to assess som properties of a sub-arctic ecosytem. Basic and Applied Ecology 7, 167-187.
Tremblay, L., Gagne, J.-P. 2002. Fast quantification of humic substances and organic matter by direct analysis of sediments using DRIFT spectrocopy. Analytical Chemistry 74, 2985-2993.
Trouvé, C., Disnar, J.-R., Mariotti, A., Guillet, B., 1996. Changes in the amount and distribution of neutral monosaccharides of savanna soils after plantation of Pinus and Eucalyptus in the congo. European Journal of Soil Science 47, 51-59.
Tucker, M.P., Nguyen, Q.A., Eddy, F.P., Kadam, K.L., Gedvilas, L.M., Webb, J.D. 2001. Fourier transform infrared quantitative analysis of sugars and lignin in pretreated softwood solid residues. Applied Biochemistry and Biotechnology 91, 51-61.
Tuittila, E.-S., Komulainen, V.-M., Vasander, H., Laine, J., 1999. Restored cut-away peatland as a sink for atmospheric CO2. Oecologia 120, 563-574.
Verhoeven, J.T.A., Toth, E. 1995. Decomposition of Carex and Sphagnum litter in fens: Effects of litter quality and inhibition by living tissue homogenates. Soil Biology and Biochemistry 27, 271-275.
Waddington, J.M., Warner, K.D. 2001. Atmospheric CO2 sequestration in restored
Wicks, R.J., Moran, M.A., Pittman, L.J., Hodson, R.E. 1991. Carbohydrate signatures of aquatic macrophytes and their dissolved degradation products as determined by a sensitive high-performance ion chromatography method. Applied and Environmental Microbiology 57, 3135-3143.
Zaccheo, P., Cabassi, G., Ricca, G., Crippa, L. 2002. Decomposition of organic residues in soil: experimental technique and spectroscopic approach. Organic Geochemistry 33, 327-345.
Figure legends:
Fig. 1. FTIR spectra of peat profile samples from the Scottish Site D (an advanced stage of regeneration), ranging from the surface moss layer at 0-5 cm (solid line) through decomposing plant litter at 5-10 cm (dashed line) and highly humified peat at 22.5 - 27.5 cm (dash-dotted line) and at 42.5 - 47.5 cm (dotted line). Relative abundances for each spectral signal were obtained by normalisation of data (see text). Characteristic FTIR bands of the major biochemical descriptors have been marked on the whole spectrum (A) and in the region containing the lignin, carboxylate and peptide markers (B). The left and right insets represent magnified sections of the spectrum of the 22.5 - 27.5 cm horizon. Spectral markers indicative of mineral interference in this sample have been marked with arrows (see text).
Fig. 2. Loadings generated by partial least squares analysis of zero-order FTIR-ATR absorbances against A) Total C and B) total N content. Loadings against micromorphological parameters such as percentage preserved (solid line) and structureless (dotted line) Cyperaceae tissues and mucilage are shown in Figs. C and D, respectively. Figures E and F present loadings generated against hemicellulosic sugars and fucose, respectively.
Fig. 3. Relative differences in PLS loadings between different organic matter parameters as assessed by subtraction of loadings. Variations over the entire FTIR spectral range are shown for the differences in loadings between mucilage and total C content (A) and the difference between structureless versus preserved Cyperaceae
characteristic for neutral sugars. Differences in loadings of fucose versus xylose (C), arabinose versus mannose (D), fucose versus ribose (E) and mannose versus rhamnose (F) are shown as examples.
Fig. 4. Fitted (open symbols) versus observed (closed symbols) values for various organic matter parameters with depth (cm) for the site in the early stage of regeneration (FR-A) and the intact site (FR-D) in the peatland at Le Russey, France.
Fig. 5. Predictive properties of univariate PLS models based on FTIR data to describe the following organic matter properties of peat. A: Predicted (x) vs. observed (y) values of C/N ratios B: Regression plot of the first dimensions of PCA performed on the PLS predicted (x) versus observed (y) values of the micromorphological remains. Each micromorphological parameter was used in separate univariate PLS analyses and the predicted data were used for PCA based reconstruction. Variance explained for the first dimensions for each PCA are shown in brackets on each axis. C: Regression plot of the first dimensions of PCA performed on the PLS predicted (x) versus observed (y) values of the carbohydrate monomer analyses. Each carbohydrate parameter was used in separate univariate PLS analyses and the predicted data were used for PCA based reconstruction. Variance explained for the first dimensions for each PCA are shown in brackets on each axis. Samples from the different countries are indicated by the following symbols: Finnish samples (downward, filled triangles), France Baupte (empty circles), France Russey (upward, empty triangles), Switzerland Chaux d’Abel (filled circles) and Scotland (filled squares). The solid lines indicate the mean regression, the dashed lines indicate the 95% confidence interval and the dotted lines indicate the 95% prediction intervals.
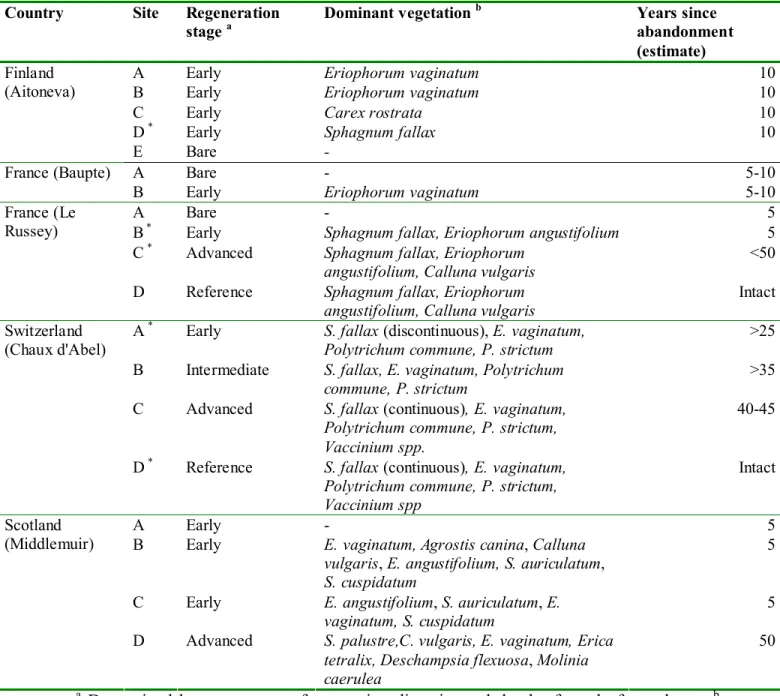
Table 1. Origin and general characteristics of peat samples
Country Site Regeneration stage a
Dominant vegetation b Years since abandonment (estimate)
A Early Eriophorum vaginatum 10
B Early Eriophorum vaginatum 10
C Early Carex rostrata 10
D * Early Sphagnum fallax 10
Finland (Aitoneva)
E Bare -
A Bare - 5-10
France (Baupte)
B Early Eriophorum vaginatum 5-10
A Bare - 5
B * Early Sphagnum fallax, Eriophorum angustifolium 5 C * Advanced Sphagnum fallax, Eriophorum
angustifolium, Calluna vulgaris
<50 France (Le
Russey)
D Reference Sphagnum fallax, Eriophorum angustifolium, Calluna vulgaris
Intact A * Early S. fallax (discontinuous), E. vaginatum,
Polytrichum commune, P. strictum
>25 B Intermediate S. fallax, E. vaginatum, Polytrichum
commune, P. strictum
>35 C Advanced S. fallax (continuous), E. vaginatum,
Polytrichum commune, P. strictum, Vaccinium spp.
40-45 Switzerland
(Chaux d'Abel)
D * Reference S. fallax (continuous), E. vaginatum,
Polytrichum commune, P. strictum, Vaccinium spp
Intact
A Early - 5
B Early E. vaginatum, Agrostis canina, Calluna vulgaris, E. angustifolium, S. auriculatum, S. cuspidatum
5 C Early E. angustifolium, S. auriculatum, E.
vaginatum, S. cuspidatum
5 Scotland
(Middlemuir)
D Advanced S. palustre,C. vulgaris, E. vaginatum, Erica tetralix, Deschampsia flexuosa, Molinia caerulea
50
a
Determined by assessment of vegetation diversity and depth of newly formed peat
bBased on % cover estimates. Only vegetation with >10% cover reported
*Horizon 3
samples not analysed.
Table 2. Assignment of the principal descriptive IR absorption bands in peat samples
Wavenumber, cm-1 Assignment Characterisation Reference 3340 γ (O-H) stretching Cellulose, in samples with
defined 3340 peak
Cocozza et al., 2003 2920 antisymmetric CH2 Fats, wax, lipids Niemeyer et al., 1992;
Cocozza et al., 2003
2850 symmetric CH2 Fats, wax, lipids Niemeyer et al., 1992;
Cocozza et al., 2003
1720 C=O stretch of
COOH or COOR
Carboxylic acids, aromatic esters Niemeyer et al., 1992; Haberhauer et al., 1998; Cocozza et al., 2003; Gondar et al., 2005
1710-1707 C=O stretch of COOH Free organic acids Gondar et al., 2005 1653 C=O of amide I Proteinaceous origin Ibarra et al., 1996;
Zaccheo et al., 2002 1650-1600 Aromatic C=C stretching
and/or asymmetric C-O stretch in COO-
Lignin and other aromatics, or aromatic or aliphatic carboxylates
Niemeyer et al., 1992; Cocozza et al., 2003 1550 N-H in plane (amide-II ) Proteinaceous origin Ibarra et al., 1996;
Zaccheo et al., 2002 1515-1513 Aromatic C=C stretching Lignin/Phenolic backbone Cocozza et al., 2003 1426 Symmetric C-O stretch from
COO- or stretch and OH deformation (COOH)
Carboxylate/Carboxylic structures (humic acids)
Parker, 1971
1450, 1371 C-H deformations Phenolic (lignin) and aliphatic structures
Parker, 1971 1265 (approximately) C-O stretching of phenolic
OH and/or arylmethylethers Indicative of lignin backbone Niemeyer et al., 1992; Ibarra et al., 1996 1080-1030 Combination of C-O
stretching and O-H deformation
Polysaccharides Grube et al., 2006 900 Out of phase ring stretching
(ring ‘breathing’)
Cellulose, corresponding band to sharpened 3340 peak
Zaccheo et al., 2002 720 CH2 wag Long chain (>C4) alkanes Ibarra et al., 1996
835 Aromatic CH out of plane Lignin Zaccheo et al., 2002
Table 3. Organic matter parameters measured with average, standard deviation and range
observed.
Parameter Average SD Range
Elemental
Total C (%) 52.5 4.0 42.9-60.6
Total N (%) 1.9 0.6 0.9-3.2
C/N ratio 30.6 9.9 15.1-59.7
Micromorphology
Amorphous organic matter (%) 20.7 15.6 0.9-71.8
Preserved Cyperaceae (%) 9.6 19.0 0-79.8
Preserved Sphagnum (%) 4.6 6.9 0-27.3
Preserved Polytrichum (%) 1.1 3.9 0-22.1
Undetermined preserved tissue (%) 2.6 4.6 0-19.1
Structureless Cyperaceae (%) 4.5 9.4 0-41.8 Structureless Sphagnum (%) 0.5 1.3 0-5.2 Structureless Polytrichum (%) 0.1 1.0 0-8.1 Undetermined structureless (%) 10.9 9.9 0.2-43.6 Mucilage (%) 40.8 24.1 0-94.4 Microorganisms (%) 3.1 2.4 0.1-12.9 Cuticles/Spores/Pollen (%) 1.1 3.6 0-28.4
Gelified or oxidised debris (%) 0.1 0.4 0-2.8
Carbohydrates Total sugars (mg g-1) 134.9 60.2 40.6-346.5 Hemicellulosic sugars (mg g-1) 86.9 40.1 27.2-179.9 Cellulosic sugars (mg g-1) 47.9 28.2 10.7-173.2 Xylose (%) 19.4 4.1 10.5-31.0 Arabinose (%) 6.6 4.9 1.7-19.6 Hemicellulosic glucose (%) 38.2 11.3 16.4-58.5 Mannose (%) 10.4 1.8 6.3-16.4 Rhamnose (%) 7.5 1.8 2.7-12.6 Galactose (%) 6.4 6.5 0.2-26.9 Ribose (%) 2.0 1.8 0-6.3 Fucose (%) 9.5 6.2 1.8-23.2
Table 4. Partial least squares analysis results of zero-order FTIR spectra vs. peat
micromorphological and chemical properties.
Parameter No. of latent roots in univariate PLS (variance accounted for, r2 in %) RMSECV a in univariate PLS
No. of latent roots in multivariate PLS (variance accounted for, r2 in %) Elemental Total C (%) 6 (81.6) *** b 2.1 6 (75.6) Total N (%) 6 (68.8) *** 0.4 6 (67.5) C/N ratio 6 (70.6) *** 6.4 6 (70.4) Micromorphology
Amorphous organic matter (%) 1 (9.0) *** 15.2 2 (8.9)
Preserved Cyperaceae (%) 2 (51.0) *** 14.3 2 (50.4)
Preserved Sphagnum (%) 1 (8.0) *** 6.8 2 (7.7)
Preserved Polytrichum (%) 1 (19.3) *** 3.7 2 (22.9)
Undetermined preserved tissue (%) 1 (2.4) ns 4.7 2 (2.6)
Structureless Cyperaceae (%) 1 (16.5) *** 8.7 2 (16.4) Structureless Sphagnum (%) 1 (9.2) ** 1.3 2 (0.2) Structureless Polytrichum (%) 1 (4.1) ns 1.0 2 (5.4) Undetermined structureless (%) 1 (9.7) ** 9.6 2 (6.4) Mucilage (%) 2 (40.7) *** 19.7 2 (37.8) Microorganisms (%) 1 (11.4) ** 2.3 2 (11.7) Cuticles/Spores/Pollen (%) 1 (10.9) ns 3.7 2 (10.7)
Gelified or oxidised debris (%) 1 (12.1) *** 0.4 2 (2.9) Carbohydrates Total sugars (mg g-1) 4 (81.2) *** 29.5 4 (80.7) Hemicellulosic sugars (mg g-1) 4 (83.5) *** 17.7 4 (82.9) Cellulosic sugars (mg g-1) 2 (43.8) *** 22.2 4 (46.9) Xylose (%) 3 (41.2) *** 3.4 4 (36.9) Arabinose (%) 2 (45.7) *** 3.8 4 (41.4) Hemicellulosic glucose (%) 4 (60.1) *** 7.8 4 (47.8) Mannose (%) 3 (17.7) *** 1.8 4 (8.2) Rhamnose (%) 4 (46.3) *** 1.6 4 (21.0) Galactose (%) 2 (59.3) *** 4.3 4 (58.0) Ribose (%) 4 (64.0) *** 1.2 4 (57.5) Fucose (%) 4 (84.9) *** 2.8 4 (81.8)
a Root mean square error of cross-validation in univariate PLS. b Significance at p < 0.05 -*, p < 0.01 - ** , p < 0.001 - ***, ns - not significant.