HAL Id: hal-02617148
https://hal-amu.archives-ouvertes.fr/hal-02617148
Submitted on 25 May 2020HAL is a multi-disciplinary open access archive for the deposit and dissemination of sci-entific research documents, whether they are pub-lished or not. The documents may come from teaching and research institutions in France or abroad, or from public or private research centers.
L’archive ouverte pluridisciplinaire HAL, est destinée au dépôt et à la diffusion de documents scientifiques de niveau recherche, publiés ou non, émanant des établissements d’enseignement et de recherche français ou étrangers, des laboratoires publics ou privés.
Antibiotic and efflux: Combined spectrofluorimetry and
mass spectrometry
Estelle Dumont, Julia Vergalli, Laurence Conraux, Carine Taillier, Aurelie
Vassort, Jelena Pajovic, Matthieu Réfrégiers, Michael Mourez, Jean-Marie
Pages
To cite this version:
Estelle Dumont, Julia Vergalli, Laurence Conraux, Carine Taillier, Aurelie Vassort, et al.. Antibi-otic and efflux: Combined spectrofluorimetry and mass spectrometry. Journal of Antimicrobial Chemotherapy, Oxford University Press (OUP), 2018, 74 (1), pp.58-65. �10.1093/jac/dky396�. �hal-02617148�
Antibiotic and efflux: Combined spectrofluorimetry and mass spectrometry
1
to evaluate the involvement of concentration and efflux activity in antibiotic
2
intracellular accumulation
3 4 5
Estelle DUMONT1,#, Julia VERGALLI1,#, Laurence CONRAUX2,#, Carine TAILLIER2, 6
Aurélie VASSORT2, Jelena PAJOVIĆ3, Matthieu RÉFRÉGIERS3, Michael MOUREZ2,
Jean-7
Marie PAGÈS1,* 8
9 10
1UMR_MD1, Aix-Marseille Univ, U-1261 INSERM, SSA, IRBA, MCT, Marseille, France
11
2Infectious Diseases Therapeutic Area, Sanofi R&D, Marcy l’Etoile, France
12
3 DISCO beamline, Synchrotron Soleil, Saint-Aubin, France
13 14 15
#These authors contributed equally to this work
16 17
*
Corresponding author: 18
J.-M. Pagès, UMR_MD1, U-1261 INSERM, Membrane et Cibles Thérapeutiques, Faculté de 19
Médecine et Faculté de Pharmacie, 27 Bd Jean Moulin, 13385 Marseille cedex 05, France. 20
Tel:(33) 491324587. Fax:(33) 491324606. E-mail: [email protected] 21
22
Running title: Combined methods for studying antibiotic transport 23
Synopsis
25
Background: In Gram-negative bacteria, passing through the double membrane barrier to
26
reach the inhibitory concentration inside the bacterium is a pivotal step for the antibiotic 27
activity. Spectrofluorimetry has been developed to follow the fluoroquinolone accumulation 28
inside bacteria using intrinsic bacterial fluorescence as an internal standard. However, 29
adaptation for non-fluorescent antibiotics is needed; quantitative methods based on mass 30
spectrometry offer the possibility of expanding the detection range obtained by 31
spectrofluorimetry. 32
Objectives: We wanted to validate with fluorimetry the use of mass spectrometry to measure
33
antibiotic accumulation in cells and to determine the relationship between antibiotic 34
concentrations and the amount of intra-bacterial accumulation in different efflux backgrounds 35
on the same batch of molecules. 36
Methods: Spectrofluorimetry was performed in parallel with mass spectrometry on the same
37
samples to measure the ciprofloxacin and fleroxacin accumulation in cells expressing various 38
efflux pump levels. A microplate protocol was set up to determine the antibiotic accumulation 39
as a function of external antibiotic concentrations. 40
Results: A consistency existed between the data obtained with spectrofluorimetry and mass
41
spectrometry, whatever the activity of efflux pump or the tested antibiotic. The results 42
highlighted a different dynamic of uptake between ciprofloxacin and fleroxacin as well as the 43
relationship between the level of efflux activity and antibiotic accumulation. 44
Conclusions: We have developed a microplate protocol and cross-validated two
45
complementary methods, spectrofluorimetry that contains a solid internal standard and mass 46
spectrometry that allows detection of low antibiotic amounts. These assays allow studying the 47
dose-effect and the efflux impact on the intra-bacterial accumulation of antibiotics. 48
Introduction
50 51
A main challenge in bacterial chemotherapy is to determine and carefully use the in situ 52
parameters that modulate the activity of drugs in order to improve antibacterial efficacy.1,2 53
This is particularly important with the continuing emergence and the spread of MDR bacteria 54
that contribute to therapeutic failure.3–6 Several papers illustrate the intensity and relevance of
55
the concern and it is absolutely required to understand membrane permeation and intracellular 56
concentration of antibiotics in clinical isolates: crossing the double membrane barrier to reach 57
a threshold concentration is a pivotal step of antibacterial action.7–15 This key point has not 58
been strongly addressed until now or only in few specific cases with characterized bacterial 59
strains.10,13,16,17
60
As recently reported10,18,19, there is a large collection of methods available to measure efflux 61
activity, but their sensitivity and validity must be clearly demonstrated under different 62
conditions. Thus, the lack of appropriate assays containing well-defined internal controls that 63
allow standardization of signals obtained with various strains under various conditions is a 64
serious bottleneck for medicinal chemistry efforts aiming for the optimization of an antibiotic 65
intracellular accumulation. Mass spectrometry appears as a promising technique to determine 66
the intracellular accumulation of label-free compounds. 20–24 Ultimately, this approach might 67
help to characterize the membrane permeation of any potential drugs, quantify antibiotic 68
accumulation kinetics with appropriate internal controls and meet the throughput requirements 69
of optimization programs based on structure-activity relationship. In the case of fluorescent 70
drugs, intracellular accumulation can be monitored using a synchrotron light source and use 71
the intrinsic fluorescence of bacterial amino acids as a powerful internal standard to correct 72
for biological variations associated with bacterial samples.25 For example, the fluoroquinolone
73
antibiotic, fleroxacin, exhibits sufficient changes in fluorescence intensity to monitor its 74
accumulation in single bacterial cells.25,26 Recent results allowed us to validate this method
75
with a multidrug resistant clinical strain of Enterobacter aerogenes and an efflux pump 76
deficient (tolC) derivative of this strain, demonstrating the importance to use a robust 77
internal control.27 78
The Innovative Medicine Initiative-funded consortium Translocation28 79
(www.imi.europa.eu/content/translocation) has defined as its main objective the study of 80
antibiotic translocation across bacterial membranes.17 The consortium uses, new approaches,
81
and more traditional ones, to improve our understanding of drug transport and to support 82
future strategies in order to face the antibiotic resistance crisis. In this context, it is important 83
to define common standards and/or protocols to validate the new methods and for future 84
correlation with the antibacterial activities.10,29 This is the main objective of this study that 85
proposes a joint protocol for spectrofluorimetry and mass spectrometry analyses associated to 86
biological/biochemical characterizations of bacterial samples. From this work, a new 87
perspective emerges on how to measure kinetics of antibiotic uptake inside bacterial cells and 88
correlate them to the antibiotic mode of action in order to (i) understand and combat the 89
emergence and spread of resistant strains and (ii) extend the activity of antibiotics or (iii) 90
upgrade the design of new molecules. In addition, this study contributes to the recently 91
proposed concepts, "Resident Time Concentration Close to Target" (RTC2T) and "Structure 92
Intracellular Concentration Activity Relationship" (SICAR).10
93 94 95
Materials and methods
96 97
Bacteria and Media
98
Escherichia coli strains used in this study are listed in Figure 1. These isogenic strains have
99
been previously described regarding their antibiotic susceptibility.30 100
101
Immunodetection
102
Exponential-phase bacteria in liquid Mueller Hinton II medium were centrifuged and the 103
pellet was solubilized in loading buffer.31 Total cell protein (OD600 = 0.02 corresponding to
104
equal protein per well) was loaded onto a SDS-polyacrylamide gel (10% polyacrylamide 105
(w/v), 0.1% SDS (w/v)). Proteins were electro-transferred onto nitrocellulose membranes in 106
transfer buffer. An initial saturating step was performed overnight at 4°C with Tris-buffered 107
sodium (TBS: 50 mM Tris-HCl, pH 8.0, 150 mM NaCl) containing skimmed milk powder 108
(10%). The nitrocellulose sheets were then incubated in TBS + skimmed milk powder + 109
Triton X-100 (0.2%) for 2 h at room temperature in the presence of polyclonal antibodies 110
(1:5,000, 1:2,000 and 1:10,000 dilution for anti-AcrA, anti-AcrB, OmpC and OmpF 111
respectively) directed against denatured AcrA, AcrB, OmpC and OmpF respectively.31 The 112
detection of antigen-antibody complexes was performed with horseradish peroxidase 113
secondary antibody conjugated Immune-Star goat anti-rabbit IgG antibodies (BioRad) and 114
revelation was performed using a ChemidocXRS+ (BioRad). 115
116
Drug susceptibility assays
117
Ciprofloxacin and fleroxacin were assayed to study the antibiotic susceptibility of E. coli 118
strains. MIC values of antibiotics were determined by the microdilution method (CLSI) in 119
liquid Mueller Hinton II medium by using the twofold standard microbroth dilution method 120
(microplates and automatic analyses Tecan®) (CLSI, http://clsi.org/). MIC values were read 121
after 18 h of incubation at 37°C. Experiments were carried out in triplicate and the resulting 122
medians were presented. 123
124
Accumulation protocol
125
Bacteria grown at 37°C in Luria-Bertani broth in its exponential-phase (0.6 optical density 126
units at 600 nm) were concentrated 10-fold. The bacterial suspension was centrifuged at 6000 127
× g for 15 min at 20 °C and pellets were re-suspended in 1/10 of the initial volume in a 128
sodium phosphate buffer (50 mM) at pH 7 supplemented with MgCl2 (5 mM) (NaPi-MgCl2
129
buffer) to obtain a density of 6.109 cfu.mL-1 (colony-forming-unit). In 96-well deep well 130
plates, 1.44 mL of the bacterial suspension was incubated 2 or 10 min at 37°C (final volume 131
1.8 mL per well) with different concentrations of fleroxacin and ciprofloxacin (0 to 5 mg/L), 132
in the absence or in the presence of the efflux blocker cyanide-m-chlorophenylhydrazone 133
(CCCP) at 10 μM for the efflux pump overproducer strain AG102. CCCP collapses the 134
energy-driven force needed by the efflux pump to expel antibiotics in the resistant strain.32 135
Bacterial suspensions incubated without antibiotics, with or without CCCP, were used as 136
controls. Suspensions (800 μL) were then loaded on 1 M sucrose cushions (1.1 mL) in two 137
deep well plates (one for the spectrofluorimetry analysis and the other for the mass 138
spectrometry analysis) and centrifuged at 2 700 × g for 20 min at 4°C to eliminate 139
extracellular-adsorbed compounds and collect washed bacteria.29 The same incubation 140
mixtures were used to performed spectrofluorimetry and mass spectrometry analyses, in three 141
replicates each. This accumulation assay was repeated three times. 142
To control that the bacterial cells are alive during the experimental time, the number of cfu 143
was determined by sampling the bacterial suspension at 2 and 10 min during antibiotic 144
incubation. The cfu numbers were determined and no change in cell viability was observed 145
during this period that corresponds to accumulation assay (data not shown). It must be noted 146
that the ratio "bacterial cell/antibiotic concentration" was different in the MIC assay and in 147
accumulation assay (about 10-20 times higher in accumulation conditions compared to MIC 148
assays). Furthermore, the accumulation assay was carried out using starving conditions during 149
a limited incubation time (2-10 min) as previously determined.27 150
151
Spectrofluorimetry assay
152
To follow the compound uptake by bacterial population, the fluorimetric assay previously 153
described was used.25 Pellets corresponding to 800 μL of bacterial suspensions were lysed 154
with 500 μL of 0.1 M Glycin-HCl pH 3 buffer overnight at room temperature. The lysis 155
efficacy has been checked by cfu determination as previously mentioned.29 After a 156
centrifugation in deep wells for 20 min at 2 700 × g at 4°C, 100 μL of lysates were analyzed 157
by spectrofluorimetry at λex 290 nm and λem around 450 nm for fleroxacin and λex 275 nm
158
and λem around 450 nm for ciprofloxacin. To quantify the fluoroquinolone fluorescence
159
intensity in bacteria lysate, spectra were normalized using the tryptophan peak at 356 nm and 160
subtracted from control sample spectra.27 Fluoroquinolone concentrations in bacterial lysate 161
were calculated according to a calibration curve (See paragraph ‘Standard curves’).29 162
163
Mass spectrometry determination
164
Sample preparation for Mass spectrometry analysis 165
Pelleted bacteria were thawed during 10 min at 37°C and resuspended in 200 µL of 0,1 M 166
Glycin-HCl pH 3 buffer. Samples were sonicated during 5 min (sonic batch) and incubated at 167
37°C during 2 hours under gentle agitation. The lysis efficacy has been checked by cfu 168
determination (data not shown). After a first centrifugation at 6,100 g (10 min, room 169
temperature) 150 µL of the supernatant were recover and centrifuged a second time in the 170
same conditions. 40 µL of these final supernatants were then put in a 96 well plate for MS 171
analysis. 172
Mass spectrometry analysis 173
Quantitative analysis was performed on a Waters ACQUITY UHPLC HSS T3 column (1.8 μ 174
m 50 x 2.1 mm) at room temperature with the flow rate of mobile phase set at 0.5 mL/min. 175
The mobile phase consisted of (A) 0.1 % formic acid in water, and (B) 0.1 % formic acid in 176
95 % acetonitrile, 5 % water. A linear gradient elution program was applied as follows: 0-1 177
min: 0-100 % B; 1-1.3 min: 100 % B; 1.3-1.4 min: 100 %-0 % B; 1.4-2 min: 0% B. The 178
sample injection volume was 5 μL. 179
All the mass spectrometry experiments were performed using a TSQ Quantiva mass 180
spectrometer (Thermo Scientific, San Jose, CA, USA) interfaced with an UltiMate 3000 XRS 181
UHPLC system (Thermo Scientific San Jose, CA, USA). Data was processed using Trace 182
Finder version 3.3 (Thermo Scientific, San Jose, CA, USA). 183
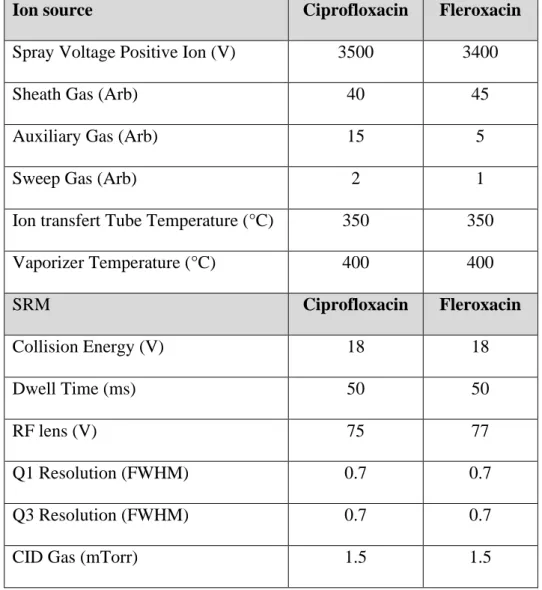
Mass spectrometry detection was performed in positive ion mode and each drug was 184
quantified using one selected reaction monitoring transition (dwell time ∼ 50ms): m/z 185
332.141 -> 287.986 for the ciprofloxacin and 370.181 -> 326.111 for the fleroxacin. Details 186
regarding collision energy and RF-lens values are presented in Table 1. 187 188 Standard curves 189 Mass spectrometry 190
Solutions of each compound for calibration were freshly prepared in bacteria lysate. From a 191
first concentration of 5 mg/L, 4-time serial dilutions were done in bacteria lysate to a final 192
concentration of 0.076 ng/mL, leading to 9 solutions used for mass spectrometry calibration 193
curves (Figure S1). 194
Spectrofluorimetry 195
Various known concentrations of fleroxacin and ciprofloxacin were mixed with bacteria 196
lysates at OD=4.8 and samples were measured with spectrofluorimeter (n=3) at λex 290 or 275
197
nm respectively and λem around 450 nm. The trend lines and the slopes of the fleroxacin and
198
ciprofloxacin standard curves were determined in the various studied bacteria lysates (Figure 199
S2). The corrected fluorescence value of each spectrofluorimetry sample (corrected with the
200
fluorescence signal from bacteria as previously described)27 was divided by the slope of the
201
trend line to obtain the fleroxacin and ciprofloxacin concentrations. 202
203 204
Results and Discussion
205 206
Fluoroquinolone susceptibility and AcrAB expression
207
The activity of fleroxacin and ciprofloxacin were assayed on E. coli AG100, AG100A, a 208
derivative strain devoid of the AcrAB efflux pump, and AG102, a strain that overproduces 209
AcrAB (Figure 1a). The same strains were used for both detection methods. In general, 210
AG100A was more susceptible to the drugs than the wild type, while AG102 was more 211
resistant. Immunoblots confirmed the absence of AcrAB in AG100A and a more intense 212
signal in AG102 (Figure 1b). The porins, OmpC and OmpF, are present at an equivalent level 213
of expression in the 3 strains (Figure 1b). 214
215
Mass Spectrometry versus spectrofluorimetry to evaluate the fluoroquinolone accumulation
216
In order to compare the two approaches for determining the antibiotic accumulation in various 217
efflux backgrounds, an experimental protocol was designed (see Figure S3). In this protocol, 218
we generated duplicate samples for each experimental point (e.g. strain, time, drug 219
concentration). Each sample was analyzed in triplicate (corresponding to 3 independent wells) 220
using spectrofluorimetry or mass spectrometry method (blind assay). 221
Ciprofloxacin accumulation 222
The analysis was performed on measurements of ciprofloxacin concentrations accumulated in 223
all studied strains (AG100, AG100A, AG102, AG102 incubated with CCCP) at 2 min and 10 224
min incubations (Figure 2). The consistency between spectrofluorimetry and mass 225
spectrometry was quantified by Bland-Altman calculations (Figure 2). The difference is 226
centered around zero with neither absolute systematic error nor strong dependency on the 227
magnitude of measurements. The observed bias is relatively low (297 ± 5477 molecule/cell) 228
and not significant, and biases are similar between incubations at 2 min and 10 min (data not 229
shown). Under the conditions used, the two methods give equivalent results. 230
Fleroxacin accumulation 231
The results are presented in Figure S4. As observed with ciprofloxacin, the Bland-Altman 232
plot demonstrated the consistency of the measurements obtained with spectrofluorimetry and 233
mass spectrometry (Bias of 263 ± 4008 molecule/cell). The difference is centered around zero 234
and no proportional error is present in the comparison between the two methods. 235
It must be noted that only in the case of fluorimetry assay, as reported previously, the internal 236
signal corresponding to intrinsic bacterial fluorescence (tryptophan fluorescence) was 237
systematically used to correct the data about the variation of cellular masses presented in the 238
various samples.27,29 The fact that spectrofluorimetry measurements are corrected with the
239
bacterial internal standard, unlike mass spectrometry data, can explain the ranges of 240
agreement obtained on the Bland-Altman plots. Another specific point concerns the detection 241
limit of spectrofluorimetry: it cannot be used to detect accumulations performed with 242
concentration lower than 500 ng/mL under the conditions used. In contrast, mass spectrometry 243
gives access to a wider range of low concentrations (down to 25 ng/mL) in our conditions. 244
245
Concentration effect, influx and efflux activity
246
The measure of the accumulation of compounds inside the E. coli AG100A strain devoid of 247
AcrAB pump can be used to determine the respective efficacy of ciprofloxacin and fleroxacin 248
uptake. The results presented in Figure 3 indicate that ciprofloxacin is about 2-fold more 249
efficiently accumulated compared to fleroxacin in the absence of AcrAB efflux. A quite 250
similar value has been calculated using spectrofluorimetry assay and previously proposed for 251
the concept SICARIN.32 In this study, the mass spectrometry assay also shows a difference in
252
uptake for ciprofloxacin and fleroxacin (Kruskal-Wallis test, p<0.01, n=27). 253
To evaluate the impacts of external concentration effect and/or of efflux level on the rate of 254
intracellular accumulation, a large range of ciprofloxacin concentrations was incubated with 255
the parental strain, the AcrAB- derivative and the AcrAB overproducer isogenic strains. The 256
data obtained with mass spectrometry analyses are presented in Figure 4. A strong difference 257
was observed between the accumulations in the different AcrAB strains: the maximal 258
accumulation, whatever the concentration used, was obtained with AG100A or with AG102 in 259
the presence of CCCP; in contrast the minima was obtained with AG102 (p<0.001). 260
Moreover, the overproduction of AcrAB in AG102 has a noticeable effect on ciprofloxacin 261
accumulation at high concentrations (3.75 and 5 µg/mL) compared to the pump basal 262
expression obtained in AG100 (p<0.05). 263
The fold-increase (FI) was defined as the ratio: F[AG102+CCCP] / F[AG102], where 264
F[AG102+CCCP] corresponds to the ciprofloxacin accumulated in AG102 in the presence of 265
CCCP and F[AG102] corresponds to the ciprofloxacin accumulated in the same strain in the 266
absence of CCCP. The F[AG100A] / F[AG102] was also calculated and the different ratios 267
were plotted for the given external ciprofloxacin concentration in Figure 5. Interestingly, with 268
increasing ciprofloxacin concentration, a significant decrease (p<0.05) of FI [AG102+CCCP 269
/AG102] and FI [AG100A/AG102] was observed (from about 4.4 to 2.7 and 3.6 to 2.4,
270
respectively)(Figure 5). These results suggest that a saturation of the efflux ability to expel 271
the internalized molecules can be reached in the E. coli strain that overproduced AcrAB when 272
high concentration of ciprofloxacin is used. 273
These data explain the key contribution of efflux pump in fluoroquinolone resistance in 274
clinical strains where the uptake of antibiotic can be impaired by alteration of the membrane 275
permeability as previously hypothesized.10 276
Conclusion
278 279
A variety of methods has been previously reported to follow the intracellular accumulation of 280
antibiotic in enterobacterial cells that feature membrane-associated mechanisms of resistance 281
affecting many or all antibiotic classes, including reduction of outer membrane permeability 282
or increase of levels of efflux pumps .10,18 Until now and despite recent methodology efforts,
283
no comparative assays have been carried out in order to have an independent validation of the 284
proposed protocols or at least to check their consistency and robustness. 285
286
In this study, our aim was to determine the internal concentration of fluoroquinolones, 287
ciprofloxacin and fleroxacin and to measure the effect of antibiotic concentrations on bacteria 288
expressing various levels of AcrB pump, using fluorimetric and mass spectrometric 289
(LC&MS/MS) methods. 290
For the first time, a robust consistency was described between these two approaches, 291
spectrofluorimetry and mass spectrometry, whatever the efflux activity, the molecule or the 292
concentration of antibiotic used in the assays. Moreover, by combining the spectrofluorimetry 293
measurement, that contains a solid internal standard29, with LC&MS/MS determination, that 294
allows studying low concentrations of molecule, these two methods can be viewed as 295
complementary. Our study is especially important in view of recent papers reporting the 296
accumulation of antibacterial molecules using mass spectrometry assay when this assay lacks 297
robust internal control for normalization.23
298
The development of LC&MS/MS assays in microplates allows to determine the relationship 299
between a large range of antibiotic concentrations and the amount of intra-bacterial 300
accumulation in different efflux backgrounds without and with the presence of an efflux 301
poison (CCCP). Importantly, the data demonstrate that ciprofloxacin penetrates and 302
accumulates more than fleroxacin in an AcrAB- strain The measurement of uptake in the 303
absence of efflux activity, defined by SICARIN as previously proposed,32 is thus confirmed. 304
With increasing external concentrations of compound, the effect of efflux on internal 305
accumulation was altered and the accumulation ratio obtained between efflux- and efflux ++ 306
strains was significantly decreased, showing that efflux can be saturated. This effect must be 307
taken into consideration when assessing the impact of efflux on new antibacterial agents. 308
In addition, the fact that efflux pumps can indeed be saturated supports the strategy previously 309
proposed by several authors to generate a substrate competition on the binding sites of efflux 310
pumps by using molecular lures or adjuvants to restore the intracellular antibiotic 311
concentration.31,33–36 312
Intrinsic bacterial fluorescence has been previously used to standardize/normalize the data in 313
the quantification assays for fluorescent drugs.25 In this study, the good correlation between 314
mass spectrometric determination and fluorimetric analyses demonstrated the advantage of 315
this internal measure for monitoring the efficacy of lysis protocol and correcting the crude 316
signals for protocol validation.10,19 317
318
In the future, it will be necessary to develop additional assays using similar methods as the 319
one described here to measure in whole bacteria the apparent affinities of various antibiotics 320
for the different bacterial transporters involved in the influx step (e.g. porins) or involved in 321
the efflux (e.g. other AcrAB family members). 322
323
To conclude, with this method the concept of "structure intracellular concentration activity 324
relationship" (SICAR) previously proposed10,19 is now applied to a large concentration range. 325
In SAR studies for biologically active molecules, SICAR will correlate the chemical structure 326
to the efficacy of translocation through bacterial membrane and the resulting intracellular 327
accumulation; while taking into account recently proposed key parameters, such as globularity 328
and charge, as reported by Richter et al.23 Thus, the role of chemical side chains involved in 329
the membrane permeation (IN) or in the efflux transport (OUT) can be dissected and allow the 330
design of drug that fit better the translocation constraints present in resistant clinical isolates. 331
332 333
Acknowledgements
334 335
We thank Anne Davin-Regli, Muriel Masi, Robert Stavenger and Mathias Winterhalter for 336
their fruitful discussions, Anne-Marie Tran for their assistance during microbiological assays. 337
338
Funding
339 340
This work was supported by the TRANSLOCATION consortium and has received support 341
from the Innovative Medicines Initiatives Joint Undertaking under Grant Agreement (grant 342
number 115525), resources which are composed of financial contribution from the European 343
Union’s seventh framework program (FP7/2007-2013) and EFPIA companies in kind 344
contribution. 345
This work was also supported by Aix-Marseille Univ and Service de Santé des Armées, and 346
by Soleil program (projects # 20141262, 20150318, 20160173). 347
348
Transparency declarations
349 350
The authors (L.C., C.T., A.V. and M.M.) declare competing financial interests: L.C., C.T., 351
A.V. and M.M. are former/current employees of Sanofi R&D. All other authors: none to 352
declare. 353
References
355 356
1. Brown DG, May-Dracka TL, Gagnon MM, et al. Trends and exceptions of physical 357
properties on antibacterial activity for Gram-positive and Gram-negative pathogens. J 358
Med Chem 2014; 57: 10144–61.
359
2. Payne DJ, Gwynn MN, Holmes DJ, et al. Drugs for bad bugs: confronting the challenges of 360
antibacterial discovery. Nat Rev Drug Discov 2007; 6: 29–40. 361
3. Watkins RR, Bonomo RA. Overview: Global and local impact of antibiotic resistance. 362
Antibiot Resist Chall Oppor 2016; 30: 313–22.
363
4. Laxminarayan R, Matsoso P, Pant S, et al. Access to effective antimicrobials: a worldwide 364
challenge. The Lancet 2016; 387: 168–75. 365
5. Boucher HW, Talbot GH, Benjamin DK, et al. 10 x ’20 Progress--development of new 366
drugs active against gram-negative bacilli: an update from the Infectious Diseases 367
Society of America. Clin Infect Dis Off Publ Infect Dis Soc Am 2013; 56: 1685–94. 368
6. Page MG, Bush K. Discovery and development of new antibacterial agents targeting Gram-369
negative bacteria in the era of pandrug resistance: is the future promising? Curr Opin 370
Pharmacol 2014; 18: 91–7.
371
7. Nikaido H. Molecular basis of bacterial outer membrane permeability revisited. Microbiol 372
Mol Biol Rev 2003; 67: 593–656.
373
8. Pagès J-M, James CE, Winterhalter M. The porin and the permeating antibiotic: a selective 374
diffusion barrier in Gram-negative bacteria. Nat Rev Microbiol 2008; 6: 893–903. 375
9. Blair JMA, Webber MA, Baylay AJ, et al. Molecular mechanisms of antibiotic resistance. 376
Nat Rev Microbiol 2015; 13: 42–51.
377
10. Masi M, Réfrégiers M, Pos KM, et al. Mechanisms of envelope permeability and 378
antibiotic influx and efflux in Gram-negative bacteria. Nat Microbiol 2017; 2: 17001. 379
11. Nikaido, H. Prevention of drug access to bacterial targets: permeability barriers and active 380
efflux. - Semantic Scholar. Mol Biol Rev 1994; 67: 593–656. 381
12. Li X-Z, Plésiat P, Nikaido H. The challenge of efflux-mediated antibiotic resistance in 382
Gram-negative bacteria. Clin Microbiol Rev 2015; 28: 337–418. 383
13. Davin-Regli A, Bolla J-M, James CE, et al. Membrane permeability and regulation of 384
drug ‘influx and efflux’ in Enterobacterial pathogens. Curr Drug Targets 2008; 9: 750– 385
9. 386
14. Zgurskaya HI, Löpez CA, Gnanakaran S. Permeability barrier of Gram-negative cell 387
envelopes and approaches to bypass it. ACS Infect Dis 2015; 1: 512–22. 388
15. Krishnamoorthy G, Leus IV, Weeks JW, et al. Synergy between active efflux and outer 389
membrane diffusion defines rules of antibiotic permeation into Gram-negative bacteria. 390
mBio 2017; 8: e01172-17.
391
16. Bolla J-M, Alibert-Franco S, Handzlik J, et al. Strategies for bypassing the membrane 392
barrier in multidrug resistant Gram-negative bacteria. FEBS Lett 2011; 585: 1682–1690. 393
17. Stavenger RA, Winterhalter M. TRANSLOCATION Project: How to get good drugs into 394
bad bugs. Sci Transl Med 2014; 6: 228ed7-228ed7. 395
18. Blair JMA, Piddock LJV. How to measure export via bacterial multidrug resistance efflux 396
pumps. mBio 2016; 7. Available at:
397
https://www.ncbi.nlm.nih.gov/pmc/articles/PMC4958252/. 398
19. Masi M, Dumont E, Vergalli J, et al. Fluorescence enlightens RND pump activity and the 399
intrabacterial concentration of antibiotics. Res Microbiol 2017. Available at: 400
http://www.sciencedirect.com/science/article/pii/S0923250817301973. 401
20. Zhou Y, Joubran C, Miller-Vedam L, et al. Thinking outside the ‘Bug’: A unique assay to 402
measure intracellular drug penetration in Gram-negative bacteria. Anal Chem 2015; 87: 403
3579–84. 404
21. Pu Y, Zhao Z, Li Y, et al. Enhanced efflux activity facilitates drug tolerance in dormant 405
bacterial cells. Mol Cell 2016; 62: 284–94. 406
22. Brown AR, Ettefagh KA, Todd D, et al. A mass spectrometry-based assay for improved 407
quantitative measurements of efflux pump inhibition. PLoS ONE 2015; 10. Available at: 408
https://www.ncbi.nlm.nih.gov/pmc/articles/PMC4427306/. 409
23. Richter MF, Drown BS, Riley AP, et al. Predictive compound accumulation rules yield a 410
broad-spectrum antibiotic. Nature 2017; 545: 299–304. 411
24. Davis TD, Gerry CJ, Tan DS. General platform for systematic quantitative evaluation of 412
small-molecule permeability in bacteria. ACS Chem Biol 2014; 9: 2535–44. 413
25. Kaščáková S, Maigre L, Chevalier J, et al. Antibiotic transport in resistant bacteria: 414
Synchrotron UV fluorescence microscopy to determine antibiotic accumulation with 415
single cell resolution. PLoS ONE 2012; 7. Available at: 416
https://www.ncbi.nlm.nih.gov/pmc/articles/PMC3373604/. 417
26. Pagès J-M, Kascàkovà S, Maigre L, et al. New peptide-based antimicrobials for tackling 418
drug resistance in bacteria: Single-cell fluorescence imaging. ACS Med Chem Lett 2013; 419
4: 556–9.
420
27. Cinquin B, Maigre L, Pinet E, et al. Microspectrometric insights on the uptake of 421
antibiotics at the single bacterial cell level. Sci Rep 2015; 5. Available at: 422
https://www.ncbi.nlm.nih.gov/pmc/articles/PMC4675965/. 423
28. IMI Innovative Medicines Initiative | TRANSLOCATION | Molecular basis of the 424
bacterial cell wall permeability. IMI Innov Med Initiat. Available at: 425
http://www.imi.europa.eu/projects-results/project-factsheets/translocation. 426
29. Vergalli J, Dumont E, Pajović J, et al. Spectrofluorimetric quantification of antibiotic drug 427
concentration in bacterial cells for the characterization of translocation across bacterial 428
membranes. Nat Protoc 2018; 13: 1348–61. 429
30. Mamelli L, Petit S, Chevalier J, et al. New antibiotic molecules: Bypassing the membrane 430
barrier of Gram negative bacteria increases the activity of peptide deformylase 431
inhibitors. PLoS ONE 2009; 4. Available at: 432
https://www.ncbi.nlm.nih.gov/pmc/articles/PMC2713832/. 433
31. Pagès J-M, Lavigne J-P, Leflon-Guibout V, et al. Efflux Pump, the masked side of ß-434
Lactam resistance in Klebsiella pneumoniae clinical isolates. PLOS ONE 2009; 4: e4817. 435
32. Vergalli J, Dumont E, Cinquin B, et al. Fluoroquinolone structure and translocation flux 436
across bacterial membrane. Sci Rep 2017; 7. Available at: 437
https://www.ncbi.nlm.nih.gov/pmc/articles/PMC5575017/. 438
33. Ruggerone P, Murakami S, Pos KM, et al. RND efflux pumps: Structural information 439
translated into function and inhibition mechanisms. Curr Top Med Chem 2013; 13: 440
3079–100. 441
34. Ramaswamy VK, Cacciotto P, Malloci G, et al. Computational modelling of efflux pumps 442
and their inhibitors. Essays Biochem 2017; 61: 141–56. 443
35. Nikaido H, Pagès J-M. Broad specificity efflux pumps and their role in multidrug 444
resistance of Gram negative bacteria. FEMS Microbiol Rev 2012; 36: 340–63. 445
36. Pagès J-M, Alibert-Franco S, Mahamoud A, et al. Efflux pumps of gram-negative 446
bacteria, a new target for new molecules. Curr Top Med Chem 2010; 10: 1848–57. 447
Figures
449 450
Figure 1. Expression of AcrAB efflux components and porins, and fluoroquinolone
451
susceptibilities of the studied bacterial strains. 452 453
a
454 E. coli strainsDetected porins Efflux pump MICa
OmpC OmpF (AcrAB)
Fleroxacin (mg/L) Ciprofloxacin (mg/L) AG100* + + AcrAB+ 0.125 0.016 AG100A* + + AcrAB- 0.03-0.06 0.004-0.008 AG102* + + AcrAB++ 0.5 0.062
a Strains and susceptibilities have been previously reported.30
455
b
456
457 458
(a) Fluoroquinolone susceptibilities of AG100, AG100A and AG102. (b) Western blot 459
showing AcrB, AcrA and porins OmpC and OmpF in AG100, AG100A and AG102 grown in 460
MH2. 461
Figure 2. Bland and Altman plot for mass spectrometry and spectrofluorimetry measurements 462 of ciprofloxacin accumulation. 463 464 465 466
Ciprofloxacin was accumulated for 2 min and 10 min in AG100 (AcrAB+), AG100A 467
(AcrAB-), AG102 (AcrAB++) and AG102 cells incubated in the presence of CCCP (10 µM). 468
The ciprofloxacin intracellular concentrations (molecules/cell) obtained in the various 469
isogenic strains were determined with the spectrofluorimetry and mass spectrometry methods. 470
The figure shows the Bland-Altman plot of the differences between mass spectrometry and 471
spectrofluorimetry quantification against the averages of the two methods with bias of 297 ± 472
5477 units. The bias is represented by the gap between the X axis, corresponding to a zero 473
difference, and the parallel dotted line to the X axis. The 95% limits of agreement 474
corresponding to +/- 1.96 SD are represented in dashed lines. 475 . 476 477 -15000 -10000 -5000 0 5000 10000 15000 20000 0 20000 40000 60000 80000 M ass spect rom et ry -spect rof luori m et ry m easurem en ts
Mean of mass spectrometry and spectrofluorimetry measurements
Figure 3. Amount of intrabacterial concentrations of ciprofloxacin and fleroxacin measured
478
by mass spectrometry in the AG100A strain (AcrAB-). 479
480 481 482
Increasing concentrations of ciprofloxacin (squares) and fleroxacin (circles) were accumulated 483
for 10 min in AG100A (AcrAB-) cells. The concentrations accumulated in the various strains 484
were measured by mass spectrometry. The symbols with bars (standard deviations) correspond 485
to measurements carried out in triplicate. 486 y = 0.093x y = 0.043x 0.00 0.02 0.04 0.06 0.08 0.10 0 0.2 0.4 0.6 0.8 1 Int rab ac teri al an ti bi oti c c on c en tr ati on (µg/m L ly s at)
External antibiotic concentration (µg/mL)
Ciprofloxacin Fleroxacin
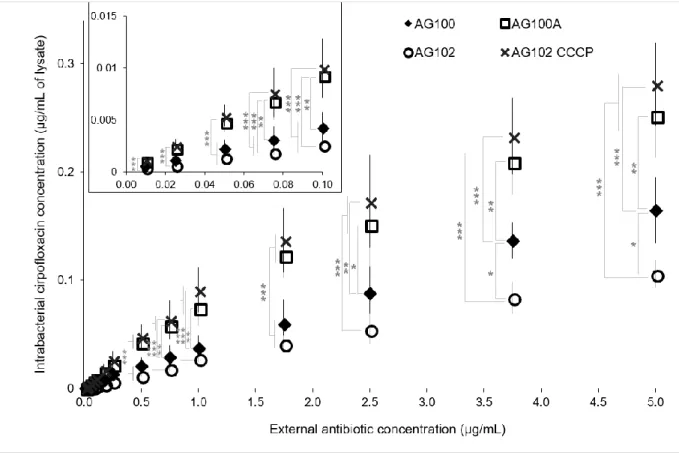
Figure 4. Accumulation and concentration effect of ciprofloxacin measured by mass
487
spectrometry in the studiedstrains expressing various efflux levels. 488
489
490 491
Increasing ciprofloxacin concentrations were accumulated for 10 min in AG100 (AcrAB+, 492
black diamonds), AG100A (AcrAB-, white squares), AG102 (AcrAB++, white circles) and 493
AG102 cells incubated in the presence of CCCP (10 µM) (crosses). The concentrations 494
accumulated in the various strains were measured by mass spectrometry. The columns with 495
bars (standard deviations) correspond to measurements of 3 independent experiments, each 496
experiment being carried out in triplicate. The insert presents an enlargement for small 497
concentrations. ANOVA and Tukey's post-Hoc tests were performed to determine differences 498
between the various strains (n=9). ***: p<0.001, **: p<0.01, *: p<0.05. Data normality was 499
checked by the Shapiro-Wilk test and homogeneity of variances was checked by the Fligner-500
Killeen test. 501
Figure 5. Determination of ciprofloxacin accumulation ratios in E. coli strains expressing
502
various efflux levels measured by mass spectrometry. 503
504
505 506
Increasing ciprofloxacin concentrations were accumulated for 10 min in AG100A (AcrAB-), 507
AG102 (AcrAB++) and AG102 cells incubated in the presence of CCCP (10 µM). Two ratios 508
of ciprofloxacin accumulation were calculated to characterize the efflux capability of the 509
AcrAB efflux pump according to the external ciprofloxacin concentration: [AG102+CCCP] / 510
[AG102] (black circles), where [AG102+CCCP] corresponds to the ciprofloxacin
511
accumulated in AG102 (AcrAB++) in the presence of CCCP and [AG102] corresponds to the 512
ciprofloxacin accumulated in the same strain in the absence of CCCP; similarly, [AG100A] / 513
[AG102] (white squares), where [AG100A] corresponds to the ciprofloxacin accumulated in
514
AG100A (AcrAB-) and [AG102] corresponds to the ciprofloxacin accumulated in AG102 515
(AcrAB++). The symbols with bars (standard deviations) correspond to measurements carried 516
out in triplicate. The [AG100A] / [AG102] ratio is significantly higher at external 517
concentrations of 0.05 or 0.1 µg/mL compared to external concentrations of 3.75 and 5 µg/mL 518
(ANOVA, p<0.05). Similarly, the [AG102+CCCP] / [AG102] ratio is significantly higher at 519
external concentrations of 0.05, 0.075, 0.1, 0.25 or 0.5 µg/mL compared to concentrations of 520
3.75 or 5 μg/mL (ANOVA, p<0.05). Data normality was checked by the Shapiro-Wilk test and 521
homogeneity of variances was checked by the Fligner-Killeen test. 522
Table 1: Mass spectrometry parameters used during analyses.
524 525
Ion source Ciprofloxacin Fleroxacin
Spray Voltage Positive Ion (V) 3500 3400
Sheath Gas (Arb) 40 45
Auxiliary Gas (Arb) 15 5
Sweep Gas (Arb) 2 1
Ion transfert Tube Temperature (°C) 350 350
Vaporizer Temperature (°C) 400 400 SRM Ciprofloxacin Fleroxacin Collision Energy (V) 18 18 Dwell Time (ms) 50 50 RF lens (V) 75 77 Q1 Resolution (FWHM) 0.7 0.7 Q3 Resolution (FWHM) 0.7 0.7
CID Gas (mTorr) 1.5 1.5