The Development of a Digital Controller for a
Three-Phase Induction Motor
by
Sridhar Chakravarthy Venkatesh
Submitted to the Department of Electical Engineering and Computer Science
in partial fulfillment of the requirements for the degree of
Master of Science in Electrical Engineering and Computer Science
at the
MASSACHUSETTS INSTITUTE OF TECHNOLOGY
May 1994
() Sridhar Chakravarthy Venkatesh, MCMXCIV. All rights reserved. The author hereby grants to MIT permission to reproduce and distribute publicly paper and electronic copies of this thesis document in whole or in part, and to grant
others the right to do so.
Author
...
. - . .. . ... -. .. .' -.. o o ..'. . Department of Electrical Engineering/2
and Computer Science May 12, 1994 Certified By.
C)
Certified By /n
.
A ---- 4--A3 1:1.-_ Uu'tI BY . [... V..s , C ... Jeffrey H. Lang Professor Thesis Supervisor Ralph S. Taylor Delco Electronics Company Supervisor . Frederic R. Morgenthaler)mmittee on Graduate Students
ng.
The Development of a Digital Controller for a Three-Phase
Induction Motor
by
Sridhar Chakravarthy Venkatesh
Submitted to the Department of Electrical Engineering and Computer Science
on May 12, 1994, in partial fulfillment of the requirements for the degree of
Master of Science in Computer Science and Engineering
Abstract
This thesis details the development of a field-oriented vector controller for an
induc-tion motor. The controller drives the motor through a pulse-width modulated inverter
which utilizes space vector modulation for the generation of its waveforms. The space vector modulation allows the modulation to be performed digitally, eliminating the need for the conventional sine-triangle method. The controller is implemented using a Motorola DSP56002 digital signal processor. It is used to drive a 3-hp motor with a fan load, and a 57-hp motor. The experimental results presented favorably compare speed transients between data taken from the 3-hp motor and data from a MATLAB simulation based on an analysis of the entire system.
Thesis Supervisor: Jeffrey Lang Title: Professor
Thesis Supervisor: Ralph Taylor
Acknowledgments
The work for this thesis surely would not have been possible without the support received from the Electric/Hybrid Vehicle Group at Delco Electronics. I wish to es-pecially thank Mr. Ralph Taylor, my supervisor at Delco Electronics, whose broad knowledge and sharp wit extended my experience beyond simply that of motor con-trol. Rarely does one get the opportunity to work with someone of Mr. Taylor's cal-iber. I am also grateful to Mr. John Gunzburger, supervisor of the Electric/Hybrid Vehicle Group and a veritable motor control guru. His vast expertise in the field, along with his PC simulations, were invaluable in understanding the system and con-trolling the motor. I would also like to thank Mr. Herman Tucker for his constant help and support during the course of this thesis.
Deserving a separate paragraph is Mr. Bill Goetze, also of the Electric/Hybrid Vehicle Group, whose selfless nature and continual support were a blessing. I am especially indebted to him for the extra hours he put in during the final stages of this thesis. This work literally could not have been completed without his assistance, and no finite number of Subway sandwiches could repay my gratitude.
I owe a great deal to Professor Jeffrey Lang, my MIT thesis supervisor. It is often with reservations that professors agree to sponsor a company thesis, as the majority of the work is done away from the campus. Professor Lang, however, has been ideal in this situation. His advice and direction were critical in the completion of this work, as well as enduring my repeatedly unscheduled visits with a patient smile.
I could not leave MIT alive without thanking some of my good friends who helped me make it through my five years at the Institute including Sherk Chung, Graham Fernandes, Kathleen LieuwKieSong, May Nasrallah, Robert Wickham, and Safroadu Yeboah-Amankwah.
In addition, I am deeply indebted to my parents, Mandyam and Meera Venkatesh, and my brother Mukund Venkatesh. It is impossible to put in words the love, under-standing, and support they have given me over the years.
bugged, annoyed, or pestered in the completion of this thesis, namely Kathy and Barbara, secretaries in the LEES office, and the receptionists on Delco's toll-free line.
Contents
1 Introduction
1.1 Existing Technology ... 1.2 Overview. ...
2 Induction Motor Review
2.1 The squirrel cage induction motor ... 2.2 Circuit analysis of an induction motor ... 2.3 Speed-Torque Characteristics ...
3 Control of an Induction Motor
3.1 Field-Oriented Vector Control ... 3.2 The Direct and Indirect Method ....
3.3 Rotor-flux-oriented Control ... 3.4 Generation of the PWM Waveforms .
3.4.1 Sine-Triangle Method ... 3.4.2 Space Vector Modulation .... 3.4.3 Addition of the Third Harmonic
4 Power Electronics 4.1 The Inverter ... 4.2 The Switches ... 4.3 Gate Drives ... 9 10 11 13 13 14 17 20 . . . 20 . . . 33 . . . 33 . . . 36 . . . 37 . . . 38 . . . 39 41 41 44 45
5.1 Inverter Losses ...
5.1.1 Losses in the switches ... 5.2 Motor Losses ...
5.2.1 Individual losses within the motor.
5.2.2 Computation of motor efficiency . .
5.3 Efficiency of the drive system ...
6 Implementation and Results
6.1 Implementation ...
6.2
R
esults
.
. . .
.
7 Summary, Conclusions, and Suggestions for Future Work
A MATLAB Simulation Code
47 48 48 49 50 52 54 54 58 66 70
...
.... ...
...
...
...
...
List of Figures
2-1 T circuit model (steady state) equivalent of a single phase of an
induc-tion motor . . . 15
2-2 Steady state speed-torque curve for an induction machine at constant
voltage and frequency ... 18 2-3 Speed-torque curve in the normal motoring region depicting torque
terminology ... 19
3-1 Field and currents of a DC and AC motor ... 23 3-2 Schematic of a three- and two-phase system ... 28 3-3 Schematic of the indirect implementation of rotor-flux-oriented control. 34 3-4 Resolution of the current vector, I, into its a// and D/Q components. 35 3-5 A pulse-width modulated waveform generated using the sine- triangle
method ... 37
3-6 The eight inverter output voltage vectors used in space vector modulation 38 3-7 Pulse pattern over time period T of space vector PWM for each phase 40
4-1 Schematic of a three-phase inverter bridge with wye configured motor 43 4-2 Illustration of the dead time during which both switches on the same
leg are off ... 43 4-3 The IGBT and its equivalent connection of a MOSFET and a BJT. 45
5-1 Typical no-load saturation curve for an induction motor ... . . 51 5-2 Determination of friction and windage losses from a no-load saturation
6-1 Block diagram of the entire motor control system ... 55
6-2 Block diagram of the DSP Motor Controller . ... 56
6-3 T circuit model for the 3 hp motor ... 57
6-4 PWM waveform and phase current driving the 3 hp motor ... 59
6-5 Block diagram of the field-oriented vector control simulation ... 61
6-6 Rotor speed transient of the actual controller and the simulation for a step decrease in torque ... 62
6-7 Rotor speed transient of the motor and the simulation for a step in-crease in torque ... 62
6-8 Rotor speed transients of the simulation as the coefficient of friction and windage is varied ... 64
6-9 iSD current transient for a step change in the reference iSD ... . 64
6-10 isQ current transient for a step change in the reference iSQ ... . 65
Chapter 1
Introduction
DC motors are commonly used in applications where variable speed is required, de-spite the fact that induction motors are less expensive, have a simpler and perhaps more rugged structure, and tend to last longer. This is mainly due to the ease of control associated with a DC motor: the flux and torque are easily modified through control of the field and armature currents. However, because they contain commu-tators and brushes, DC motors require periodic maintenance and cannot be used in high-speed or high-voltage operating conditions or harsh environments. Thus, induc-tion motors are desirable.
Control of a DC motor is based on control of the field and armature currents. However, in an induction motor, as the stator current is the only directly controllable current, the phase and the magnitude of this current are controlled. Progress in the field of vector control, power electronics, and microprocessor technology has made induction motor control much simpler to apply than it might first appear. Hence, the use of induction motors has risen significantly in the past twenty years.
In the design of a controller, key factors are stability, efficiency, and cost. Gener-ally, as controller performance improves, cost also increases. Most digital controllers today use a high-speed processor communicating with sophisticated hardware result-ing in high development and manufacturresult-ing costs. However, such hardware and soft-ware sophistication may not be required. A close look at the entire system will reveal
and resolution of the gate drives. By decoupling the modulation from the actual controller, sampling rates may be reduced without affecting the switching frequency. Similar shortcuts may be taken to reduce the cost while leaving the performance of a controller unchanged. In this manner, the system retains the advantages of a digital controller without the same costs.
1.1 Existing Technology
Most of the current controllers for induction motors contain digital as well as analog components. Generally, two analog-digital (A/D) converters are required on the sine
wave inputs to the processor. The processor then digitally performs the computation
required for motor control. Three digital-analog (D/A) converters take the output of the processor and create the three reference sinusoids. Finally, analog circuitry is used
to create the pulse-width modulated (PWM) waveforms to be input to the inverter.
Because the switching frequency of the PWM waveforms is often required to be in the range of 10 Khz to 20 Khz, the sampling rate on the A/D and D/A converters must be able to match this speed. This requires high-speed converters that may cost up to $100 each.
Numerous benefits may be realized by reducing the number of analog compo-nents in the system. A digital system is inherently easier to modify and adapt for various functions than an analog system. Indeed, the development of electronically programmable logic devices have significantly simplified digital design and develop-ment. Furthermore, by reducing the number of analog components in a system, the cost of the system may often be significantly reduced as well.
Within a fully digital system as well, many optimizations may be made. Most improvements can lead to significant cost reductions in the system. As the loop timing of the control system and the bit resolution of the processor is decreased, a smaller processor may be used. This can be extremely advantageous when considering that a digital signal processor (DSP) can cost nearly ten times greater than a standard 8-bit processor. Similarly, as the loop timing is decreased, high speed A/D and D/A
converters are no longer required. Here again, significant cost savings may be realized. For a system destined to reach the production lines, such optimizations are necessary
to stay competitive in the market.
1.2 Overview
The primary goal of the work presented here is to develop a fully-digital, functional controller for a three-phase induction motor. In addition, the many considerations involved in completing a full motor control system will be presented. The various optimizations mentioned above will be explored.
Chapter 2 introduces the induction motor. It contains some background followed by a simple derivation of the common T circuit model used to represent an induction motor. The speed and torque of the motor are described in terms of the circuit, leading to a discussion of speed-torque curves.
The controller is discussed in its entirety in Chapter 3. It begins with an expla-nation of field-oriented vector control and includes an entire derivation. This chapter concludes with three equations fully describing the principle of field orientation. The following section concerns the implementation of the control. The generation of the pulse-width modulated (PWM) waveforms through space vector control is also de-scribed in detail.
Chapter 4 serves as an introduction to the power electronics of the system. The salient features of a six-switch PWM inverter are fully described as well as some of the advantages of using a PWM inverter. This is followed by a detailed explanation of the switches used to control the inverter. Gate drives are also introduced.
Chapter 5 explores the efficiency of the entire drive system. It starts with a discussion regarding losses distributed through the inverter and the switches and then the efficiencies of the motor itself. These losses are combined to create a net power loss in the system.
to that of a simulation. Finally, Chapter 7 concludes the thesis with a summary, conclusion, and a consideration of further work which may be done.
Chapter 2
Induction Motor Review
Since the invention of the induction motor by Nikola Tesla in 1886, the use of three-phase squirrel-cage induction motors has grown tremendously. The advantage of using an induction motor comes with its rugged and economic design and reliable performance even in adverse conditions. Induction motors are regularly installed
out-doors, exposed to rain and sandstorms, and have even been found at the bottom of
oil wells. As a result, the induction motor has found widespread use throughout the world. Approximately 60% of electrical energy world-wide passes through the wind-ings of squirrel-cage induction motors1. This chapter serves to provide a background
to the squirrel-cage induction motor as well as an introduction to the various methods
available to describe the performance of the induction motor.
2.1 The squirrel cage induction motor
A three-phase induction motor works on the principle that electrical power supplied to the stator will produce a rotating magnetic flux through its iron and air gap. This rotating flux, in turn, induces currents in the rotor conductors. There, currents
interact with the original flux to generate a torque to make the rotor turn. The
stator has insulated windings embedded in the inner slots of the iron periphery. The placement and connection of these windings determines the number of electrical poles
of the motor. As indicated by its name, the rotor of a squirrel cage induction motor consists of a number of aluminum bars short-circuited on both ends with a pair of end rings, similar to the configuration of a squirrel cage. As a sinusoidal excitation is applied to the windings of the stator, a sinusoidal flux is established in the air gap rotating at a speed given by
120fL20f (2.1)
where Ns is the speed in rpm,
f
8is the frequency of the applied excitation in Hz, andP is the number of poles. The rotor attempts to turn at this speed, also known as the
synchronous speed, but never quite reaches this speed, rotating instead at a speed Nr due to slip. The difference between the source angular frequency (s) and the angular frequency of the rotor electrical speed (r) is termed the angular slip frequency (sl),
while the ratio of the slip speed to the stator speed is the actual slip (S). Thus,
N - N,
~w ~
s
NSNr
=
(2.2)
Ns Us uWs
Note that slip can also be defined in terms of Nr and Ns as shown in Equation (2.2) where Nr is the rotor speed in rpm. There must always exist some non-zero slip to
generate currents in the rotor, and hence torque to turn the rotor. However, a motor
running unloaded will often be running at very nearly zero slip.
2.2 Circuit analysis of an induction motor
It is often useful to visualize an induction motor in terms of an equivalent circuit model. This can be useful not only in understanding the salient features of the
in-duction motor, but also in describing the motor's various parameters. Because the
magnetic flux produced by the stator and the rotor rotate at the same speed in the air gap, the windings may be represented as a transformer. Figure 2-1 shows the
equiva-IsRLL
S~1- Rs Ls L rR
RV
Figure 2-1: T circuit model (steady state) equivalent of a single phase of an induction
motor.
lent circuit diagram for one phase of an induction motor based on this representation2.
Rs and LS represent the stator resistance and stator leakage inductance per phase,
while R and Lr describe the rotor resistance and leakage inductance per phase. Lm corresponds to the magnetizing inductance, and RL accounts for iron losses. This circuit, also known as the T-model, is the conventional circuit used to describe
in-duction motor operation in steady state, and most manufacturers specify the motor
parameters to match this model. It is often shown without the resistance in parallel with the magnetizing inductance, RL, signifying the neglect of the no-load iron losses. This is a reasonable omission as the error due to this neglect is sometimes very small. It has been included here, however, to promote further discussion regarding losses.
The T circuit model has been developed based on an assumption of constant speed and sinusoidal excitation and constant parameter values. However, due to realistic variations in the parameters, adjusted values are often used to yield a closer corre-lation between predicted and actual test data. For example, due to skin effect in the rotor conducting bars, the rotor resistance, Rr, increases as the slip frequency increases, while the rotor leakage inductance, L, decreases with increasing slip fre-quency. Similarly, both stator and rotor leakage inductances can decrease as the
2For a detailed derivation of the T circuit model, refer to Power Electronics and AC Drives, B.K.
Bose, 1986, p. 35.
current magnitude increases. The magnetizing inductance will also decrease, with an increase of the flux in the air gap. These preliminary corrections often suffice to
predict trends in the motor.
In the model of Figure 2-1, IS represents the applied stator currents, m represents
the stator magnetizing current, and I represents the induced rotor currents. Using
the circuit parameters, the expressions for power and loss are given as
Input Power Pi - 3Is cos 0 (2.3)
Stator Loss PIS = 3I2RS (2.4)
V2
Core Loss PIC = 3 (2.5)
Rm
Power across Air Gap Pg = 32 R (2.6)
Rotor Loss PIr = 3I,2Rr (2.7)
Output Power Po = 3I2R -
S
(2.8)S
where 0 is the phase angle between the voltage and the current. The losses are further discussed in Chapter 5. The torque T is easily determined by realizing that the output power is the product of the torque and the mechanical speed Wm of the motor where
Wm = (2/P)w,. Therefore,
_Pa _
3I,2R 1
-S
__2_RT
R-
-
=
3
I
(2.9)
Wm m S 2 SWs
Neglecting the core-loss resistor RL from the circuit of Figure 2-1 and assuming
I
(R/S + jws.Lr) << cWsLm as is most often the case for standard induction motorsgives
¼
=-
V3 .(2.10),=v(Rs
+ /S)2 + w(L + L)2
2
Substituting Equation (2.10) into Equation (2.9) givesT= 3 ( 2 ) Sw
!
~~~~~~~~~~(R
+
Rr/S)
2+
2(L +
Lr)
2(2.11)
2.3 Speed-Torque Characteristics
Assuming a constant voltage excitation, the torque T can be calculated as a function of the slip S from Equation (2.11). The steady state speed-torque curve for a typical induction motor is shown in Figure 2-23, where the regions of operation are defined
as plugging (1.0 < S < 2.0), motoring (0.0 < S < 1.0), and regeneration (S < 0).
Superimposing the load curve on a speed-torque curve determines the operating point of the motor. Figure 2-34focuses on the normal motoring region illustrating the tran-sient (as a motor is started from rest) as well as commonly used torque terminology. When a motor is line-started, it is suddenly subjected to the rated voltage and fre-quency from rest. In this case, the motor develops a starting (breakaway) torque, then an accelerating (pull-up) torque, and finally a full-load torque bringing the
mo-tor to a constant speed and mo-torque. During an overload condition, the momo-tor mo-torque increases up to the breakdown value, at which point the motor will enter a stall con-dition at the locked rotor value of torque. In the plugging region, the rotor rotates
in the opposite direction of the air gap flux. This may occur if the applied excitation is reversed while the rotor is moving. In the regeneration region, the rotor speed exceeds the synchronous speed resulting in a negative slip. A negative slip equates to a negative or regeneration torque and corresponds to a negative equivalent resistance
Rr/S in Figure 2-1. Instead of consuming energy, the negative resistance generates energy and feeds it back to the source. An induction motor can be continuously run as a generator if its shaft is rotated by an external means at a speed greater than the synchronous speed.
f 4g.)-4 WD © -4 O 4z .4 bfr 0 -o E0 0 0 0 00 1 .n CQ
IV
.CC.
X V V) C) © 0 I o v. 'A a ( a ( c<- 'nbloLd Torque wn Torque t) Torque m) Torque Rotor Breakaway) U 0 100 200
Torque Percent of Full Load
Figure 2-3: Speed-torque curve in the normal motoring region depicting torque
termi-nology. E cU 4%0 c0 0
i
u. Ln 100Chapter 3
Control of an Induction Motor
The control of an induction motor is considerably more complex than that of a DC motor. This is partly due to the complex dynamics of an AC machine. Various scalar and vector control methods exist, and the nature of the application generally determines which control strategy is applied. The advantage of field-oriented vec-tor control, developed by Felix Blaschke in 1972, is faster response times to changes in requested torque. However, at the time, microprocessor technology had not yet advanced enough to prove its usefulness. With the development of high-speed micro-processors and switching devices, field-oriented control has emerged as a simple yet effective method of controlling AC drives for variable-speed applications.
3.1 Field-Oriented Vector Control
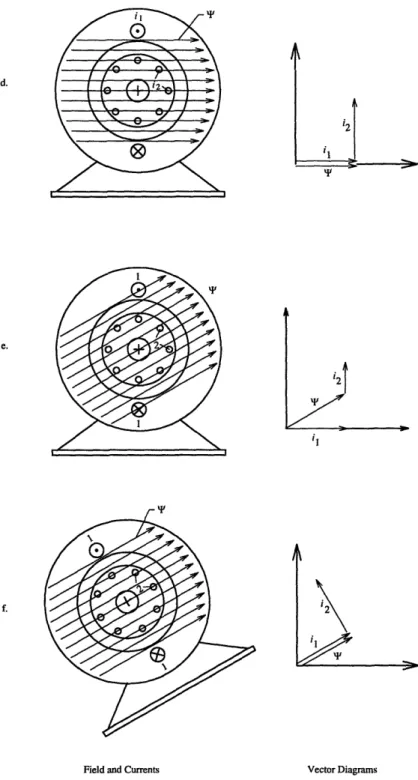
Vector control can be best understood with reference to control of a DC motor. Figure 3-la1 illustrates a simple DC motor. A current i, passed through the field winding in the stator, creates a magnetic flux, b, as shown in Figure 3-lb. To create a torque, another current, i2, is passed through the armature winding. As the current i2 in
the armature winding is perpendicular to the field
4,
a torque T is imposed on thearmature given as T = K4'2. Since i and i2 are orthogonal, they can be considered
1 The Principle of Field Orientation as Applied to the New TRANSVEKTOR Closed-Loop Control
as decoupled vectors. Therefore, in normal operation, i is generally set to maintain the rated field flux of the machine while i2 is used to independently vary the torque.
The flux- and torque-producing currents in an induction motor, however, are not independent as seen from the stator terminals. It is for this reason that control of induction drives was more complex prior to vector control. Vector control simplifies the control by resolving, and hence decoupling, the electrical stator variables of an
induction motor to look like a DC motor.
In an induction motor (Figure 3-1c), the armature winding is replaced by a short-circuited winding. A number of conducting bars are evenly distributed along the periphery of the rotor and held together with a short-circuiting ring on either end. The configuration of these squirrel cage motors makes the rotor current (i2 in a DC
motor) inaccessible. Indeed, the key feature of an induction motor which distinguishes it from other electrical motors is that the secondary, or rotor, currents are created solely through induction, not by any external means.
As in a DC motor, a current i through the stator winding creates a magnetic flux. The magnetic flux then induces a current i2 in the conducting bars of the rotor.
Initially, this is identical to the DC motor, as shown by the vector diagram in Figure 3-ld. However, because this rotor current is driven by a time-varying flux, the flux must rotate, altering the vector diagram (Figure 3-le). In this manner, the flux wave in the
air gap rotates with respect to both the rotor and the stator. If the stator, fixed in
reality, could follow the rotation of the flux, the vector diagram of a DC motor would constantly be retained, and i and i2 would be fixed relative to one another, thereby
simulating the case of a DC motor. This can be achieved mathematically by resolving all electrical variables in a synchronously rotating reference frame where the sinusoidal components of the applied excitation appear as DC quantities as shown in Figure 3-1f. In this manner, two fixed currents, iD and iQ are derived. ID and iQ represent the flux- and torque-producing components of the stator current, respectively. Control, using iD and iQ, is then essentially identical to that of a DC motor.
I Field Winding 2 Armature Winding
a. Representation of a DC motor
'4
'I
Field and currents Vector Diagram b. State of field and currents in a DC motor
I Stator Winding 2 Rotor Winding c. Representation of an AC motor I \ i2 iI
I i2 il ql i21 ,/I iI
Field and Currents Vector Diagrams
a mathematical model for an induction machine2. A current applied to each winding creates a magnetic flux which links the windings. In the physical frame of the winding, this is given as
N
)m(t) = E Lmn(O(t))in(t) (3.1)
n=1
where Am is the flux linked by winding m, Lm,n is the mutual inductance from winding n to winding m, i is the current in winding n, is the rotational position of the
rotor with respect to the stator, and N is the total number of windings. Because the
magnetic circuit is altered by the motion of the rotor, each Lm,, may be a function of 0. Also, if m = n, L,n is a self-inductance.
The voltage applied to the terminals of a winding, vn(t), can be divided into two components. One component of the voltage, un(t), forces a time variation of the flux linked by that winding and the other drives a current through the resistance of that winding Rn. Thus,
dAn(t)
Un(t) dA (t) (3.2)
dt
Vn
(t)- Un(t)
=n(t)in (t)
(3.3)
Rn is shown to be varying with time as the resistivities of most conductors change with
temperature, and induction motors exhibit large variations in temperature during normal operation. Equations (3.2) and (3.3) may be combined to eliminate un and rewritten, along with Equation (3.1), in vector form as
A(t)
= L(O(t))i(t) (3.4)dX(t)
d(t) = v(t) - R(t)i(t)
(3.5)
dt
2MIT EECS 6.238 Class Notes: Electrical Machine Systems: Dynamics, Estimation, and Control by Jeffrey Lang, George Verghese, and Marija Ili, 1994
where the three vectors A, i, and v are defined as
i(t) --- [>li(/).-. *AN(t)]T (3.6)
i(t)
-
[i1
(t)'''i*
N ()](3.7)
v(t)
- [Vl (t) ... VN(t)]T (3.8)and the two matrices L and R are given by
Li ((t))
...
L,,N(0(t)) L(O(t)) . (3.9) LN,l(O(t)) ... LN,N(O(t))RI (t)
R(t)-
..
(3.10)
RN(t)R is a diagonal matrix. All of its off-diagonal elements are zero. Together, Equations
(3.4) and (3.5) form the model for the electrical dynamics of an induction motor. By similar means, a mathematical model for the mechanical dynamics may also be derived for an induction motor. From this model comes an expression for the torque of the motor r given by
r(t)
=
iT(t)dL(
(t))it
(3.11)
2 dO
Equations (3.4), (3.5), and (3.11) define the mathematical basis for an induction motor. Specifically, for a three-phase induction motor, the three vectors defined above, A, i, and v , may be written in terms of stator and rotor quantities for each phase. Stator and rotor quantities are denoted by the subscripts S and R with the phases denoted by the subscripts A, B, and C. For example, the three vectors are given for a three-phase motor by
ASA ASB Asc ARA ASB iSA iSB
isc
iRA iRB -iRC V = VSA VSB VSC 0 0 0 (3.12)Note that the rotor components of v are zero since the rotor phases are internally shorted together, and no external connections are made to the rotor cage. Similarly, the matrices L and R may be defined for a three-phase induction motor, and are given by
Ls
-Lss
-Lss
M cos(0) M cos(O+ ) Mcos(0 - ) M cos(O)Mcos(0
-23)M
cos(+
)
LR -LRR -LRR-Lss
Ls
-Lss
Mcos(0-2)
M cos(0)M
cos( + )
M cos(0 + ) M cos(O)Mcos(0 -
) -LRR LR -LRR-Lss
-Lss
Ls
Mcos( +
2') Mcos(O -23 M cos(0)Mcos(0 -
)
M cos(O
+
)
M cos(O)-LRR
-LRR LR (3.13) AscRs 0 0 0 0 0 0 Rs 0 0 0 0 R= 0 0 Rs 0 0 0 (3.14)
R
=
(3.14)
0 0 0 RR 0 0 0 0 0 0 RR 0 0 0 0 0 0 RRwhere Ls, R, LR, and RR are defined as the self inductance and resistance per
phase of the stator and rotor,
Lss
and LRR are the coefficients of mutual inductancebetween the stator phases alone and the rotor phases alone, and M is the coefficient
of mutual inductance between the phases of the stator and the rotor.
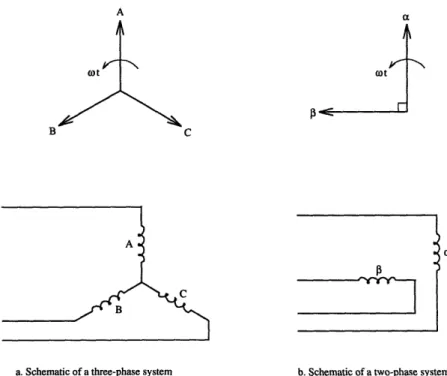
Because three phases sinusoidally wound on a smooth air gap may be modeled by two phases with fixed orientation and variable excitation, the three-phase system described above is transformed into a two-phase system. Figure 3-2 illustrates the phasor diagram and schematic windings of a three-phase system and a two-phase system. For a three-phase induction motor connected in a wye configuration, the three line currents must always sum to zero and may be defined as
iA =
I sin(wt)
(3.15)
iB =Isin(wt- -)
(3.16)
3 2wic
=
Isin(t +
-)
(3.17)
3and for the two-phase system
i< = I sin(wt) (3.18)
A
cot
C
C
"lii-a. Schematic of a three-phase system b. Schematic of a two-phase system
Figure 3-2: Schematic of a three- and two-phase system.
two systems to be equivalent, the current density produced at the surface of the air gap by both systems must be equivalent. In other words,
NABC(iA + iB + ic) -N.(3(i. + i) (3.20)
where NABC corresponds to the winding density of phases A, B, and C and N,6
correspond to the winding density of phases a and /3. Equations (3.16) through
(3.20) then reduce to
i
l
NABC [ 1[1
N,~, 0By choosing NABC = N,/n, the trans
Th=
-L
The transformation T converts anyiA iA
I 1
_~~i
--
T i
2 22 2 -
ic
ic
formation matrix T is simply
(3.21)
1-1 -1 1
20~~~~~~ .(3.22) 4 _
three-phase set of stator or rotor electrical va 2 _- 2
-three-phase set of stator or rotor electrical
vari-B
ac
!
ables into their two-phase counterparts. Conversely, for the reverse transformation of a two-phase to three-phase system, the pseudo-inverse T+ of T is used. Thus, T+ is
given by
1 0
T+ =
2
-
/(3.23)
2 2
2 2
The two matrices T and T+ are inverses in the sense that TT+ is the 2 x 2 identity
matrix.
Now, the electrical model for a three-phase system described by Equations (3.4) and (3.5) may be transformed to the equivalent two-phase system which yields
Ls + Lss
0 aM sin(O)-2Msin(0)
iSa isp iR. iRfl 0Ls + Lss
M cos(O) 2M cos(0) M cos(O) 3M sin(O) LR + LRR 0 -23M sin(0) 2 M cos(0) 0 LR+
LRR tsa isp ZRa iR3 (3.24) Asa Vsa d Asp VSp dt AR. VRa ARp VR/3With the replacements L + Lss to = Ls, Rs 0 0 0 Rs 0 0 0 RR LR0+LRR 0 LR
+
LRR 0 0 0 RR LR, and isaC sp . (3.25) iRa iRp-M
, L' reduces
ASa A Sp ARa ARp-Ls 0 Mcos(6) -Msin(O) 0 Ls M sin(0) M cos(0) Msin(0) Mcos(O) LR 0 -M isin(0) M cos(O) 0 LR
LsI
M]eJ Me- J LRI (3.26) where 0 -1 J = (3.27) 1 0 Jo = cos(O) -sin(0) (3.28) sin(O) cos(O)eJ
=
[eJ]
=
[eJo
.(3.29)
and I is the 2 x 2 identity matrix. Equations (3.24) and (3.25) along with the revised definition of L comprise the electrical model for a two-phase system. The expression given in Equation (3.11) still holds for the definition of the torque in a two-phase system.
The rotor quantities of the three vectors in the two-phase system A, v, and i are
next transformed to the stator frame using the transformation eJo resulting in three
new vectors A, , and . For example,
-= I °
1
A= a~Ae~Jel
~(3.30)0 e
°or conversely,
I 0
A= 0 e-JO .(3.31)
Using the matrix transformation given in Equation (3.31) on the flux linkages A and
the currents i, Equation (3.24), (3.25), and the expression for the torque given in Equation (3.11) may be rewritten as
d
[
R I][O>
(333)T
M
-
0d,~~ RsI 0
J
w0
I -T 0 T= .(3.34)
2 -MJ 0The last term in Equation (3.33) arises from the derivative of the transformation
matrix where w corresponds to the angular frequency of the rotor speed.
Expanding the equations for the rotor variables from Equations (3.32) and (3.33) gives
AR =
Mis +
LRiR(3.35)
dA
=
RRiR + JWAR .(3.36)dt
Again, the rotor component of v in Equation (3.36) is zero as there is no external voltage applied to the conducting bars of the rotor. The above equations may be combined, eliminating R, to give
dl~ R MRRn.
dt ~~(3.37)Rn~~~~~~~~~~n
AR
+ J)AR + -- S(337)
dt LR LR
Finally, the DQ transformation is used to transform Equation (3.37) from the stator frame to a frame defined such that the direct axis of that frame lies at an angle p with respect to the stator frame. Variables in this frame shall be denoted with a hat. The transformation is given for the flux linkages as
A=eJPA .
Equation (3.37) then becomes
=
RReJPAR
+ JweJPA
R+
LR
MRR eJPs
LR (3.39)
Expanding the derivative and cancelling all eJ Pgives
RR LR
MRR^
R LR S (3.40)
Choosing p to be the position of the rotor flux vector forces the rotor flux vector to lie on the direct axis of the DQ frame. In other words,
AR = O (3.41) Rewriting Equation (3.40), I0RII =
[
_RR LR W)-p~_R
_R L LR and written in equation form,dIARII =
lE
0 MRR LR RR MRR. -p-IIARII + ?SD LR LR iSD 1 SQJ
MRR
isQ LR IARiThrough an identical derivation, Equation (3.34) for the torque becomes
(3.42) (3.43) (3.44)
M
'r=
iSD
LR 0SQ[
isQ
]
-11
0 0 which equates to d [eJPR] dt dAt dt (3.45) (3.38) + i(W - )M.
t= iSQIIARII * (3.46)
LR
Equations (3.43), (3.44), and (3.46) fully describe the principle of field-orientation as applied to an induction motor, and Equation (3.46) clearly shows the result of field-orientation: the expression for the torque for an induction motor is nearly identical to that of a DC motor. Implementation of the control is discussed in the following sections.
3.2 The Direct and Indirect Method
Implementation of field-oriented vector control can be divided into two basic cat-egories: the direct method and the indirect method. The former involves directly measuring the position of the rotor flux phasor either physically or with the aid of
a flux model. In the indirect method, the position of the phasor is estimated using the monitored stator currents and often the slip. Although the indirect method has gained more widespread use, the line separating the two methods is fine. Indeed, the techniques used by each method are virtually identical. Nonetheless, as a flux model is being used, the work of this study falls under the indirect method.
When considering the direct and indirect methods, it is important to realize that
a direct method will generally provide for more optimal motor operation. With a direct method, physical quantities are actually being measured instead of computed or estimated. The added precision generally leads to increased stability and more exact steady-state values, though with a higher cost.
3.3 Rotor-flux-oriented Control
Figure 3-3 shows a diagram of the indirect implementation of rotor-flux-oriented con-trol for an induction machine. Two of the three sinusoidal currents, iA and B, are
o o c.-To a ! 0 0 0. 0 CT. S 4-P
r.
To c~ us c.so C.iQ
,
a
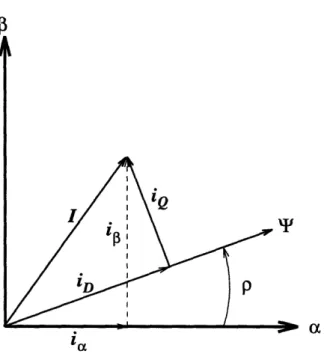
Figure 3-4: Resolution of the current vector, I, into its a//3 and D/Q components. three line currents are then transformed into the two currents i and i as given by Equation (3.22) according to
3
= ia= 2 A (3.47)
i =
/(iA +
2is)(3.48)
2
Thus, i and i are computed as a function of the three sinusoidal line currents. Figure 3-4 shows the resultant current vector on the ca-: coordinate axes along with the rotor flux vector, . The quadrature and armature currents, iQ and iD respectively, are determined by resolving the current vector, I, on the flux vector as given by the DQ transformation in Equation (3.38). With p defined as the position of the rotor flux vector, iD and iQ may be defined in terms of i and ip.
The values of D and iQ, along with the time constant associated with the rotor, TR,
are then used to calculate the angular slip frequency, w.
=sl
iQ
(3.51)
ZDTR
Integrating the slip speed gives the slip angle O.l, and adding the slip angle to the rotor position OR results in the new position of the flux vector p.
P = Osi + OR (3.52)
The currents iD and iQ are compared to the reference values iD,ref and iQ,ref, and the
differences are input to a proportional-integral (PI) controller. The controllers return two error voltages, eD and eQ, which are then retransformed onto the a-/3 reference
frame using the computed p.
Va = eD cos(p) - eQ sin(p) (3.53) Va = eD sin(p) + eQ cos(p) (3.54)
The final two-phase to three-phase transformation is done within the PWM
mod-ulator. The modulator takes as inputs the computed v,, and v and returns three
PWM signals 120° out of phase, corresponding to the new iA, iB, and ic.
3.4 Generation of the PWM Waveforms
In the final step of the control strategy described above, three phase-shifted sine waves are generated. This is generally accomplished using three D/A converters. These low-voltage sinusoids must then be converted to high-voltage AC waveforms using an inverter described in detail in Chapter 4. The inverter takes a series of pulses of varying duty cycles as inputs and converts them into AC signals. The duty cycle of each pulse corresponds on average to the amplitude of the AC waveform. These
K L , J L J L L V K T L i 1 J L
~
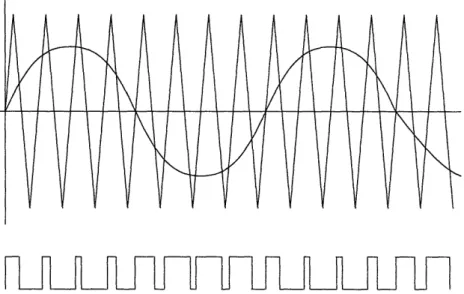
iFigure 3-5: A pulse-width modulated waveform generated using the sine- triangle
method
signals are said to be pulse-width modulated, or PWM waveforms.
3.4.1 Sine-Triangle Method
PWM generation has traditionally been performed using the sin-triangle method. As shown in Figure 3-5, the sine wave is compared to a high-frequency triangle wave. At every intersection of the sine and triangle wave, the PWM waveform switches from a high to a low, or a low to a high. Thus, the duty cycle of the pulses corresponds to the amplitude of the sinusoid. The frequency of the triangle wave is determined by the resolution required of the PWM pulses. This is a common method of generating PWM pulses and requires only analog circuitry.
In a digital controller, however, the reference voltage levels are determined by the software. Using the sine-triangle method would thus require three digital-to-analog converters to produce the reference sine waves. To avoid the additional hardware, space vector modulation, another method of PWM generation is used. This allows the width of each PWM pulse to be calculated through software. The resulting waveform is a PWM signal switching between high and low logic levels output by the
U4 (010)
U1
(101) X
Figure 3-6: The eight inverter output voltage vectors used in space vector modulation
3.4.2
Space Vector Modulation
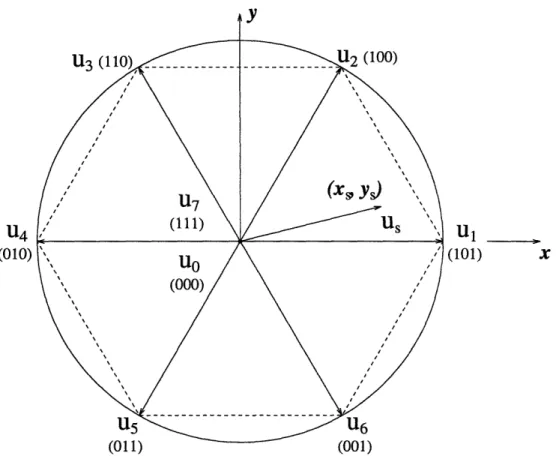
Figure 3-6 shows the six inverter output voltage vectors ul through u6 corresponding
to the six non-zero states of a three-phase PWM inverter. Vectors u0 and u7
corre-spond to the two null voltage vectors: (0 0 0) and (1 1) respectively. Vector us sweeps the path of the rotating voltage space vector corresponding to the reference sine wave. At any point in time, the vector us may be resolved onto the two adjacent output vectors and the two null voltage vectors. One PWM rotation can then be described by the following eight-stage sequence:
Uo --+ Ua Ub -- U7 - U7 -+ Ub Ua -4 Uo (3.55)
Ua and Ub correspond to the inverter output vectors immediately adjacent to us. The sum of the times spent in each stage equate to one switching period so that
T
= T + T + Tb + T7 (3.56)
where T is the switching period. As To and T7 both represent the null voltage vector,
they are set to be equal, and T, is defined as their sum.
T.
- = T7 (3.57)
2
The amount of time spent in each stage, Ta and Tb can be determined by resolving the reference voltage vector us on ua and Ub. T_ is then simply
T = T-
Ta
-Tb.
(3.58)
The three reference voltage waveforms, UA, UB, and Uc, are then given as the sum of the three adjacent active voltage vectors and the zero vector.
UA *T=u6
T6+ Ul*T1+ u
2*T
2+ uZ
T
(3.59)
UB * T = u2 T2+ 3 T3+ U4 T4+ U Tz (3.60)
Uc
T =
u
4T
4+ s
5T
5+
u
6. T
6+ Uz
.Tz
(3.61)
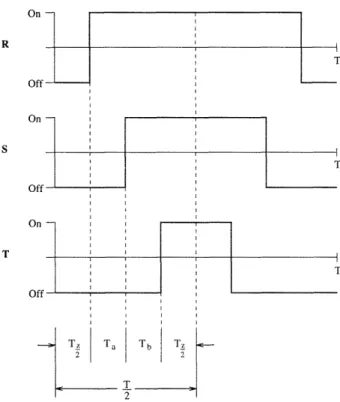
For a vector in the first sextant, Figure 3-7 shows the on and off times for each of the three reference waveforms. The reference vector u must always fall within the unit hexagon shown in Figure (3-6). Otherwise, overmodulation occurs in which u, must be scaled to fall within the hexagon to prevent Ta and Tb from resulting in negative times.
3.4.3 Addition of the Third Harmonic
On-R _ On S Off On -T _ nff -T I~~~~~~~~~~~~~~~~~~~~~~~~~~ l T l Tb Tz T 2
Figure 3-7: Pulse pattern over time period T of space vector PWM for each phase
peak magnitude of 25% of the peak magnitude of the reference voltage vector us. The addition of this third harmonic results in an approximately 25% reduction in switching losses compared to the traditional sin-triangle method which has no third harmonic. It is possible to vary the magnitude of the third harmonic by varying the ratio To : T7. The greatest reduction in loss factor occurs with a third harmonic
of 31%. However, the overhead required to implement the non-linear distribution between To and T7 does not compensate for the reduction in losses.
I I i I A\ _ : I I I I I I I I I
Chapter 4
Power Electronics
While most of the electronics industry today is concerned with the processing of in-formation, the field of power electronics is principally concerned with the processing of energy. Power electronic circuits convert energy supplied by the source into energy required by the load. Examples of such power circuits would include AC/DC con-verters and DC/DC concon-verters. These functions are achieved using semiconductor devices as switches. The semiconductor devices most common in power electronics
are the bipolar and Schottky diodes, the bipolar junction transistor (BJT), the
metal-oxide-semiconductor field-effect transistor (MOSFET), and various thyristors. Again, when used in power electronics, these devices are used as switches, having only two states: on and off.
4.1 The Inverter
The power circuit used to drive AC motors at varying speeds is termed a variable-frequency DC/AC converter, or stand-alone converter. More specifically, as power is flowing from the DC side to the AC side, the circuit is referred to as an inverter. Depending on the method and frequency of the switching, these inverters may be developed in many distinct forms.
output, but also often appear as noise in the control system. These harmonics may also excite mechanical resonances within the motor resulting in an audible ringing. Methods used to remove these harmonics include harmonic elimination, where the switches are controlled to eliminate certain harmonics, and harmonic cancellation, where the outputs of multiple inverters are added to cancel certain harmonics.
A final method of harmonic reduction, using pulse-width modulated (PWM) wave-forms, introduces an entire class of converters. High-frequency PWM inverters are advantageous over lower-frequency inverters as they move the undesirable harmonics in the output to a higher frequency. Conventional filtering techniques may then be used to remove the harmonics. One interesting advantage in using such an inverter to drive a three-phase load is the elimination of all third order harmonics. Because the centerpoint of the wye connected load (neutral of the motor) is left unconnected,
the sum of the currents at the three output terminals must be zero. In other words,
if the currents are expressed as Fourier series, the terms of the three current series
must sum to zero. If the three output currents are
iA = I1sin wt + I2sin 2wt + I3sin 3wt +.
2w 2w 2w
iB
=
I1 sin(wt
+ -) + I
2
sin2(wt+
-) + I
3
sin3(wt+ -) +..
3 3 3
41r 4r 47r
ic = I1sin(wt + -- ) + I2sin2(wt+ -) + I3 sin3(wt + -) +...
then their sum iA + iB + i would contain only the third order harmonics. However, as no net current or voltage can be present on the output, there can be no third order harmonics in the output waveforms.
A simplified voltage-source PWM inverter for a three-phase system is shown in Figure 4-1. The points A, B, and C are directly connected to the three terminals on the motor. The states of the switches 1-6 are determined by the PWM signals generated by the controller. When controlling the switches, no two switches on the same leg (1 and 2, 3 and 4, 5 and 6) can be on at the same time, as that would present
+ Vbus -A I 0 -A 2 \
1
3 -B 4 \ T 5 -C 6 \ T CFigure 4-1: Schematic of a three-phase inverter bridge with wye configured motor
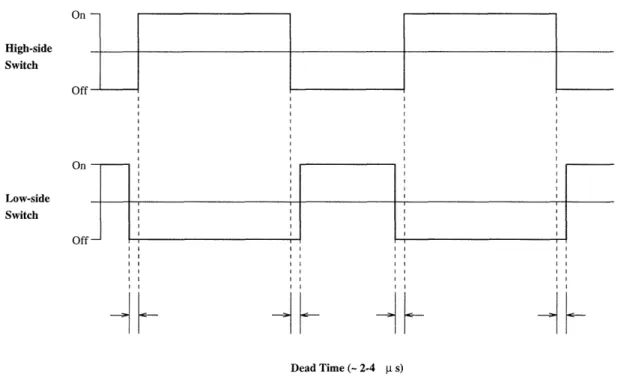
On High-side Switch Off On Low-side Switch Off Dead Time (- 2-4 s)
Figure 4-2: Illustration of the dead time during which both switches on the same leg are off.
a short across the bus voltage. Therefore, the PWM waveform used to control the high switch is inverted and then used to control switch the low switch. Due to non-zero rise and fall times of the switches, a period of 2-4 us is added during which time both switches are off. This delay, shown in Figure 4-2 is often termed dead time.
To create 120° phase-shifted sinusoidal waveforms in the current of the three phases, the switches are turned on and off in a sequence similar to a binary counter: only one set of switches is changed during each cycle. In other words, the general progression would be
B
I
I I I I I I I I
(101) (100) (110) (010) (011) (001)
This switching pattern is determined by the space vector modulation performed in the controller (see Section 3.4.2).
4.2
The Switches
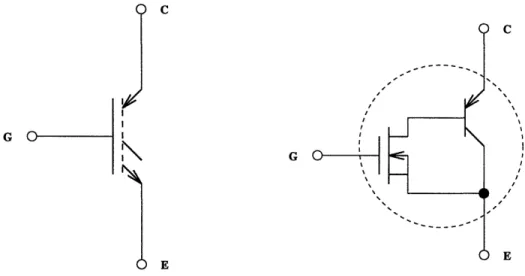
A variety of power semiconductor devices may be used to function as switches for the inverter. Each device has its own advantages and the use of one switch over another is largely determined by the application. For a high-power, relatively low frequency (below 25 kHz) system, a combination of two of the devices, an n-channel MOSFET and a pnp BJT, is ideal. The two are cascaded together in a Darlington-like connection, and the entire package is termed an insulated gate bipolar transistor
(IGBT). (See Figure 4-3) The result is a device with the drive simplicity of a MOSFET and the low forward drop per unit area of a BJT which works well in high-voltage, high-power applications. The Darlington connection alone is advantageous because
the base current required to drive the pair of transistors is less than that required to drive either the MOSFET or the BJT alone. Furthermore, in this configuration,
the MOSFET is protected from the full off-state voltage of the IGBT, reducing the device area required by the MOSFET.
The on transition time of the device is that of the BJT. However, the turn-off transition time is much longer than that of the BJT alone. By integrating the BJT and the MOSFET instead of using discrete devices, the base of the BJT is
Yc
C G I~~~~~~~~~~~~~~~~~~~~~ I I I\ G I0 NS '\~~~~~~~~~~~~~~~~~~~~~~~~~~~~~~~~~~ E U EFigure 4-3: The IGBT and its equivalent connection of a MOSFET and a BJT. not accessible. Therefore, the turn-off time cannot be improved by drawing negative
current from the base of the BJT.
One advantage, however, of integrating the two devices is that when the IGBT is on, the BJT is also on, significantly reducing the drain resistance of the MOSFET. As discrete devices, the resistive drop of the MOSFET would be reflected in a higher
collector-base voltage, and therefore higher collector-emitter, voltage.
4.3 Gate Drives
One of the crucial elements of the power electronic system is the circuitry used to drive the gates and bases of the power semiconductor switches. The gate drives not
only control the state of the switch, but often also serve to protect the rest of the
power circuit in cases of impending failure such as excesses in voltage or current. A gate drive circuit generally consists of two parts. The first part is a generally straightforward signal processing circuit that creates the desired timing and wave-shapes, such as adding the aforementioned dead time into the signals. This is usually constructed using TTL or CMOS logic devices, op-amps, and comparators. The sec-ond stage of the gate drive transforms the low-level signals generated in the first stage into the levels of voltage and current required by the power semiconductor switches.
.Z I 'k I -l I I I I f !
nection, this requires each gate drive to be isolated from one another. A separate power supply is then necessary for each individual gate drive. Electrical isolation of the drive circuit from the device may be also needed and may be achieved by using
Chapter 5
Power Measurements
The final measurement of the performance of a motor is determined by its efficiency. The efficiency of the entire system can be quite easily determined: both the power entering the system and the output power of the system are readily measurable. How-ever, to improve the efficiency of the system, it is also useful to know how the losses
are distributed throughout the system. Attributing the losses to the various
compo-nents of the system, such as to the motor or the power devices, can be increasingly complicated and tedious depending upon the accuracy required. This chapter ex-plores the power losses which occur within the power devices and the motor. Finally, a practical way of allocating power losses throughout the system is described.
5.1 Inverter Losses
As a power-transforming element, an inverter will always contain some internal losses. These losses are difficult to rate as they are very dependent on the characteristic of the load and the expected speed range. For example, inverter efficiencies may be quite different for an application involving a constant-torque load at variable speeds and an application involving a constant-speed load at variations in load torque. These effi-ciencies may be determined using a variety of methods, including calculation of losses of individual elements in the inverter, actual heat loss measurements in an enclosed
load.
5.1.1 Losses in the switches
Within a semiconductor, there exist three main sources of power loss.
* Power loss during forward conduction, when the switch is on. In a transistor this power loss is equivalent to the sum of the collector losses (product of collector current and voltage) and base losses (product of base current and voltage).
Generally, the base losses are small compared to the collector losses.
* Leakage losses, when the switch is off. These losses are generally negligible compared to the forward conduction losses.
* Switching losses, when turning on or off the device. Generally, these losses only become substantial at high frequencies. However, even at lower frequencies, a slow turn-off or turn-on transient, which allows large amounts of current to flow while the voltage across the device is still large, can create spikes in the power waveform.
As a side note, these inefficiencies result in a rapid increase in temperature of the device, especially at high power levels. Unless this heat is quickly dissipated, dam-age to the device could occur. For this reason, functional cooling systems, often accomplished with a type of heatsink, are an essential element of any inverter.
5.2 Motor Losses
A number of methods exist to determine the efficiency of a motor, including using a mechanical brake to load the motor, using a dynamometer, as well as using an equivalent circuit model to determine losses. Although no one method is suitable for all motors, the most common method by far is the use of a dynamometer. The
dynamometer is used to load the motor, and the motor torque is then measured by
the input power and the output power, and the efficiency of the motor may be calcu-lated with these two values alone. However, it is often instructive to understand the distribution of the losses within the motor in trying to improve efficiency.
5.2.1 Individual losses within the motor
Losses in the motor may be distributed between the following five different sources:
* Primary I2R
* Iron
* Secondary 12R
* Friction and windage
* Stray Load
Primary I2R losses are the ohmic losses due to current passing through the copper windings of the stator. By increasing the cross-sectional area of the windings, the effective resistance could be reduced, thereby reducing the primary I2R losses. How-ever, adding to the cross-sectional area not only increases the weight of the motor, but also its cost.
Iron losses occur as a result of the magnetic field in the stator laminated steel core which oscillates at the line frequency and higher harmonics. These losses vary as some power, greater than 1.0, of the magnetic flux density of the iron, and therefore can be reduced by reducing the flux density. This can be achieved by adding length to the stator core or also by using a higher grade of steel for the laminations and reducing the thickness of the laminations. The quality of a magnetic steel is affected by its silicon content and its processing during manufacturing. Increasing the silicon content, as well as annealing the steel, can reduce the core losses. Reducing the thickness of the laminations reduces the eddy current component of the losses. Similar iron losses in the rotor laminations are regarded as negligible since the the magnetic field oscillations
Secondary I2R losses are similar to the primary I2R losses for the rotor. How-ever, decreasing the secondary I2R losses cannot be done as simply as increasing the conductor material in the rotor. The starting torque of the motor is proportional to its secondary resistance. Because of NEMA (National Electrical Manufacturing Association) standards requiring some minimum starting torque, the secondary I2R losses can be varied only within a limited range. For this reason, the secondary I2PR losses are rarely altered from the original design.
All losses associated with rotation come under friction and windage losses. The rotor fan blades which circulate air internally within the motor contribute to windage losses, and the frictional losses appear as heat generated in the bearings. In a fan-cooled motor, a major component of the friction and windage losses is the power taken by the external fan. Because energy efficient motors have less losses to be dissipated than standard motors, a smaller external fan may often be used. This in itself serves to reduce friction and windage losses.
Finally, stray-load losses are the difference between the total motor losses and the sum of the other four losses (primary I2R, iron, secondary I2R, and friction and windage). In other words, stray-load losses are those losses not covered by the other four. For example, the flux density in the air gap is considered to be sinusoidal, but due to the slotting of the stator and the rotor, it actually contains many imperfections. These imperfections result in high frequency currents in the rotor bars leading to iron losses in the rotor and stator teeth near the air gap.
Because there exist many different factors resulting in stray-load losses, they are often difficult to control. Nonetheless, they can develop into a significant portion of the total motor losses. A combination of careful design and manufacturing can significantly reduce stray-load losses and thereby improve the overall efficiency of the motor.
5.2.2
Computation of motor efficiency
With a no-load saturation test and a dynamometer test, the individual motor losses described in the previous section may be computed approximately. The no-load
0 U 0 0 Power, rent, Voltage
Figure 5-1: Typical no-load saturation curve for an induction motor.
ID
0
:-C Friction and Windage Losses, W FW
Volts2
Figure 5-2: Determination of friction and windage losses from a no-load saturation test. saturation test is performed by measuring voltage, current, power, and winding tem-perature for several values of applied voltage. A typical curve of power and current plotted against voltage is shown in Figure 5-1. Friction and windage losses, WFW, is determined by using the lower values of voltage from the no-load saturation curve and plotting power against the square of the voltage as shown in Figure 5-2. Extrapolating this line to zero volts gives a value for WFW.