HAL Id: hal-01962604
https://hal.sorbonne-universite.fr/hal-01962604
Submitted on 20 Dec 2018
HAL is a multi-disciplinary open access
archive for the deposit and dissemination of
sci-entific research documents, whether they are
pub-lished or not. The documents may come from
teaching and research institutions in France or
abroad, or from public or private research centers.
L’archive ouverte pluridisciplinaire HAL, est
destinée au dépôt et à la diffusion de documents
scientifiques de niveau recherche, publiés ou non,
émanant des établissements d’enseignement et de
recherche français ou étrangers, des laboratoires
publics ou privés.
Models of Rosetta/OSIRIS 67P dust coma phase
function
Fernando Moreno, Daniel Guirado, Olga Muñoz, Ivano Bertini, Cécilia
Tubiana, Carsten Güttler, Marco Fulle, Alessandra Rotundi, Vincenzo Della
Corte, Stavro Ivanovski, et al.
To cite this version:
Fernando Moreno, Daniel Guirado, Olga Muñoz, Ivano Bertini, Cécilia Tubiana, et al.. Models of
Rosetta/OSIRIS 67P dust coma phase function. Astronomical Journal, American Astronomical
Soci-ety, 2018, 156 (5), pp.art. 237. �10.3847/1538-3881/aae526�. �hal-01962604�
Models of
Rosetta/OSIRIS 67P Dust Coma Phase Function
F. Moreno1 , D. Guirado1, O. Muñoz1 , I. Bertini2, C. Tubiana3, C. Güttler3, M. Fulle4 , A. Rotundi5,6 , V. Della Corte5,6, S. L. Ivanovski5 , G. Rinaldi5, D. Bockelée-Morvan7, V. V. Zakharov5,8, J. Agarwal3 , S. Mottola9, I. Toth10, E. Frattin2, L. M. Lara1, P. J. Gutiérrez1, Z. Y. Lin11, L. Kolokolova12, H. Sierks13, G. Naletto14,15,16, P. L. Lamy17, R. Rodrigo18,19 , D. Koschny20, B. Davidsson21, M. A. Barucci22, J.-L. Bertaux17, D. Bodewits23 , G. Cremonese24, V. Da Deppo16, S. Debei25, M. De Cecco26, J. Deller13, S. Fornasier22, W.-H. Ip27,28, H. U. Keller9,29, M. Lazzarin30, J. J. López-Moreno31, F. Marzari14 , and
X. Shi13
1
Instituto de Astrofísica de Andalucía, CSIC, c/ Glorieta de la Astronomía s/n, E-18008 Granada, Spain;[email protected]
2
Department of Physics and Astronomy“G. Galilei,” University of Padova, Vicolo dell’ Osservatorio 3, I-35122 Padova, Italy
3
Max-Planck-Institut für Sonnensystemforschung, Justus-von-Liebig-Weg, 3, D-37077 Göttingen, Germany
4
Osservatorio Astronomico, Via Tiepolo 11, I-34143 Trieste, Italy
5
INAF—Istituto di Astrofisica e Planetologia Spaziali, Via Fosso del Cavaliere, 100, I-00133 Rome, Italy
6
Universitá degli Studi di Napoli Parthenope, Dip. di Scienze e Tecnologie, CDN IC4, I-80143 Naples, Italy
7
LESIA, Observatoire de Paris, PSL Research University, CNRS, Sorbonne Universités, UPMC Univ. Paris 06, Univ. Paris-Diderot, Sorbonne Paris Cité, 5 place Jules Janssen, F-92195 Meudon, France
8
Laboratoire de Météorologie Dynamique, UPMC, Sorbonne Universités, Paris, France
9
Deutsches Zentrum für Luft- und Raumfahrt(DLR), Institut für Planetenforschung, Rutherfordstraße 23, D-12489 Berlin, Germany
10MTA CSFK Konkoly Observatory of the Hungarian Academy of Sciences, Konkoly Thege M. ut 15-17. H1121 Budapest, Hungary 11
National Central University No. 300 Jhongda Rd., Jhongli city, Taoyuan County, 320, Taiwan
12
Planetary Data System Group, Department of Astronomy, Rm. 1207D, Atlantic Bldg., University of Maryland, College Park, MD 20742, USA
13
Max Planck Institute for Solar System Research, Justus-von-Liebig-Weg 3, D-37077 Göttingen, Germany
14
University of Padova, Department of Physics and Astronomy“Galileo Galilei,” Via Marzolo 8, I-35131 Padova, Italy
15
University of Padova, Center of Studies and Activities for Space(CISAS) “G. Colombo,” Via Venezia 15, I-35131 Padova, Italy
16
CNR-IFN UOS Padova LUXOR, Via Trasea 7, I-35131 Padova, Italy
17
Laboratoire Atmosphères, Milieux et Observations Spatiales, CNRS & Université de Versailles Saint-Quentin-en-Yvelines, 11 Boulevard dAlembert, F-78280 Guyancourt, France
18Centro de Astrobiología, CSIC-INTA, E-28850 Torrejón de Ardoz, Madrid, Spain 19
International Space Science Institute, Hallerstrasse 6, 3012 Bern, Switzerland
20
Science Support Office, European Space Research and Technology Centre/ESA, Keplerlaan 1, Postbus 299, 2201 AZ Noordwijk ZH, The Netherland
21
Jet Propulsion Laboratory, M/S 183-401, 4800 Oak Grove Drive, Pasadena, CA 91109, USA
22
LESIA, Observatoire de Paris, PSL Research University, CNRS, Univ. Paris Diderot, Sorbonne Paris Cité, UPMC Univ. Paris 06, Sorbonne Universités, 5 place Jules Janssen, F-92195 Meudon, France
23
Department of Astronomy, University of Maryland, College Park, MD 20742-2421, USA
24INAF, Astronomical Observatory of Padova, Vicolo dell’Osservatorio 5, I-35122 Padova, Italy 25
University of Padova, Department of Industrial Engineering, Via Venezia 1, I-35131 Padova, Italy
26
University of Trento, Faculty of Engineering, Via Mesiano 77, I-38121 Trento, Italy
27
Graduate Institute of Astronomy, National Central University, 300 Chung-Da Rd, Chung-Li 32054, Taiwan
28Space Science Institute, Macau University of Science and Technology, Avenida Wai Long, Taipa, Macau 29
Institut für Geophysik und extraterrestrische Physik, Technische Universität Braunschweig, Mendelssohnstr. 3, D-38106 Braunschweig, Germany
30
University of Padova, Department of Physics and Astronomy“Galileo Galilei,” Vicolo dell’Osservatorio 3, I-35122 Padova, Italy
31
Instituto de Astrofísica de Andalucía(CSIC), c/Glorieta de la Astronomia s/n, E-18008 Granada, Spain
Abstract
The phase function of the dust coma of comet 67P has been determined from Rosetta/OSIRIS images. This function shows a deep minimum at phase angles near 100°, and a strong backscattering enhancement. These two properties cannot be reproduced by regular models of cometary dust, most of them based on wavelength-sized and randomly oriented aggregate particles. We show, however, that an ensemble of oriented elongated particles of a wide variety of aspect ratios, with radii r10 μm, and whose long axes are perpendicular to the direction of the solar radiation, are capable of reproducing the observed phase function. These particles must be absorbing, with an imaginary part of the refractive index of about 0.1 to match the expected geometric albedo, and with porosity in the 60%–70% range.
Key words: methods: numerical– minor planets, asteroids: individual (67P/Churyumov–Gerasimenko)
1. Introduction
One of the goals of the Rosetta mission was the characterization of the dust environment of comet 67P, with several instruments being devoted to this task. In particular, the dust phase function has been measured in the optical range from images taken by the OSIRIS cameras(Bertini et al.2017).
The phase function was retrieved in a wide range of phase angles in a time interval of about two hours. As these conditions cannot be met from the ground, the OSIRIS
measurements are unique. So far, the phase function is available only for a handful of short-period comets observed from Earth, though it is restricted to the backscattering domain most of the time (see Bertini et al. 2017, and references therein). In addition, for Earth-based observations, the phase angle dependence is always inherently mixed with temporal and heliocentric distance variability in the coma, so that it is often difficult to disentangle the intrinsic activity from the phase effect. Notwithstanding this, an overall agreement of the
OSIRIS phase functions with those derived from the ground is found(Bertini et al.2017).
2. The OSIRIS Phase Function
Bertini et al. (2017) have retrieved phase functions from
OSIRIS WAC and NAC images, at varying heliocentric and nucleocentric distances, with the Orange F22 filter (effective wavelength λeff=642.2 nm), and the Green F21 filter
(λeff=537.2 nm; see their Figure 4). During the phase
function measurements, the phase angle Sun–comet-spacecraft (i.e., the nucleus elongation) remained close to 90°. The geometry of the observations can be seen in Figure1(b) of Bertini et al.(2017).
For the purpose of comparison with models, we only consider the MTP020/071 phase function (obtained near perihelion), which is representative of most phase curves, although we also display in most figures the MTP025/092 curve (rh=2.18 au post-perihelion) for completeness. That
phase curve is the one that shows the shallowest slope in the backscattering regime (see Figure 1). The corresponding
spacecraft(S/C) ranges were 420 km and 80 km, respectively, indicating that the particles along the line of sight of the OSIRIS cameras were well outside the gas acceleration region (at ∼12 km, see Gerig et al. 2018). The large nucleocentric
distances of the S/C (particularly during the perihelion measurements) and the fact that the pointing is directly away from the nucleus position would suggest that the phase function can only be minimally affected by different optical depth along distinct lines of sight. In any case, the true 3D+t nature of the dust distribution, which would be needed to obtain the optical depth along any line of sight, is unknown, and will only be unveiled by complex coupled gas and dust dynamics modeling (e.g., Crifo2006; Zakharov et al.2018, and references therein).
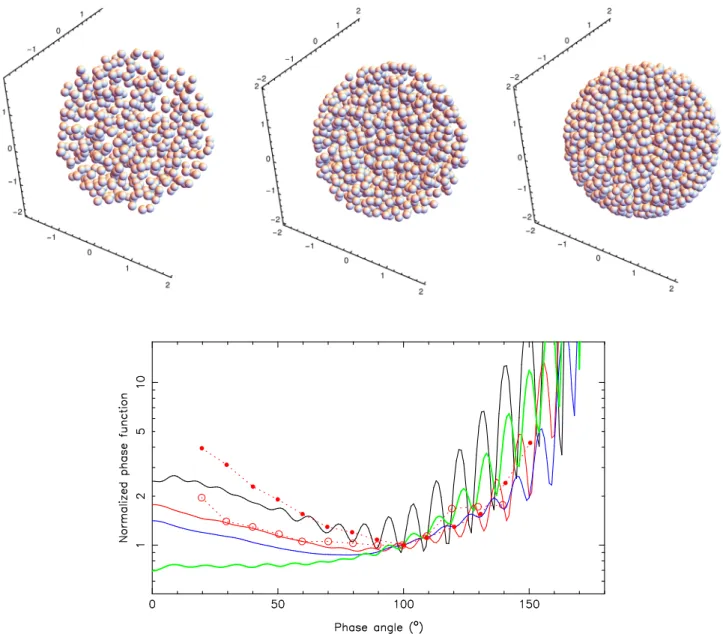
Figure 1.Backscattering enhancement test. Top three panels: 2μm radius spherical volumes filled with (left to right) 500, 1000, and 2500 randomly located 0.1 μm radius spherules, leading to porosities of 93.7%, 87.5%, and 69.0%, respectively. XYZ labels are inμm. Bottom panel: OSIRIS phase functions (red solid circles for MTP020/071 and red open circles for MTP025/092) compared with MSTM calculations for the above clusters. Blue, red, and black thin lines correspond to porosities of 93.7%, 87.5%, and 69.0%, respectively. The thick green line corresponds to the Mie theory phase function for a homogeneous and compact sphere of 2μm radius. All phase functions are normalized to unity at a phase angle of 100°.
3. Modeling the Phase Function
3.1. Models Assuming Size Distributions of Randomly oriented Particles
All previous models of cometary dust (e.g., Kimura et al. 2003; Bertini et al. 2007; Moreno et al. 2007; Lasue et al.2009; Kolokolova et al.2015; Zubko et al.2016) are built
under the hypothesis that the coma is a cloud of particles in random orientations. However, none of those models is able to reproduce the phase function curve derived from the OSIRIS images. In addition, the models based on fluffy, wavelength-sized, aggregate particles (e.g., Kimura et al. 2003) typically
display a maximum in the degree of linear polarization that is too high in comparison with observations (e.g., Levasseur-Regourd et al.1996). Kimura et al. (2006) and Kolokolova &
Mackowski (2012) explain this fact as a computer limitation
associated to the limited amount of monomers, showing that the maximum of polarization decreases as the amount of monomers increase. A rough spheroid model has been introduced by Kolokolova et al. (2015), which consists of a
wide size distribution of such spheroids. That model matches the observed degree of linear polarization and the color properties much better, but, as it has been stated, the modeled phase functions show only a modest backscattering enhance-ment and have minima at phase angles much smaller than 100°, otherwise in agreement with the composite phase function curve obtained from a compilation of ground-based observa-tions from various comets by D. Schleicher(http://asteroid. lowell.edu/comet/dustphase.html). In contrast, randomly
oriented mm-sized grains display phase functions with minima near 150° of the phase angle (Muñoz et al.2017). On the other
hand, to explain the observations of linear polarization versus phase angle accurately, models of mixtures of compact and aggregate particles have been introduced by e.g., Lasue et al. (2009) and Das et al. (2011), as well as mixtures of weakly and
highly absorbing agglomerated debris particles (Zubko et al.2016).
All of those previous models assume either monodisperse distributions of wavelength-sized particles, or polydisperse distributions peaking in the submicrometer range. However, there are indications that the dominant scatterers in 67P might be larger, as indicated by the small amount of submicron and micron-sized particles detected by Rosetta/MIDAS, much less than initially expected (Mannel et al. 2017; C. Güttler et al. 2018, in preparation). Also, the analysis of thermal spectra of the quiescent coma performed with Rosetta/VIRTIS-H implies a minimum radius of compact particles of 10μm (in combination with 25% offluffy aggregate particles in number, whose contribution to the scattered light is minimal) (Bockelée-Morvan et al.2017a,2017b). The study of the evolution of the
67P dust size distribution by Fulle et al.(2016b) confirms that
the coma brightness at perihelion and later is in fact dominated by particles <100 μm. In addition, the analysis of a large ground-based image data set by Monte Carlo dust tail modeling (Moreno et al. 2017) agrees with that constraint. This model
replicated tail images from the current apparition, from about 4.5 au pre-perihelion to 3 au post-perihelion, as well as trail data from the current and previous orbits. The minimum model particle size was 10μm in all cases.
Given these facts, we started by trying models having randomly oriented particles of sizes larger than the nominal incident wavelength, assumed atλ=0.6 μm. For this task, we
used available light scattering codes such as the T-matrix code of spheroids (Mishchenko et al. 1996), the Multi-Sphere
T-matrix (MSTM) code (Mackowski & Mishchenko 2011),
and the geometric optics code by Macke & Mishchenko(1996)
for ellipsoids. Except for the geometric optics code, the computing time and memory requirements are a rapidly increasing functions of the size parameter, X=2πr/λ. This imposes strong limits to the simulations, for which we should keep the number of possible combinations of input parameters to a minimum.
One important constraint to the model is the observed geometric albedo. The nucleus geometric albedo at 649 nm is 0.0677±0.0039 (Fornasier et al.2015), and it is reasonable to
assume that large particles in the coma will have the same geometric albedo, provided they do not experience any change in their physical properties after ejection, such as sublimation of volatiles or fragmentation. These processes have been found to be negligible in the Rosetta studies of the 67P’s coma (Fulle et al.2015).
To meet the geometric albedo constraint we must assume absorbing particles. The precise value of the mean refractive index of 67P dust coma particles is unknown. We used a refractive index of m=1.6+0.1i, a value comprised between low-absorbing silicates and strongly absorbing organic and carbonaceous materials at red wavelengths (see e.g., Jennis-kens 1993). To calculate the scattering pattern of relatively
large particles, we used the MSTM code for an array of spherules. Since we are searching for scatterers giving a high backscattering enhancement, we started by following a procedure similar to that devised by Mishchenko et al. (2007). To demonstrate the onset and development of the
coherent backscattering mechanism, which is the responsible for the backscattering enhancement, Mishchenko et al.(2007)
considered a certain scattering volumefilled with an increasing number of small scatterers. We performed a similar calculation by considering a spherical volume of r=2 μm containing 500, 1000, and 2500 randomly placed 0.1μm radius spherules, giving a porosity, P, of 93.7%, 87.5%, and 69.0%, respectively (see Figure1, top panels). To obtain the scattering functions, we assumed that the array of scatterers is illuminated from a given direction, and then compute the azimuthally averaged scattering matrix, i.e., the average scattering matrix for all the scattering planes about the direction of the incoming beam. Then, for a given number of spherules, we repeated the simulation for a large number of such randomly generated targets. This procedure is much less CPU time consuming than generating the scattering matrix for a single randomly oriented scatterer.
The resulting phase functions are displayed in Figure1. Also shown are the results corresponding to a single homogeneous r=2 μm sphere calculated from Mie theory, just to show the large discrepancies of that simple model with the MSTM models in the phase function. Concerning the MSTM models, we see that as the number of spherules in the volume increases, the backscattering enhancement also increases. In order to check whether this trend is maintained for still lower porosities, we first increase the number of spheres up to ∼3100, corresponding to P=61%, but we obtained very similar results to that of P=69%. This P=61% is essentially the lower limit reachable with our simple random packing procedure. To decrease P, we had to use a more complex technique than random packing. Among the techniques
available, we used a “falling down” algorithm (Fulle & Blum2017). With this code, we were able to generate spherical
volumes having P in the range 55%–45%, i.e., containing some 3600–4400 spherules. At these porosity levels, we noticed a reversal in the trend, i.e., a decrease in backscattering enhancement as compared with that found in the P∼60%– 70% range. We then conclude that this porosity range is the one that gives the highest backscattering enhancement. We under-line that this conclusion is based on the specific spherical volume described above (see Figure 1, top panels). Larger volumes would have been desirable to test, but, as stated above, we are strongly constrained by computer memory and CPU time limitations.
It is interesting to note that the porosity range for which the highest backscattering enhancement is observed agrees with the nucleus porosity, estimated at 71±8% by Fulle et al. (2016a),
and is also consistent with the value found specifically for the upper layers of the surface, which is below 74% from Philae SESAME/CASSE and MUPUS (Knapmeyer et al.2018). It is
also not far from the Rosetta/MIDAS and Rosetta/GIADA results for relatively compact particles (∼50%, see Fulle & Blum2017).
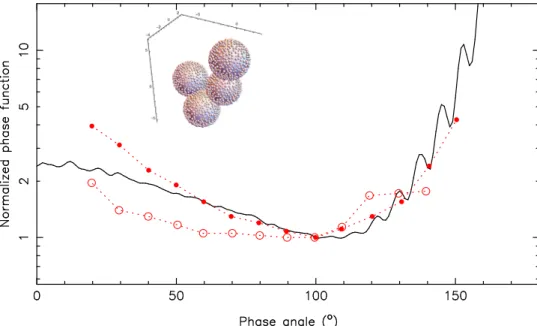
The following step was to explore other configurations of arrays of spherules of total size larger than the wavelength to test whether an improvement in thefits could be achieved. We built larger particles by increasing the number of spherical monomers, but owing to the limitations in computer time and memory, we had to combine larger spherical monomers with smaller ones, although we could not find a satisfactory fit in any case. An example of those configurations is shown in Figure2, in which a cluster of four 2μm spheres is randomly peppered by a total of 2000 0.1–0.15 μm radius spherules having a total equivalent spherical radius(radius of a sphere of equal volume), req∼3.4 μm. This particular arrangement
gives an overall better fit to the phase function, mainly for the forward lobe, but fails at reproducing the observed backscattering enhancement.
To test the performance of still larger particles, we had to resort to the geometric optics code. As mentioned, we used the
code for ellipsoidal particles by Macke & Mishchenko(1996).
We have tested a variety of ellipsoids of different sizes and axes ratios, but the computed phase functions are all flat at backscattering, similarly to large homogeneous spheres. In conclusion, none of the considered models of randomly oriented particles at a wide range of sizes can reproduce reliably the OSIRIS phase function.
3.2. Models Assuming Size Distributions of Particles Aligned to the Solar Radiation Direction
The presence of aligned particles in the cometary environ-ment has been subject of research for many years, since the early work of Dolginov & Mytrophanov(1976). In the nucleus
acceleration region, comet gravity, and aerodynamic forces should dominate (Fulle et al. 2015; Ivanovski et al. 2017a).
Outside that region, radiative torques, although ignored for many years, might play an important role (see e.g., Draine & Weingartner 1996; Lazarian 2003; Rosenbush et al. 2007).
Interestingly, alignment of the particles with respect to the solar radiation will place the long axes of the particles perpendicular to radiation(Rosenbush et al.2007).
For the radiative torques to be efficient as the alignment mechanism, the characteristic time of alignment should be shorter than the flight time of the particles along the line of sight of the OSIRIS camera. Kolokolova et al.(2016), based on
a study by Hoang & Lazarian(2014), estimate that for the 67P
environment, a 10μm oblate spheroid would be aligned in ∼3×10⁵s. Assuming a radial trajectory and a constant speed
of 10 m s−1 (Lin et al. 2016), that particle would become
aligned at a distance of 3000 km from the nucleus. Thus, it appears that this mechanism alone would not be sufficient to provide the required alignment, at least for those particles in the vicinity of the S/C. However, in addition to radiative torques, there is another mechanism that could be playing a role, which is the mechanical alignment by gas-particle relative motion (Gold 1952) and aerodynamic force (e.g., Ivanovski
et al. 2017b). The Gold alignment mechanism, which is
efficient for supersonic gas flow (as in a cometary coma, see e.g., Zakharov et al.2018) would be characterized by particles
Figure 2.OSIRIS phase functions(red solid circles for MTP020/071 and red open circles for MTP025/092) compared with MSTM calculations (solid black line) for peppered sphere clusters such as that shown on the inset. XYZ labels on the inset are given inμm. All phase functions are normalized to unity at a phase angle of 100°.
having their longer axes directed preferentially along the gas flow due to the tendency of the particle to minimize its cross section in the gasflow (Rosenbush et al.2007). The gas flow is
radial at distances greater than about 20 km from the nucleus (Marschall et al.2016). The particles experience this radial gas
flow until the gas decoupling distance, at some 20 nuclear radii (i.e., about 30 km). After that, there is no other mechanism that can affect their orientation except radiative torque which produce alignment in the same direction—long axis perpend-icular to the radiation, thus, keeping the original gas alignment. This direction is nearly perpendicular to the direction of the solar radiation for particles in the vicinity of the S/C during the perihelion phase function measurements (see Figure1(b) by Bertini et al. 2017). Thus, the radiative torque and the Gold
mechanism working together might explain the alignment of the particles. However, although a quantitative evaluation of the efficiency of those mechanisms in terms of the physical properties of the particles should be certainly performed, this is beyond the scope of this paper.
To model aligned scatterers, we consider that the particles have their long axes perpendicular to radiation, and calculate the azimuthally averaged scattering matrix. For these simula-tions, we assumed spheroidal particles, because in this way we can encompass a wide range of sizes with same geometry. The spheroids have axes(a, b, c), where a=b>c for oblate, and a>b=c for prolate spheroids, respectively. The axis ratio is defined as ò=a/c. Thus, oblate spheroids are set with the c-axis parallel to the solar radiation, and prolate spheroids are set with the a-axis perpendicular to the solar radiation.
Although we know that the dominant scatterers in 67P must be larger than the wavelength, for completeness, we performed simulations for a wider range of sizes, starting from the submicron domain. This will show that the dominant scatterers must be, in fact, much larger. Thus, for distributions of small sized particles, we used the T-matrix method for spheroids by Mishchenko et al. (1996). We start by considering oblate
spheroids only, because they provide a higher backscattering enhancement than prolate spheroids for a given req. In addition,
oblate spheroids might indeed provide a good description of cometary dust particles as has been found from laboratory
experiments by Stephens & Gustafson(1991), and recently by
Bischoff et al. (2018). Both studies dealt with mixtures of
volatile and refractory materials and showed that during the sublimation of volatile materials, the refractory materials form a thin mantle that eventually cracks, being lifted from the surface. Bischoff et al. show that these cracked pieces have a diameter of up to 5–10 times larger than the thickness of the mantle, i.e., they are flake-like particles resembling oblate spheroids of large axis ratio.
We generated scattering matrices for size distributions of such spheroidal particles, for which we assumed ò=2. Figure 3 shows two simulations with such spheroids being distributed according to a differential power law of index−3.5 (a typical value for 67P dust coma), and with three different values of the minimum size, 0.1, 0.3, and 1.5μm, the maximum size being rmax=2.5 μm in all cases. From
Figure 3, it is clear that the larger the sizes the better the agreement with the OSIRIS phase function. On the other end, submicron-dominated size distribution functions fail at fitting the phase function.
Sizes substantially larger than the maximum radius assumed in the previous model of spheroids(rmax=2.5 μm with ò=2)
cannot be efficiently handled with the T-matrix code. To build larger particles, we fill oblate spheroidal volumes with spherules of the order of the nominal wavelength or smaller, as input to the MSTM code, with an average porosity of 65%– 70%, i.e., near the optimal values found for the 2μm spherical volume described in the previous section. We built oblate spheroidal volumes with axial ratios in the rangeò=2–3, and with equivalent spherical radius of 3.1, 4.6, and 7.0μm, filled with approximately 1000, 1500, and 4000 spherules, respec-tively, where the radii of the spherules range from 0.1 to 0.6μm. Owing to computing time limitations, the number of realizations for each size was limited to 256, 36, and 20, respectively. Figure4 shows the resulting phase functions for the three sizes, where we can notice again how the agreement with the typical OSIRIS phase function tends to improve as the particle size increases, in both forward and backward lobes.
So far, only oblate spheroids up to a size of req=7 μm have
been considered as model particles. We have to extend the
Figure 3. OSIRIS phase functions(red solid circles for MTP020/071 and red open circles for MTP025/092) compared with T-matrix calculations for size distributions of oriented, compact, and oblate(ò=2, as that shown) spheroids: the black, blue, and green lines are for size distributions having rmin=0.1, 0.3, and
upper size limit in the model to larger sizes, as measured by several instruments on board Rosetta, and inferred from the ground. In addition, we have to extend the particle shape distribution by taking into account a mixture of oblate and prolate particles, as would be required to simulate any natural dust sample. Thus, for a given equivalent spherical radius, we assumed a uniform distribution of axes ratios, i.e., the same amount of prolate and oblate spheroids.
To generate the shape-averaged scattering matrix, we used the individual matrices calculated using the geometric optics code by Macke & Mishchenko (1996). Figure 5 shows a comparison of the results obtained for three equivalent spherical radii (req=10 μm, req=100 μm, and
req=1000 μm) with the OSIRIS phase function, for a shape
distribution having axes ratios in the interval ò=[0.25, 4]. This wide axes ratio distribution is not surprising, in view of thefindings by Fulle et al. (2017) who inferred aspect ratios of
five or more in order to explain the bulk densities of the particles measured by GIADA during the whole mission.
As it is seen, the synthetic phase functions are close at backscattering, but the one for the smaller radius gives a better fit at large phase angles. In addition, the resulting geometric albedo is 0.06, very close to that obtained at the nucleus surface (Fornasier et al. 2015). The inferred particle size is consistent
with the ground-based tail modeling, where differential power-law size distributions of index −3 and minimum particle radius of 10μm were found to be consistent with the observations(Moreno et al.2017). This is also consistent with
MIDAS results, where a very small amount of micron-sized particles or smaller were detected (Mannel et al. 2017; C. Güttler et al. 2018, in preparation), and with VIRTIS-H thermal spectra modeling where minimum sizes of relatively compact 10μm particles (combined with 25% fractals in number) following a size distribution of power index −3 or smaller are found (Bockelée-Morvan et al. 2017a, 2017b). It is also
important to note that the phase function shape is maintained for up to mm-sized particles in the backscattering lobe, explaining in that way the results obtained by Fulle et al. (2018), in that the OSIRIS phase function should be applied to
dust diameters up to 2.5 mm at least for the conversion of dust brightness into dust sizes.
4. Conclusions
We have shown that regular models of cometary dust based on wavelength-sized and randomly oriented aggregate particles cannot reproduce the dust phase function determined from Rosetta/OSIRIS observations. Such a phase function can, however, be adequately fitted by assuming that the main scatterers in the 67P coma are large compared to the visual wavelengths (10 μm), show a wide distribution of aspect ratios, and are aligned with their long axes perpendicular to the solar radiation direction. Porosity levels for the particles of 60%–70% would be particularly favored, since those particles would give the largest backscattering enhancement. For a refractive index of m=1.6+0.1i, the geometric albedo for
Figure 4.OSIRIS phase functions(red solid circles for MTP020/071 and red open circles for MTP025/092) compared with MSTM simulations of oriented oblate spheroidal volumesfilled with 0.1 to 0.6 μm spherules. Black, blue, and green lines are for equivalent spherical radii of 3.1, 4.6, and 7.0 μm. The inset illustrates the array of spherules for the largest particle, where the XYZ labels are inμm. All phase functions are normalized to unity at a phase angle of 100°.
Figure 5.OSIRIS phase function measurements for MTP020/071 (solid red circles) compared to geometric optics simulations for three distributions of spheroids with uniform axes ratio in theò=[0.25, 4.0] interval, and having equivalent spherical radii of 10μm (black solid line), 100 μm (black dashed line), and 1000 μm (black dotted line). All phase functions are normalized to unity at 100° of phase angle. As in all the simulations in this work, the refractive index is set to m=1.6+0.1i.
such particles would be ∼0.06, i.e., close to that measured for the nucleus surface.
OSIRIS was built by a consortium of the Max-Planck-Institut für Sonnensystemforschung, in Göttingen, Germany, CISAS-University of Padova, Italy, the Laboratoire dAstro-physique de Marseille, France, the Instituto de Astrofísica de Andalucía, CSIC, Granada, Spain, the Research and Scientific Support Department of the European Space Agency, Noord-wijk, The Netherlands, the Instituto Nacional de Técnica Aeroespacial, Madrid, Spain, the Universidad Politécnica de Madrid, Spain, the Department of Physics and Astronomy of Uppsala University, Sweden, and the Institut für Datentechnik und Kommunikationsnetze der Technischen Universität Braunschweig, Germany. The support of the national funding agencies of Germany (DLR), France (CNES), Italy (ASI), Spain (MEC), Sweden (SNSB; grant No. 74/10:2), and the ESA Technical Directorate is gratefully acknowledged. H.R. was also supported by grant No. 2011/01/B/ST9/05442 of the Polish National Science Center. We thank the ESA teams at ESAC, ESOC, and ESTEC for their work in support of the Rosetta mission We thank the Rosetta Science Ground Segment at ESAC, the Rosetta Mission Operations Centre at ESOC, and the Rosetta Project at ESTEC for their outstanding work enabling the science return of the Rosetta Mission.
We thank Evgenij Zubko for his constructive comments on the paper, and Daniel Mackowski, Michael Mishchenko, and Andreas Macke for making their light scattering codes available.
This work was supported by contracts AYA2015-67152-R and AYA2015-71975-REDT from the Spanish Ministerio de Economía y Competitividad. ORCID iDs F. Moreno https://orcid.org/0000-0003-0670-356X O. Muñoz https://orcid.org/0000-0002-5138-3932 M. Fulle https://orcid.org/0000-0001-8435-5287 A. Rotundi https://orcid.org/0000-0001-5467-157X S. L. Ivanovski https://orcid.org/0000-0002-8068-7695 J. Agarwal https://orcid.org/0000-0001-6608-1489 R. Rodrigo https://orcid.org/0000-0002-3585-380X D. Bodewits https://orcid.org/0000-0002-2668-7248 F. Marzari https://orcid.org/0000-0003-0724-9987 References
Bertini, I., La Forgia, F., Tubiana, C., et al. 2017,MNRAS,469, 404
Bertini, I., Thomas, N., & Barbieri, C. 2007,A&A,461, 351
Bischoff, D., Gundlach, B., Neuhaus, M., et al. 2018, MNRAS, submitted Bockelée-Morvan, D., Rinaldi, G., Erard, S., et al. 2017a,MNRAS,469, 443
Bockelée-Morvan, D., Rinaldi, G., Erard, S., et al. 2017b,MNRAS,469, 842
Crifo, J. F. 2006,AdSpR,38, 1911
Das, H. S., Paul, D., Suklabaidya, A., et al. 2011,MNRAS,416, 94
Dolginov, A. Z., & Mytrophanov, I. G. 1976,Ap&SS,43, 291
Draine, B. T., & Weingartner, J. C. 1996,ApJ,470, 551
Fornasier, S., Hasselmann, P. H., Barucci, M. A., et al. 2015,A&A,583, 30
Fulle, M., Bertini, I., Della Corte, V., et al. 2018,MNRAS,476, 2835
Fulle, M., & Blum, J. 2017,MNRAS,469, 39
Fulle, M., Della Corte, V., Rotundi, A., et al. 2016a,MNRAS,462, 132
Fulle, M., Della Corte, V., Rotundi, A., et al. 2017,MNRAS,469, 45
Fulle, M., Ivanovski, S. L., Bertini, I., et al. 2015,A&A,583, A14
Fulle, M., Marzari, F., Della Corte, V., et al. 2016b,ApJ,821, 19
Gerig, S.-B., Marschall, R., Thomas, N., et al. 2018,Icar,311, 1
Gold, T. 1952,MNRAS,112, 215
Hoang, T., & Lazarian, A. 2014,MNRAS,438, 680
Ivanovski, S. L., Della Corte, V., Rotundi, A., et al. 2017a,MNRAS,469, 774
Ivanovski, S. L., Zakharov, V. V., Della Corte, V., et al. 2017b,Icar,282, 333
Jenniskens, P. 1993, A&A,274, 653
Kimura, H., Kolokolova, L., & Mann, I. 2003,A&A,407, L5
Kimura, H., Kolokolova, L., & Mann, I. 2006,A&A,449, 1243
Knapmeyer, M., Fischer, H.-H., Knollenberg, J., et al. 2018,Icar,310, 165
Kolokolova, L., Das, H. S., Dubovik, O., et al. 2015,P&SS,116, 30
Kolokolova, L., Koenders, C., Goetz, C., et al. 2016,MNRAS,462, 422
Kolokolova, L., & Mackowski, D. 2012,JQSRT,113, 2567
Lasue, J., Levasseur-Regourd, A. C., Hadamcik, E., et al. 2009,Icar,199, 129
Lazarian, A. 2003,JQSRT,79, 881
Levasseur-Regourd, A. C., Hadamcik, E., & Renard, J. B. 1996, A&A,
313, 327
Lin, Z.-Y., Lai, I. L., Su, C. C., et al. 2016,A&A,588, L3
Macke, A., & Mishchenko, M. I. 1996,ApOpt, 35, 429
Mackowski, D. M., & Mishchenko, M. I. 2011,JQSRT,112, 2182
Mannel, T., Bentley, M. S., Boakes, P., et al. 2017, in European Planetary Science Congress, Vol. 11,258
Marschall, R., Su, C. C., Liao, Y., et al. 2016,A&A,589, A90
Mishchenko, M. I., Liu, L., Mackowski, D. W., et al. 2007,OExpr,15, 2822
Mishchenko, M. I., Travis, L. D., & Mackowski, D. W. 1996,JQSRT,55, 535
Moreno, F., Muñoz, O., Guirado, D., et al. 2007,JQSRT,106, 348
Moreno, F., Muñoz, O., Gutiérrez, P. J., et al. 2017,MNRAS,469, 186
Muñoz, O., Moreno, F., Vargas-Martín, F., et al. 2017,ApJ,846, 85
Rosenbush, V., Kolokolova, L., Lazarian, A., et al. 2007,Icar,186, 317
Stephens, J. R., & Gustafson, B. A. S. 1991,Icar,94, 209
Zakharov, V. V., Ivanovski, S. L., Crifo, J. F., et al. 2018,Icar,312, 121

![Figure 5. OSIRIS phase function measurements for MTP020 / 071 ( solid red circles) compared to geometric optics simulations for three distributions of spheroids with uniform axes ratio in the ò=[ 0.25, 4.0 ] interval, and having equivalent spherical radi](https://thumb-eu.123doks.com/thumbv2/123doknet/14740243.576140/7.918.482.848.441.702/function-measurements-geometric-simulations-distributions-spheroids-equivalent-spherical.webp)
