HAL Id: hal-03259659
https://hal.sorbonne-universite.fr/hal-03259659
Submitted on 14 Jun 2021
HAL is a multi-disciplinary open access
archive for the deposit and dissemination of
sci-entific research documents, whether they are
pub-lished or not. The documents may come from
teaching and research institutions in France or
abroad, or from public or private research centers.
L’archive ouverte pluridisciplinaire HAL, est
destinée au dépôt et à la diffusion de documents
scientifiques de niveau recherche, publiés ou non,
émanant des établissements d’enseignement et de
recherche français ou étrangers, des laboratoires
publics ou privés.
Abdominal adipose tissue components quantification in
MRI as a relevant biomarker of metabolic profile
Khaoula Bouazizi, Mohamed Zarai, Thomas Dietenbeck, Judith
Aron-Wisnewsky, Karine Clément, Alban Redheuil, Nadjia Kachenoura
To cite this version:
Khaoula Bouazizi, Mohamed Zarai, Thomas Dietenbeck, Judith Aron-Wisnewsky, Karine Clément, et
al.. Abdominal adipose tissue components quantification in MRI as a relevant biomarker of metabolic
profile. Magnetic Resonance Imaging, Elsevier, 2021, 80, pp.14 - 20. �10.1016/j.mri.2021.04.002�.
�hal-03259659�
Magnetic Resonance Imaging 80 (2021) 14–20
Available online 17 April 2021
0730-725X/© 2021 The Authors. Published by Elsevier Inc. This is an open access article under the CC BY-NC-ND license (http://creativecommons.org/licenses/by-nc-nd/4.0/).
Abdominal adipose tissue components quantification in MRI as a relevant
biomarker of metabolic profile
Khaoula Bouazizi
a,b,*, Mohamed Zarai
a, Thomas Dietenbeck
a,b, Judith Aron-Wisnewsky
a,c,
Karine Cl´ement
c, Alban Redheuil
a,b,d, Nadjia Kachenoura
a,baInstitute of Cardiometabolism And Nutrition (ICAN), La Piti´e-Salpˆetri`ere Hospital, Paris, France bSorbonne University, INSERM 1146, CNRS 7371, Laboratoire d’Imagerie Biom´edicale, Paris, France
cSorbonne Universit´e, INSERM, Nutrition and Obesities; approches syst´emiques (NutriOmique), Piti´e-Salpˆetri`ere Hospital, Nutrition Department, Paris, France dUnit´e d’Imagerie Cardiovasculaire et Thoracique (ICT), Piti´e-Salpˆetri`ere Hospital, Paris, France
A R T I C L E I N F O Keywords:
Abdominal adipose tissue Subcutaneous adipose tissue Visceral adipose tissue Magnetic resonance imaging Segmentation
Cardiometabolic diseases
A B S T R A C T
Introduction: Abnormal accumulation of adipose tissue (AT) alters the metabolic profile and underlies
cardio-vascular complications. Conventional measures provide global measurements for the entire body. The purpose of this study was to propose a new approach to quantify the amount and type of truncal AT automatically from MRI in metabolic patients and controls.
Materials and methods: DIXON acquisitions were performed at 1.5 T in 30 metabolic syndrome (MS) (59 ± 6
years), 12 obese (50 ± 11 years), 35 type 2 diabetes (T2DM) patients (56 ± 11 years) and 19 controls (52 ± 11 years). AT was segmented into: subcutaneous AT “SAT”, visceral AT “VAT”, deep VAT “dVAT”, peri-organ VAT “pVAT” using active contours and k-means clustering algorithms. Subsequently, organ AT infiltration index “oVAT” was calculated as the normalized fat signal magnitude in organs.
Results: Excellent intra- and inter-operator reproducibility was obtained for AT segmentation. MS and obese
patients had the highest amount of total AT. SAT increased in MS (1144 ± 621 g) and T2DM patients (1024 ± 634 g), and twice the level of SAT in controls (505 ± 238 g), and further increased in obese patients (1429 ± 621 g). While VAT, pVAT and dVAT increased to a similar degree in the metabolic patients compared to controls, the oVAT index was able to differentiate controls from MS and T2DM patients and to discriminate the three metabolic patient groups (p < 0.01). Local AT sub-types were not related to BMI in all groups except for SAT in controls (p = 0.03).
Conclusion: Reproducible truncal AT sub-types quantification using 3D MRI was able to characterize patients with
metabolic diseases. It may serve in the future as a non-invasive predictor of cardiovascular complications in such patients.
1. Introduction
Excessive accumulation or abnormal distribution of subcutaneous (SAT) and/or visceral adipose tissue (VAT) is responsible for altered metabolic profiles and are associated with cardiovascular complications
(1,2). Although adipose tissue (AT) can primarily act as storage for
excess energetic substrate, its function is far more complex. Indeed, AT is an active endocrine organ which plays a key role in a number of chronic
conditions (3).
Cardio-metabolic diseases (CMD) including cardiovascular (CVD) and metabolic diseases - such as the metabolic syndrome (MS), type 2
diabetes mellitus (T2DM) and obesity - are a major cause of morbi-
mortality associated with considerable socio-economic impact (4).
These diseases progress in consecutive stages, aggravated by acute events ultimately leading to chronic CVD and possibly to heart failure in some patients.
While body mass index (BMI) is well correlated to total adiposity, its diagnostic and prognostic value are limited since they provide only a global and rough average of adipose mass and do not discriminate or characterize local fat composition and distribution throughout the body
(5). Moreover, BMI does not adequately reflect the complex distribution
of AT around and within organs. Indeed, studies have demonstrated that
* Corresponding author at: 47-83 boulevard de l’Hˆopital, 75013 Paris, France.
E-mail address: [email protected] (K. Bouazizi).
Contents lists available at ScienceDirect
Magnetic Resonance Imaging
journal homepage: www.elsevier.com/locate/mri
https://doi.org/10.1016/j.mri.2021.04.002
Magnetic Resonance Imaging 80 (2021) 14–20
15
patients with similar BMI may have substantially different metabolic
profiles or cardiovascular risk (6).
Based on the strong connection between AT subtypes and the pres-ence and nature of CMD, non-invasive, in vivo quantification of AT could have the potential to characterize the risk of CMD. Computed tomog-raphy (CT) has proven useful in quantifying AT but this imaging mo-dality is associated with radiation exposure. Technological evolutions mitigate and reduce radiation dose, but risk remains, particularly for longitudinal studies requiring multiple scans.
Magnetic resonance imaging (MRI) has emerged as a non-invasive and effective imaging modality for identifying whole body fat
including ectopic fat depots (7). Specifically, Dixon sequences, by
creating a registered set of in-phase (IP) and out-of-phase (OP) images, can characterize and visualize AT by producing fat-only and water-only
images (8).
In this study, a custom algorithm for AT subtypes segmentation into
SAT and fine VAT subtypes, that are different in terms of physiology (9),
anatomical location and venous drainage, from abdominal Dixon MRI was designed and applied to patients with a priori varied degrees of cardiometabolic risk. Our aims were 1. to assess whether different AT compartments could be reliably identified from Dixon MRI and 2. to study their ability to differentiate patients with different metabolic disease profiles (metabolic syndrome, obesity, T2DM), as compared to healthy subjects.
2. Materials and methods
2.1. Study population
We studied 96 individuals (58 women, 38 men, age 56 ± 4 years), a sample from the Metagenomics in Cardiometabolic Diseases Study
(MetaCardis http://metacardis.net/) sponsored by the 7th Framework
Programme of the European Commission (https://cordis.europa.eu/
project/id/305312), who had abdominal MRI. Participants were strati-fied into four groups: healthy subjects (n = 19, 52 ± 11 years, 7 females,
BMI = 24 ± 4 kg/m2) with no overt cardiovascular diseases, patients
with metabolic syndrome defined with the International Diabetes Federation criteria (n = 30, 59 ± 6 years, 21 females, BMI = 31 ± 6 kg/
m2), obese (n = 12, 50 ± 11 years, 10 females, BMI = 36 ± 6 kg/m2) and
T2DM patients (n = 35, 56 ± 11 years, 20 females, BMI = 30 ± 5 kg/m2).
The aim of this classification was to cover a wide range of metabolic diseases. All subjects provided informed consent and the study protocol was approved by the local Internal Review Board. Inclusion criteria are
provided online (https://clinicaltrials.gov/ct2/show/NCT02059538).
To avoid overlapping with the other groups (in particular type-2 dia-betes mellitus patients), only patients with normal glucose tolerance (NGT), impaired glucose tolerance (IGT) and/or impaired fasting glucose (IFG) and an glycohemoglobin HbA1c < 6.5% were included in the metabolic syndrome group. Subjects who had contraindications to MRI examination were excluded from the study.
2.2. MRI acquisitions
MRI data were obtained from a 1.5 T MRI scanner (Aera, Siemens, Erlangen, Germany). Approximately 52 axial slices with 4 mm thickness were acquired for each subject during a breath-hold using a 3D two- point Dixon-VIBE (volumetric interpolated breath-hold examination), which was performed after anatomical localization over the abdomen. The number of slices was adjusted based on patient size. Typical imaging parameters were: TR = 6.96 ms, TE1 = 2.39 ms, TE2 = 4.76 ms, flip
angle = 10◦, pixel spacing = 1.25 mm2, inter-slice gap = 0 mm,
band-width = 475 Hz/pixel, acquisition time = 1.7 min, FOV varied depending on body size. Four image sets were obtained: an in-phase image, an out-of-phase image, a fat-reconstruction image, and a water- reconstruction image.
2.3. Abdominal fat segmentation
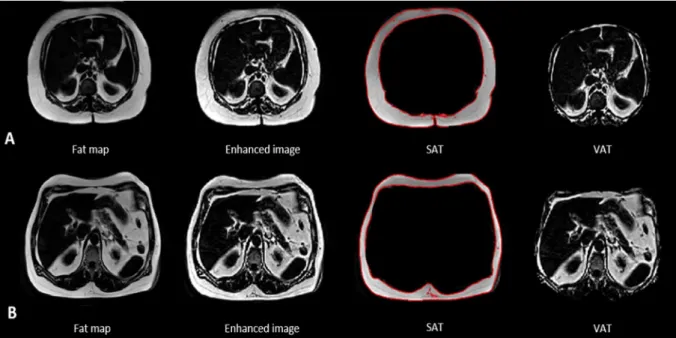
The segmentation of DIXON fat maps into different fat compartments was carried out using a home-developed software (Matlab, The
Math-Works, USA). Three steps were (Fig. 1): first, to enhance the contrast
within images, intensity values were adjusted in order to saturate the lower and higher gray scale levels. To facilitate the segmentation of the different components, a combination of top-hat and bottom-hat filters was used with a circular structuring element of radius 3 to correct in-tensity inhomogeneity and enhance the contrast within a slice.
In a second step, fat map was split into different objects of interest. A total AT (TAT) mask was defined as the connected object, while considering an 8-connectivity, with the highest area. This allowed the elimination of the non-interest areas such as arms, which might be included in the imaging field of view.
Then, an active FTC (Fast Two-Cycle) contour (10) initialized
auto-matically with two seeding points (at the TAT top and bottom extrem-ities) was applied to obtain the SAT region. At each iteration, the algorithm tried to find a better positioning of the contour (the constraint imposed is a double cycle of smoothing and regularization at each iteration). The iterative process stopped when it was no longer possible to improve the contour positioning or when the maximum number of iterations was reached (500 iterations in our case, sigma = 1). The SAT map was subtracted from the TAT map resulting in the total visceral adipose tissue (VAT) map.
Finally, the VAT map was clustered into three classes using the k- means algorithm in order to isolate VAT inside the organs (orgVAT) from peri-organ VAT (pVAT) and deep VAT (dVAT). Intensity magnitude within the orgVAT map were summed and normalized over the abdomen (orgVAT pixels intensity sum was normalized over the TAT pixels intensity sum), resulting in an orgVAT index (a.u.), which reflects the AT infiltration inside organs.
Once this process was performed on a central 2D slice, it was auto-matically propagated top and down to the neighboring slices to obtain a 3D volume without further need of seeding point definition.
The quantities of SAT, VAT, dVAT, and pVAT were given in grams
after multiplying the segmented areas (cm2) by the slice thickness (cm)
and by the average fat density (0.9 g/cm3) (11). SAT and VAT
per-centages over the total AT were also provided.
Image analysis was carried out on the full stack of slices in the abdominal region (L1 to L5) when available and quantities of AT were summed over vertebral levels. Of note, the numbers of slices in vertebral levels were variable between individuals, as they depend on the body size.
2.4. Statistical analysis
MRI AT data are presented as fat mass values in grams. Error bars on all figures represent standard deviations about the mean values. For comparisons of means between groups, one-way ANOVA (with Bonfer-roni correction) was performed. Such comparisons were further adjusted for age and sex to account for the differences in age and the unbalanced sex ratio between the four groups. Correlation coefficients from linear regression between continuous variables were provided. Coefficient of variation (CV) and Bland-Altman statistics including mean bias as well as 95% confidence intervals (mean bias ±1.96 standard deviation) were used to assess intra and inter-operator reproducibility of the fat seg-mentation repeated by two independent operators on a significant subset including both healthy subjects and patients (n = 82, age = 56 ± 4 years, 55 females). The Dice coefficient was computed between the automated segmentation and a manual segmentation performed by a senior radiologist (15 years experience), for both SAT and VAT in 25 participants. The statistical significance was set to p < 0.05 for all tests. Statistical analysis was performed using PRISM 6 (GraphPad Software Inc., Canada).
3. Results
Patient’s characteristics are summarized in Table 1.
Processing time on a standard computer (3.5 GHz CPU, 8 GB RAM) was around 1.2 s per slice. Only 3 out of 96 image datasets (3%) were unusable for the full analysis due to MRI swap-phase artifacts. For a single subject, the very thin SAT layer segmentation was adjusted manually.
3.1. Reproducibility
AT segmentation was highly reproducible as revealed by the low Bland-Altman AT mass bias (<1 g) and narrow limits of agreement as well as low coefficient of variation (CV < 2%) for both SAT, VAT, and
VAT components (Table 2). The Dice coefficients for the comparison
against manual segmentation were both equal to 0.97 ± 0.02 for SAT and VAT segmentation.
3.2. Distribution of AT subtypes among patients and controls
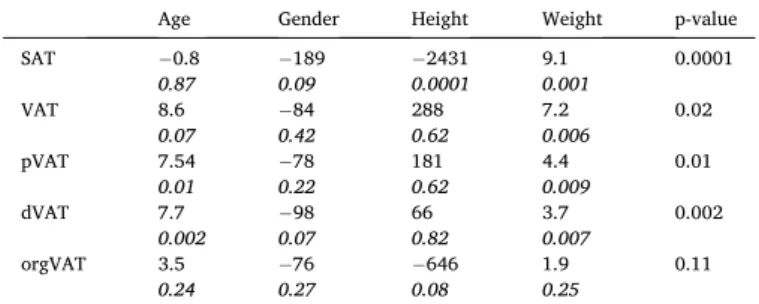
To study the effect of age, gender, height and weight on AT subtypes
distribution, linear regression analysis was performed (Table 3). The
global model was significant for all AT subtypes (p < 0.02) expect for orgVAT (p = 0.11). Age was independently related to pVAT (p = 0.01) and dVAT (p = 0.002), height was independently related to SAT amount (p = 0.0001), weight was independently associated to all AT subtypes (p Fig. 1. Example of the proposed automated segmentation process applied to the Dixon fat map of a T2DM patient (Male, BMI = 26 kg/m2).
FTC: Fast Two-Cycle, AT: Adipose Tissue, SAT: Subcutaneous AT, VAT: Visceral AT, dVAT: deep VAT, pVAT: peri-organ VAT, orgVAT: organ VAT region.
Table 1
Baseline characteristics of the study population.
MS Obese T2DM Controls p-value Male/Female, n/n 9 / 21 2 / 10 14 / 21 12 / 7 0.01 Age (years) 59 ± 6 50 ± 11 56 ± 11 52 ± 11 0.11 BMI (kg/m2) 31 ± 6 36 ± 6 30 ± 5 24 ± 4 <0.0001 BSA (m2) 1.98 ± 0.23 2.07 ±0.27 1.95 ±0.2 1.78 ±0.14 0.0005 Hypertension, n (%) 15 (50%) 1 (8%) 15 (43%) 0 (0%) <0.0001 Smoking, n (%) 3 (10%) 0 (0%) 2 (5%) 0 (0%) 0.16 Brachial SBP (mmHg) 140 ± 33 137 ± 21 128 ±15 131 ± 14 0.12 Brachial DBP (mmHg) 86 ± 11 86 ± 8 84 ± 12 77 ± 8 0.07
MS: Metabolic Syndrome, T2DM: Type 2 Diabetes Mellitus, SBP/DBP: Systolic/ Diastolic blood pressure. BSA: Body Surface Area.
Table 2
Intra and inter-operator reproducibility analysis of SAT and VAT components in metabolic (obese, MS and T2DM patients) and controls.
Intra-operator reproducibility (CV%) Bias [limits of agreement], g
Inter-operator reproducibility (CV%) Bias [limits of agreement], g Metabolic patients SAT 0.19 0.08 [− 0.7 0.95] 1.67 0.25 [− 1.77 1.27] VAT 0.12 0.01 [− 0.67 0.69] 0.44 0.37 [− 1.48 2.24] pVAT 0.87 0.05 [− 1.48 1.59] 1.75 0.26 [− 2.94 3.46] dVAT 1.76 0.06 [− 1.42 1.55] 1.93 0.17 [− 1.8 2.2] orgVAT 0.43 0.18 [− 1.44 1.8] 1.14 0.16 [− 3 4.2] Controls SAT 0.62 0.04 [− 3.29 3.37] 1.24 −0.97 [− 2.97 2.23] VAT 0.43 − 0.23 [− 1.35 1.81] 0.53 −0.1 [− 2.47 2.47] pVAT 1.18 − 0.11 [− 1.6 1.4] 0.41 −0.01 [− 0.15 0.12] dVAT 0.72 0.11 [− 0.85 1.09] 0.59 0.01 [− 0.13 0.15] orgVAT 0.11 0.07 [− 0.59 0.75] 1.7 0.1 [− 1.4 1.6]
Magnetic Resonance Imaging 80 (2021) 14–20
17
>0.009) except orgVAT (p = 0.25) and gender was not an independent
associate of any AT subtype.
Since the most pronounced differences between metabolic patients and controls were observed at the level of L3-L4 (p < 0.05), only results from L3-L4 are presented. Results from other levels (L1, L2 and L5) are presented in the Supplementary materials (Table 1 supp.).
Fig. 2 shows the normalized distribution in percentage of different abdominal AT components in all groups. As expected, obese patients have the most important relative amount of SAT. Of note, controls have the most important residuals which correspond mostly to null pixels (water only) inside the abdomen. MS and T2DM patients have similar residuals amounts.
Total AT and AT subtypes masses are summarized in Fig. 3 and
Table 4 over the studied groups. The significant differences between groups in terms of AT subtypes remained significant after adjustment for confounding factors such as age and sex, except for dVAT. Obese and MS patients had the highest amount of TAT (2297 ± 952 g and 2336 ± 911 g respectively) compared to T2DM patients (2109 ± 1011 g) as well as
healthy controls (1086 ± 337 g) (Fig. 3). Significant differences in term
of TAT were only observed between controls and metabolic groups. While SAT was higher to a similar degree in MS (1144 ± 621 g) and T2DM (1024 ± 634 g) patients, as compared to controls (505 ± 238 g), it was significantly higher in obese patients compared to all other groups
(1429 ± 621 g) (Fig. 3).
VAT was higher in MS patients (1192 ± 497 g) and T2DM patients (1085 ± 519 g) as compared to obese patients (868 ± 376 g) and healthy controls (580 ± 256 g).
Concerning VAT subgroups, pVAT and dVAT were higher in the three patient groups to a similar degree compared to healthy controls. orgVAT index was significantly higher to a similar degree in patients with MS and T2DM as compared to controls. orgVAT index in obese patients was
lower than in MS and T2DM patients (Fig. 3).
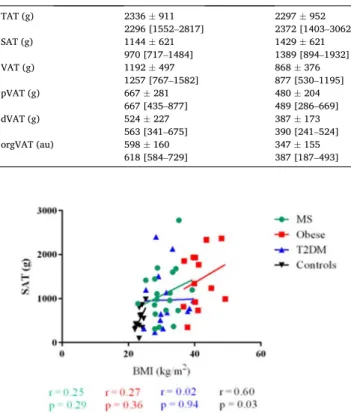
3.3. Relationships between AT components and BMI
BMI was correlated only to the SAT amount in the control group (p = 0.03) (Fig. 4).
To further highlight the weak associations between AT amounts and
BMI, Fig. 5 shows examples of fat maps of two female patients with a
similar BMI but an inverse distribution of SAT and VAT. Indeed, the MS patient with high SAT amount had low VAT amount, and inversely for the T2DM patient.
4. Discussion
The current study presented a reproducible technique for 3D semi- automated AT segmentation from Dixon MRI data, which was able to characterize the distribution and quantify amount of AT subtypes in patients with varying cardio-metabolic diseases, as compared to healthy controls. Such reproducible classification and quantification of trun-cular AT compartments is crucial for metabolic studies since they serve as good indicators of metabolic and associated cardiovascular risks.
CT imaging was previously used to evaluate abdominal AT. Pescatori
et al. (12) assessed total AT in 31 patients with a wide spectrum of
diseases with no differentiation between SAT and VAT compartments. The wide range of SAT and VAT quantitative values reported in the CT
literature (13,14,15) might be explained by the fact that quantification
was performed at various anatomical localization and in various disease settings using different segmentation algorithms. Such algorithms comprised either manual segmentation of a single slice using ImageJ
(13) or Osirix (14) as well as quantitative thresholding technique on a
stack of three slices (15).
MRI was proposed as a non-radiating technique to quantify AT compartments using 2D segmentation techniques. Among such MRI
studies, Schwenzer et al. (16) presented AT quantitative assessment
obtained from a single slice. Such single slice analysis was shown to be hampered by VAT variations due to bowel movement or variable filling
of the intestine (17,18,19). Furthermore, MRI studies focused on
different disease conditions and different age ranges. Indeed, authors
analyzed AT in children and adolescents (20), in obese adolescents (21),
in diabetic patients with other metabolic alterations (22), and in a mixed
group of healthy to obese class III patients (23).
In the current study, AT subtypes were quantified in over the abdominal volume revealing significant differences between controls and metabolic patients in terms of total AT and AT subtypes. When considering local measurements so as to compared with previously re-ported data, these differences between groups in terms of VAT were more pronounced at the level of L3 in agreement with Demerath et al.
(18) and Tong et al. (24) findings.
A direct comparison between our results and the literature is difficult because of differences in the targeted patients’ populations in terms of diseases and body habitus as well as of technical differences in terms of anatomical sites of measurements, processing techniques and acquisi-tion settings. Despite such differences, our results in terms of SAT at the
level of L4-L5 (Supplementary materials: Table 2 supp) in healthy
vol-unteers are in the same range than those reported in the literature (25).
The higher subjects’ BMI in the latter study corresponding to slightly
overweight individuals (BMI = 26.3 ± 2.99 kg/m2) compared to our
healthy controls (BMI = 23 ± 1 kg/m2) might explain the slight
differ-ence of mean SAT values. SAT and VAT amounts computed from obese
patients (entire abdomen) in our study were smaller (Table 2 supp in
Supplementary material) than those reporter by Th¨ormer et al. (26).
This might be explained by the fact that BMI (mean: 44 kg/m2 vs. 39 kg/
m2 in our population) and slice thickness (8 mm vs. 4 mm in our study)
were higher in their study than in ours. This also may be explained that obese patients in our study are metabolically healthier. Indeed, Cirulli
et al. (27) reported that obese patients may have a metabolic BMI which
Table 3
Multivariate analysis of associations between AT subtypes, age, gender, height and weight. P-value of the global model (p-value column) was given along with individual variables β coefficients and p values.
Age Gender Height Weight p-value SAT −0.8 0.87 − 189 0.09 −2431 0.0001 9.1 0.001 0.0001 VAT 8.6 0.07 − 84 0.42 288 0.62 7.2 0.006 0.02 pVAT 7.54 0.01 −0.22 78 181 0.62 4.4 0.009 0.01 dVAT 7.7 0.002 − 98 0.07 66 0.82 3.7 0.007 0.002 orgVAT 3.5 0.24 − 76 0.27 −646 0.08 1.9 0.25 0.11
Fig. 2. Distribution of SAT and VAT in all groups at the level of L3-L4.
Re-siduals represent percentage of null pixels in the considered abdominal region and orgVAT infiltrated pixels.
may be higher or lower than the actual BMI.
Tong et al. (24) reported that the best level to quantify SAT in normal
subjects in a single slice approach was at the level of T12-L1 area. In the current study, significant differences between metabolic patients and
controls were observed at all levels (Fig. 1 supp) and globally.
Few studies focused on pVAT and orgVAT amounts although these subtypes were considered as underestimated predictors of cardiovas-cular risks (28,29).
pVAT or Visceral White Adipose Tissue (VWAT) is located around the internal organs providing protective padding. It is the main type of
ectopic adipose tissue used for energy storage (30). pVAT is stored inside
the peritoneum, surrounding liver, kidneys (31), heart, stomach,
intes-tine, and other internal organs (32). For example, it has been shown that
perirenal AT (one of the pVAT location) is associated with metabolic risk factors (33).
VAT may infiltrate organs such as liver and be defined as steatosis
(34), kidney (33,35). Indeed, renal sinus fat is associated with an
Fig. 3. Graph bars of total adipose tissue and its components at the level of L3-L4 over the groups. Error bars represent mean ± SD. *: p ≤ 0.05, **: p ≤ 0.01, ***: p ≤
0.001, ****: p ≤ 0.0001.
Table 4
Total adipose tissue and its components in all groups at the level of L3-L4 presented as mean ± SD as well as median and [interquartile range]. au: arbitrary unit. + stands for age and sex adjusted p-value.
MS Obese T2DM Controls p-value+
TAT (g) 2336 ± 911 2296 [1552–2817] 2297 ± 952 2372 [1403–3062] 2109 ± 1011 1963 [1157–2712] 1086 ± 337 1054 [912–1385] <0.0001 SAT (g) 1144 ± 621 970 [717–1484] 1429 ± 621 1389 [894–1932] 1024 ± 634 864 [545–1456] 505 ± 238 449 [335–622] 0.002 VAT (g) 1192 ± 497 1257 [767–1582] 868 ± 376 877 [530–1195] 1085 ± 519 1111 [604–1346] 580 ± 256 525 [391–773] 0.01 pVAT (g) 667 ± 281 667 [435–877] 480 ± 204 489 [286–669] 546 ± 310 546 [266–704] 347 ± 137 322 [244–448] 0.007 dVAT (g) 524 ± 227 563 [341–675] 387 ± 173 390 [241–524] 468 ± 228 481 [240–584] 233 ± 124 204 [147–283] 0.001 orgVAT (au) 598 ± 160 618 [584–729] 347 ± 155 387 [187–493] 610 ± 296 521 [344–905] 221 ± 56 237 [190–265] 0.0001
Fig. 4. Associations between SAT and BMI in all studied groups at the level of
Magnetic Resonance Imaging 80 (2021) 14–20
19
increased risk of hypertension, chronic kidney disease and other meta-bolic traits. Pancreatic adipose tissue infiltration has been investigated in several studies (36,37).
In our study, significant differences between groups were observed in terms of orgVAT index. Ectopic VAT components are associated with many non-communicable diseases as they can actively secrete cytokines
with systemic effects (28). Thus, AT sub-quantification is important in
large CMD studies in order to discriminate patients groups. We found MS and T2DM patients to have similar AT distribution profiles especially when considering orgVAT index which we describe in this study and which seems to have the highest discriminatory power to potentially identify patients with the highest metabolic risk. In particular, total VAT, SAT or TAT could not discriminate specifically between MS, T2DM and obesity groups. In particular, this quantitative and AT subtype specific MRI approach may help in understanding the “obesity-paradox”
(38) and allow for early phenotyping of obese patients at
car-diometabolic risk with subsequent tailored management to reduce adverse outcome and to predict disease evolution.
BMI, considered as an anthropometric measure of adiposity, did not correlate well with AT subtypes in our CMD patients in line with the fact that such global metric cannot predict the proportion of SAT and VAT in the abdominal compartment. This is also consistent with the knowledge that individual risk to suffer from common metabolic diseases such as diabetes depends on the local distribution of AT in the body rather than
global weight-to-height indices (39). Future work should focus on
integrating this AT discrimination in building models for other traits of metabolic health in addition to other cardiometabolic disease markers. Despite the advantages of our rapid and reproducible segmentation, our study has some limitations. This includes the relatively limited size of obese population and the slightly unbalanced gender distribution across groups. Second, manual adjustment of the segmentation is rec-ommended in cases when the SAT layer is extremely thin (one healthy subject). Third, MRI cannot allow the evaluation of other AT alterations such as adipocytes hypertrophy, macrophage infiltration which are of utmost relevance when characterizing cardiometabolic risks.
5. Conclusion
In this study, 2D and 3D adipose tissue subtype quantification was performed in MRI using a reproducible segmentation tool to
discriminate metabolic patients from controls. Due to the increasing evidence of the connection between AT subtype distribution and car-diometabolic and vascular risk, further categorizing fat depots to iden-tify AT profiles at risk has become more relevant for use as an endpoint in broader longitudinal studies of CMD. Indeed, a DIXON-based quan-tification such as described here could be included to routine MRI pro-tocols as it may provide new imaging biomarkers to predict risk profiles in patients with metabolic diseases. This should generate data to even-tually tailor cardiometabolic prevention to individual risk.
Sources of funding
This project was supported by the EU-FP7 MetaCardis (http://www.
metacardis.net/). MRI acquisitions were funded by the Institute of
Cardiometabolism and Nutrition (ICAN) (https://www.ican-institute.
org/).
References
[1] Cornier M, Despre J, Lopez-Jimenez F, et al. A Scientific Statement From the American Heart Association124; 2011. p. 1996–2019.
[2] Van Gaal L, Mertens I, De Block C. Mechanisms linking obesity with cardiovascular disease. Nature 2006;14:875–80.
[3] Lee M-J, Wu Y, Fried S. Adipose tissue heterogeneity: implication of depot differences in adipose tissue for obesity complications. Mol Aspects Med 2013;34: 1–11.
[4] Di Angelantonio E, Kaptoge S, Wormser D, et al. Association of cardiometabolic multimorbidity with mortality. JAMA 2015;314:52–60.
[5] Bergman RN, Stefanovski D, Buchanan TA, et al. A better index of body adiposity. Obesity 2011;19:1083–9.
[6] Britton KA, Fox CS. Ectopic fat depots and cardiovascular disease. Circulation 2011;124:837–41.
[7] Thomas E, Fitzpatrick JA, Malik SJ, Taylor-Robinson S, Bell JD. Progress in nuclear magnetic resonance spectroscopy whole body fat: content and distribution. Prog Nucl Magn Reson Spectrosc 2013;73:56–80.
[8] Dixon W. Simple proton spectroscopic imaging. Radiology 1984;153:189–94. [9] Neeland I, Poirier P, Despr´es J-P. The cardiovascular and metabolic heterogeneity
of obesity: clinical challenges and implications for management. Circulation 2018; 137:1391–406.
[10] Shi Y, Karl WC. A real-time algorithm for the approximation of level-set-based curve evolution. IEEE Trans Image Process. 2008;17:645–56.
[11] Sironi AM, Petz R, De Marchi D, et al. Complications impact of increased visceral and cardiac fat on cardiometabolic risk and disease. Diabet Med 2012;29:622–7. [12] Pescatori LC, Savarino E, Mauri G, et al. Quantification of visceral adipose tissue by
computed tomography and magnetic resonance imaging: reproducibility and accuracy. Radiol Bras 2019;52:1–6.
Fig. 5. Fat maps segmentation for a female patient with MS (A) with BMI = 33 kg/m2, SAT = 31% (102 g) and VAT = 50% (56 g) and a female patient with T2DM
(B) with BMI = 33 kg/m2, SAT = 19.5% (84 g) and VAT = 60.3% (123 g).
[13] Eastwood SV, Tillin T, Wright A, et al. Estimation of CT-derived abdominal visceral and subcutaneous adipose tissue depots from anthropometry in Europeans, South Asians and African Caribbeans. PLoS One 2013;8:1–12.
[14] Ni Laoire AM, Delaney OM, Mcwilliams SR, et al. Computed tomographic measurement of abdominal visceral adipose tissue in Crohn’ s disease: not a useful marker of disease characteristics. ECR 2010:1–20.
[15] Kullberg J, Hedstr¨om A, Brandberg J, Strand R, Johansson L. Automated analysis of liver fat, muscle and adipose tissue distribution from CT suitable for large-scale studies. Nature. Sci Reports 2017;7:1–11.
[16] Schwenzer NF, Machann J, Schraml C, et al. Quantitative analysis of adipose tissue in single transverse slices for estimation of volumes of relevant fat tissue compartments. Invest Radiol 2010;45:788–94.
[17] Ng AC, Wai DC, Tai ES, Ng KM, Chan LL. Visceral adipose tissue, but not waist circumference is a better measure of metabolic risk in Singaporean Chinese and Indian men. Nutr Diabetes 2012;2:e38.
[18] Demerath EW, Shen W, Lee M, Choh AC, Czerwinski SA, Roger M. Approximation of total visceral adipose tissue with a single magnetic resonance image. Am J Clin Nutr 2007;85:362–8.
[19] Ellis KJ, Grund B, Visnegarwala F, et al. Visceral and subcutaneous adiposity measurements in adults: influence of measurement site. Obesity 2007;15:1441–7. [20] Di Martino M, Pacifico L, Bezzi M, et al. Comparison of magnetic resonance
spectroscopy, proton density fat fraction and histological analysis in the quantification of liver steatosis in children and adolescents. World J Gastroenterol 2016;22:8812–9.
[21] Hui SCN, Zhang T, Shi L, Wang D, Ip CB, Chu WCW. Automated segmentation of abdominal subcutaneous adipose tissue and visceral adipose tissue in obese adolescent in MRI. Magn Reson Imaging 2018;45:97–104.
[22] Illouz F, Roulier V, Rod A, et al. Distribution of adipose tissue: quantification and relationship with hepatic steatosis and vascular profiles of type 2 diabetic patients with metabolic syndrome. Diabetes Metab 2008;34:68–74.
[23] Sun J, Xu B, Freeland-Graves J. Automated quantification of abdominal adiposity by magnetic resonance imaging. Am J Hum Biol 2016;28:757–66.
[24] Tong Y, Udupa JK, Torigian DA. Optimization of abdominal fat quantification on CT imaging through use of standardized anatomic space: a novel approach. Med Phys 2014;41:1–11.
[25] Kullberg J, Ahlstr¨om H, Johansson L, Frimmel H. Automated and reproducible segmentation of visceral and subcutaneous adipose tissue from abdominal MRI. Int J Obes (Lond) 2007;31:1806–17.
[26] Th¨ormer G, Bertram HH, Garnov N, et al. Software for automated MRI-based quantification of abdominal fat and preliminary evaluation in morbidly obese patients. J Magn Reson Imaging 2013;37:1144–50.
[27] Cirulli ET, Guo L, Leon Swisher C, et al. Profound perturbation of the metabolome in obesity is associated with health risk. Cell Metab 2019;29:488–500. [28] Katsiki N, Athyros VG, Mikhailidis DP. Abnormal peri-organ or intra-organ fat
(APIFat) deposition: an underestimated predictor of vascular risk? Curr Vasc Pharmacol 2016;14:432–41.
[29] Katsiki N, Mikhailidis DP. Abnormal peri-organ or intra-organ fat deposition and vascular risk. Angiology 2018;69:841–2.
[30] Esteve R`afols M. Adipose tissue: cell heterogeneity and functional diversity. Endocrinol Nutr 2014;61:100–12.
[31] Roever L, Resende ES, Veloso FC, et al. Perirenal fat and association with metabolic risk factors. Medicine (Baltimore) 2015;94:1–5.
[32] Luong Q, Lee K. The heterogeneity of white adipose tissue. In: Szablewski L, editor. Adipose Tissue; 2018.
[33] Krievina G, Tretjakovs P, Skuja I, et al. Ectopic adipose tissue storage in the left and the right renal sinus is asymmetric and associated with serum kidney injury molecule-1 and fibroblast growth factor-21 levels increase. EBIOM 2016;13: 274–83.
[34] Parker R. The role of adipose tissue in fatty liver diseases. Liver Res 2018;2:35–42. [35] Foster MC, Hwang S, Porter SA, et al. Fatty kidney, hypertension, and chronic
kidney disease. The Framingham heart study. Hypertension 2011;58:784–90. [36] Gerst F, Wagner R, Oquendo MB, Siegel-axel D. What role do fat cells play in
pancreatic tissue? Mol Metab 2019;25:1–10.
[37] Garcia B, Wu Y, Nordbeck E, et al. Pancreatic adipose tissue in diet-induced type 2 diabetes. Diabetes 2018;67:2431. PUB.
[38] Hainer V, Aldhoon-Hainerov´a I. Obesity paradox does exist. Diabetes Care 2013; 36:S276–81.
[39] Burhans MS, Hagman DK, Kuzma JN, Schmidt KA, Kratz M. Contribution of adipose tissue inflammation to the development of type 2 diabetes mellitus. Compr Physiol 2019;9:1–58.