Designing microbial consortia with defined social interactions
The MIT Faculty has made this article openly available. Please sharehow this access benefits you. Your story matters.
Citation Kong, Wentao et al. “Designing Microbial Consortia with Defined
Social Interactions.” Nature Chemical Biology 14, 8 (June 2018): 821–829
As Published https://doi.org/10.1038/s41589-018-0091-7
Publisher Nature Publishing Group
Version Author's final manuscript
Citable link http://hdl.handle.net/1721.1/119451
Terms of Use Creative Commons Attribution-Noncommercial-Share Alike
2
Wentao Kong1,2, David R. Meldgin2,3, James J. Collins5,6,7,*, and Ting Lu1,2,3,4,*
3 4
Department of Bioengineering1, Carl R. Woese Institute for Genomic Biology2,
5
Department of Physics3, Center for Biophysics and Quantitative Biology4, University of
6
Illinois at Urbana-Champaign, Urbana, IL 61801, USA. Institute for Medical Engineering
7
and Science, Department of Biological Engineering, and Synthetic Biology Center5,
8
Massachusetts Institute of Technology; Broad Institute of MIT and Harvard6, Cambridge,
9
MA 02142, USA; Wyss Institute for Biologically Inspired Engineering7, Harvard
10
University, Boston, MA 02115, USA
11 12
Correspondence and requests for materials should be addressed to T.L.
13
([email protected]) J.J.C. ([email protected]).
Abstract
15
Designer microbial consortia are an emerging frontier in synthetic biology that
16
enables versatile microbiome engineering. However, the utilization of such
17
consortia is hindered by our limited capacity in rapidly creating ecosystems with
18
desired dynamics. Here we present the development of synthetic communities
19
through social interaction engineering that combines modular pathway
20
reconfiguration with model creation. Specifically, we created six two-strain
21
consortia with each possessing a unique mode of interaction, including
22
commensalism, amensalism, neutralism, cooperation, competition and predation.
23
These consortia follow distinct population dynamics with characteristics
24
determined by the underlying interaction modes. We showed that models derived
25
from two-strain consortia can be used to design three- and four-strain
26
ecosystems with predictable behaviors, and further extended to provide insights
27
into community dynamics in space. This work sheds light on the organization of
28
interacting microbial species, and provides a systematic framework—social
29
interaction programming—to guide the development of synthetic ecosystems for
30
diverse purposes.
31 32 33
Designer microbial consortia are communities of rationally designed, interacting
35
microorganisms that are capable of producing desired behaviors1-4. In the past decade,
36
an array of such synthetic systems were developed, enabling different applications such
37
as generating specific ecological dynamics5-9, promoting species growth10,11 and
38
synthesizing valuable chemicals12,13. Compared to engineered isogenic populations,
39
synthetic communities offer an increased degree of robustness for designed cellular
40
functions and an expanded spectrum of functional programmability for complex tasks,
41
thereby enabling novel and versatile biotechnological applications in complex settings1.
42
Synthetic microbial consortia have also emerged as a promising engineering tool to
43
manipulate microbiomes, such as those in the human body and in the rhizosphere,
44
which helps to realize the enormous potential of microbiomes for therapeutic,
45
environmental, and agricultural purposes14-17. However, despite increasing exciting
46
proof-of-concept demonstrations, the utilization of such synthetic ecosystems is
47
hampered by our limited ability in rapidly developing microbial ecosystems with desired
48
temporal and spatial dynamics.
49 50
Cellular social interactions, such as competition and cooperation, are ubiquitous in
51
microbial communities and shown to be essential in specifying ecosystem dynamics18.
52
For instance, engineering cross feeding offers species co-existence10,19,20 while building
53
predator-prey interactions can lead to oscillatory, bistable or mono-stable behaviors6.
54
Inspired by these findings, here we present a systematic framework to the design,
55
construction and characterization of synthetic microbial communities, namely, social
interaction programming that combines modular pathway reconfiguration with model
57
creation. Specifically, we employed a modular pathway reconfiguration approach to
58
create six distinct consortia whose dynamics is specified by their underlying interaction
59
modes. Using a modular approach similar to our experimental construction, we also
60
derived quantitative models that captured experimentally observed population patterns.
61
We further showed that the models from two-strain consortia can be used to design and
62
build three- and four-strain ecosystems with predictable behaviors, and extended our
63
investigations to yield insights into spatial community dynamics. Together, we
64
established social interaction engineering as an effective and valuable route for
65 ecosystem programming. 66 67 Results 68
Modular pathway reconfiguration for programing social interactions
69
Synthetic gene circuits are typically constructed from the bottom up by assembling
70
individual DNA parts21-26; in principle, they can also be created through modular
71
reconfiguration of existing gene clusters (Fig. 1a). Although having been barely
72
practiced, modular cluster reconfiguration can be powerful for rapid circuit engineering
73
due to the increasing complexity of desired functionalities27 and the high modularity of
74
native gene networks28. Inspired by this concept, we harnessed the modular
75
biosynthesis pathways of nisin and lactococcin A (lcnA) in Lactococcus lactis (Fig. 1b)
76
to develop programmable cells that could form the basis for synthetic microbial
77
consortia. Of note, nisin, an antimicrobial and quorum-sensing molecule, is encoded by
78
an eleven-gene cluster involving five functional modules, including precursor production,
(Fig. 1c); and lcnA is an antimicrobial peptide whose underlying pathway consists of
81
precursor production, translocation and immunity modules30 (Fig. 1d).
82 83
The functional modularity of the pathways allowed us to rapidly generate different social
84
interactions by selecting and tuning the molecules’ signaling and bactericidal features
85
through the alteration of module combinations. Specifically, we were able to create six
86
synthetic microbial consortia that collectively enumerate all possible modes of pairwise
87
social interactions18,31-33 (Fig. 1e).
88 89
Engineering consortia with unidirectional interactions
90
We started by constructing a two-strain consortium of commensalism within which one
91
benefits the other. Using our previously developed synthetic biology platform34,35, we
92
generated one strain (CmA) by introducing into L. lactis (NZ9000) the full nisin pathway
93
and the constitutively expressed tetracycline resistance gene (tetR). We also created the 94
other (CmB) by transforming into NZ9000 a reconfigured version of the nisin pathway,
95
which contains only the signaling and immunity modules, and a nisin-inducible tetR 96
expression circuit (Fig. 2a and Supplementary Fig. 1). Here, CmA was designed to
97
secrete nisin to trigger the expression of tetR in CmB, thereby conferring tetracycline 98
resistance on CmB. Additionally, we inserted constitutively expressed fluorescent
99
protein genes, gfpuv and mCherry, into the strains for observation and analysis.
100 101
As anticipated, CmA grew by itself in the GM17 media containing tetracycline due to its
102
constitutive tetR expression; in contrast, CmB by itself did not grow, as its resistance is 103
not autonomous (Fig. 2b). However, CmA and CmB both grew when co-cultured (1:1
104
ratio) (Fig. 2b), suggesting that the presence of CmA conferred a growth benefit to CmB.
105
Such behaviors were also observed in a variant of the consortium where the tetR 106
expression of CmA is nisin-inducible (Supplementary Fig. 2a). Additional experiments
107
showed that CmB grew in the tetracycline-containing media when nisin is supplemented
108
(Supplementary Fig. 2b) but failed to grow when CmA’s nisin production is abolished
109
(Supplementary Fig. 2c). Furthermore, we showed that CmB growth was not due to
110
tetracycline degradation or absorption by CmA (Supplementary Fig. 3). Together, these
111
results confirmed that the mechanism of commensalism is the tetracycline resistance of
112
CmB induced by nisin released from CmA. Notably, as CmA and CmB were constructed
113
from the same parental strain (NZ9000), they had an indirect nutrient competition during
114
co-culture, and CmA had a reduced saturation density compared to the case of
115
monoculture.
116 117
We next engineered a consortium of amensalism, where one strain adversely affects
118
the other, by leveraging the bactericidal nature of nisin. Specifically, we created one
119
strain (AmA) by transplanting into NZ9000 the full nisin pathway and the other strain
120
(AmB) by simply introducing the vector pCCAMβ1 (Fig. 2d and Supplementary Fig. 1).
121
Again, fluorescence protein genes (gfpuv and mCherry) were introduced as reporters.
122
We found that, individually, AmA and AmB both grew up to saturation in GM17 media;
123
however, when co-cultured, only AmA was able to grow (Fig. 2e), demonstrating the
from AmA’s production of nisin that inhibits the growth of AmB. Utilizing the bactericidal
126
nature of lcnA, we also constructed another version of amensalism by loading the lcnA
127
pathway to NZ9000 to create a new toxin producer (AmA2) (Supplementary Figs. 4a
128
and 1). Subsequent culturing experiments (Supplementary Fig. 4b) confirmed that the
129
new ecosystem indeed involves one-way deleterious interaction.
130 131
We further constructed a two-strain consortium of neutralism, as a control to
132
commensalism and amensalism, by loading to NZ9000 the vector (pCCAMβ1) and
133
reporters (gfpuv and mCherry) (Fig. 2g and Supplementary Fig. 1). The two resulting
134
strains, NeA and NeB, were able to grow both individually and together (Fig. 2h),
135
confirming that their social interaction is indeed neutral. Notably, the reduction of each
136
strain’s saturation density in co-culture was due to indirect nutrient competition.
137 138
To quantitatively describe the observed behaviors, we constructed a mathematical
139
framework for two-strain community dynamics using ordinary differential equations
140
(Online Methods and Supplementary Note 1). The framework involves five variables,
141
including two for the strain populations, two for the interacting molecules produced by
142
the strains, and one for the nutrient in culture (Supplementary Eq. S1). In concert with
143
the modular configurability of the bacteriocin pathways for gene circuit development,
144
this modeling framework allows modular alterations to describe specific types of
145
ecosystems. Upon data fitting, four derived models (Supplementary Note 4)
146
successfully captured the population-dynamics characteristics of the consortia of
commensalism (Fig. 2c), amensalism (Fig. 2f and Supplementary Fig. 4c) and
148
neutralism (Fig. 2i).
149 150
Developing consortia with bidirectional interactions
151
Leveraging the modularity of the nisin and lcnA pathways, we next created consortia
152
involving two-way social interactions, namely cooperation, competition and predation.
153
Cooperation is the process where multiple species work together to accomplish a task
154
that yields mutual benefit. To create such a consortium, we designed the common task
155
as nisin production, a multi-step process including precursor production, translocation
156
and post-translational modification (Fig. 1c). The task was divided by assigning one
157
strain (CoA) to synthesize and secrete nisin precursor and the other (CoB) to convert
158
the precursor in the extracellular milieu into active nisin. Tetracycline resistance was
159
chosen as the benefit for completing the task. We developed these two strains by
160
modularly reconfiguring the nisin pathway and introducing nisin-inducible tetR and 161
reporter systems (Fig. 3a and Supplementary Fig. 1).
162 163
Our growth experiments showed that CoA and CoB did not grow in
tetracycline-164
supplemented GM17 media unless they were co-cultured (Fig. 3b). For comparison,
165
each of the strains was able to grow when the media was supplemented with nisin
166
(Supplementary Fig. 5a). Additionally, abolishing the function of either strain (e.g.,
167
precursor translocation by CoA and modification by CoB) resulted in no growth of either
168
strain (Supplementary Fig. 5b, c). These results demonstrated the necessity of
169
cooperation for the growth of the engineered strains.
Competition is an interaction between species in which the fitness of one is lowered by
172
the presence of another. We designed an ecosystem with such an interaction by
173
utilizing the antimicrobial features of nisin and lcnA. Experimentally, we generated two
174
competing strains, named CpA and CpB, by introducing the nisin and lcnA pathways
175
into NZ9000 separately (Fig. 3d and Supplementary Fig. 1). Notably, CpA and CpB are
176
essentially the same as AmA and AmA2 (the two versions of toxin producers for
177
amensalism), because competition is the superposition of two counter-oriented,
178
detrimental interactions. We found that CpA and CpB both followed a logistic growth
179
pattern individually but, when co-cultured, CpA grew with a significant time delay (12
180
hrs) and CpB failed to grow (Fig. 3e) indicating that the fitness of the both strains was
181
reduced with their mutual presence. In this case, CpA won the competition and
182
dominated the population. Notably, although CpB lost the contest, lcnA it released at the
183
beginning of the experiment caused the growth delay and reduction of CpA in co-culture.
184 185
It has been theoretically predicted that differential outcomes may arise in competition by
186
altering ecosystem parameters such as relative interaction strengths36. To test these
187
predictions, we generated multiple variants of CpA and CpB by tuning their bacteriocin
188
productivities, including CpA2 (a lowered translation initiation rate (TIR) of nisB), CpB2
189
(a wild-type TIR of lcnA) and CpB3 (an increased TIR of lcnA) (Supplementary Tables 1
190
and 2). Using different combinations of the variants, we indeed observed distinct
191
competition outcomes including CpB dominance (Supplementary Fig. 6a) and close
192
contests (Supplementary Fig. 6b, c).
194
Predation is a social interaction where one species (prey) benefits another (predator)
195
while being harmed. It is topologically equivalent to the combination of two unidirectional
196
interactions, commensalism and amensalism, with opposite orientations. In light of this
197
equivalence, we established a community of predation by assigning CmA of
198
commensalism, a nisin producer with constitutive tetracycline resistance, as prey (PrA)
199
and combining the circuits of CmB (nisin-inducible tetR) and AmA2 (constitutive lcnA 200
production) to form a predator (PrB) (Fig. 3g and Supplementary Fig. 1). In this design,
201
PrA provides the benefit of tetracycline resistance to PrB by secreting nisin, while PrB
202
hurts PrA through the release of lcnA.
203 204
When the resulting strains were co-cultured, PrA grew in the first 8 hours but gradually
205
declined to a steady density afterwards, while PrB grew poorly at the beginning but
206
faster later and eventually dominated the population, opposite to the monoculture where
207
PrA grew normally but PrB failed to grow (Fig. 3h). The results confirmed the presence
208
of the predatory relation between PrA and PrB, with the former serving as the prey and
209
the latter as the predator. A variant of the ecosystem with similar behaviors involves the
210
replacement of constitutive tetracycline resistance in PrA with nisin inducibility
211
(Supplementary Fig. 7a). In addition, we confirmed that, in this relationship, both the
212
beneficial and deleterious interactions are mandatory, through the monoculture
213
experiments with nisin supplementation (Supplementary Fig. 7b) and the co-culture
214
experiments where PrA or PrB was replaced by a neutral strain (Supplementary Fig. 7c,
215
d)
To achieve a quantitative understanding of the above two-way ecosystems, we
218
reconfigured our mathematical framework to create three ecosystem models
219
(Supplementary Note 1). Consistent with the experiments, these models were able to
220
generate distinct community dynamics for the cases of cooperation (Fig. 3c),
221
competition (Fig. 3f and Supplementary Fig. 6d-f) and predation (Fig. 3i). Together, the
222
mathematical modeling and experimental development of synthetic ecosystems
223
demonstrated that social interaction engineering is a versatile and effective way to
224
create desired two-strain microbial consortia.
225 226
Model-guided design of three- and four-strain ecosystems
227
To further illustrate the utility of our engineering method, we applied it to tackle a key
228
challenge in microbiome and synthetic ecosystem research, namely, to design complex
229
ecosystems with predictable dynamics. Specifically, we combined our established
230
experimental consortia with mathematical models to determine if the dynamics of
231
complex communities (e.g., three- and four-strain ecosystems) could be predicted from
232
the behaviors of simple two-strain ecosystems. Using the models extended modularly
233
from the two-strain cases (Supplementary Note 2), we first predicted the dynamic
234
behaviors of eight three-strain microbial ecosystems formed by introducing third strains
235
into the existing two-strain consortia. Importantly, in the process of model extension and
236
dynamics prediction, all of the parameters from the two-strain communities remained
237
fixed. The only new parameters were the growth rates of the newly introduced strains
238
(i.e., the third strains), which had not been previously characterized.
240
To test the model predictions, we experimentally constructed eight third strains (CoAg,
241
CoBg, CpAg, CpBg, CmAg, CmBg, AmAg, and AmBg) in alignment with our models
242
(Online Methods; Supplementary Table 1; Supplementary Note 2). These third strains
243
were derived from the corresponding parent strains in the two-strain consortia (CoA,
244
CoB, CpA, CpB, CmA, CmB, AmA, and AmB) by using a colorimetric reporter gene
245
(gusA) to substitute the fluorescence reporter genes (gfpuv or mCherry). Therefore, the
246
third strains have identical interaction modes as their ancestors, but different growth
247
rates due to the alteration of their reporter systems. For instance, CoAg has the same
248
cooperation features as CoA but a different growth.
249 250
After measuring the growth rates of the third strains, we mixed them with the two-strain
251
consortia to form the eight three-strain communities, and performed ecosystem culture
252
experiments (Online Methods). Figure 4 shows the comparison of the model predictions
253
(lines) and experimental measurements (circles) of the eight three-strain ecosystems,
254
which demonstrates that the models successfully predicted the dynamics of the
255
synthetic communities. Notably, the dynamics of these communities can be explained
256
by analyzing their social interaction networks. For instance, in the AmA-AmB-CpAg
257
consortium (Fig. 4c), AmA and CpAg both grew but AmB went extinct because AmA
258
and CpAg both produced nisin that suppressed AmB; in contrast, in the
AmA-AmB-259
CpBg consortium (Fig. 4d), all strains went extinct due to the fact that AmA produced
260
nisin inhibiting both CpBg and AmB and CpBg produced lcnA that suppressed AmA and
261
AmB.
We further tested the feasibility of predicting complex community behaviors from the
264
knowledge of two-strain consortia in selected four-strain ecosystems. Similar to the
265
three-strain cases, we extended the modeling framework to describe four four-strain
266
communities formed through combinatorial strain mixing (Supplementary Note 2). Again,
267
the only new parameters in the models were the growth rates of the newly introduced
268
strains. In parallel, we experimentally developed three new strains, PrBn, CmBn and
269
AmBn, by removing the fluorescence reporter genes of the strains PrB, CmB and AmB,
270
respectively (Online Methods and Supplementary Table 1). Using the new and previous
271
strains, we generated four four-strain ecosystems, performed their co-culture
272
experiments, and further compared the measured population dynamics with the model
273
predictions (Fig. 5). These findings show that the models derived from the two-strain
274
ecosystems successfully predicted the dynamics of more complex, four-strain
275
ecosystems.
276 277
Although complex communities may involve higher-order interactions, the agreement
278
between the model predictions and experimental measurements in Figs. 4 and 5
279
demonstrated that, at least for the ecosystems primarily containing pairwise interactions
280
such as those tested, their community dynamics can be derived from the behaviors of
281
simpler consortia. Additionally, these results affirmed that social interaction engineering
282
is an effective approach to program complex synthetic communities with desired
283
dynamics.
284 285
Spatial dynamics of three symmetrical ecosystems
286
In natural habitats, microbial communities such as the human gut microbiome and the
287
rhizosphere microbiome often extend across space where cellular interactions are
288
subject to the diffusion of interacting molecules37. This motivated us to examine whether
289
social interactions play a similar role in spatial settings by using the consortia with
290
symmetrical interactions—neutralism, cooperation and competition—as examples.
291
Using a computational model involving reaction-diffusion equations (Online Methods
292
and Supplementary Note 3), we simulated the development of spatial structures of the
293
three ecosystems whose initial cells were randomly seeded. Our results
294
(Supplementary Figs. 8a and 9a) showed that strains (NeA and NeB) formed random
295
patterns in neutralism with their detailed cell distributions subject to initial seeding,
296
relative abundance and growth rates; for the case of cooperation, the strains (CoA and
297
CoB) tended to be co-localized in space and the patterns developed better with close
298
initial ratios than biased; in competition, homogeneous patterns of a single strain (CpA
299
or CpB) emerged. Spatially averaged statistics of the initial and final populations in the
300
three cases (Supplementary Fig. 8b) further suggested that the ecosystem population
301
ratio drifts unidirectionally in neutralism, converges in cooperation, and diverges in
302
competition.
303 304
To test these model predictions, we performed a series of spatial patterning
305
experiments using droplets of well-mixed consortia with varied strain ratios (90:1 to
306
1:90) but a fixed total density (OD600=0.2) (Online Methods). Consistent with the
307
modeling predictions, the strains within individual colonies were randomly distributed
and Supplementary Fig. 9b). For comparison, we also examined the spatiotemporal
310
dynamics of the predation consortium, which showed an initial ratio-dependent pattern
311
that is distinct from the symmetrical cases (Supplementary Fig. 10).
312 313
For the case of cooperation, spatial patterns were better developed with close initial
314
ratios than with unbalanced ratios. However, we also noticed that CpB (red) in the
315
competing consortium dominated in the spatial structures at the 1:1 ratio, contradicting
316
the culture experiment where CpA (green) won the contest (Fig. 3e). We speculated
317
that the discrepancy arose from the different diffusibilities of nisin and lcnA caused by
318
the stronger hydrophobicity of the former, which was confirmed by the patterning
319
experiments on agar plates supplemented with Tween 20, a surfactant promoting nisin
320
diffusion (Supplementary Fig. 11a). For the same reason, the initial ratio separatrices of
321
the other three competing ecosystems all shifted towards a higher nisin producer
322
abundance (Supplementary Fig. 11b, c).
323 324
We further compared the relative abundances of the three symmetric consortia during
325
pattern developments. Similar to the modeling analysis, the experimental results (Fig.
326
6b) showed that the NeA fraction of the neutral consortium increased over time for all
327
initial conditions, the CoA fraction of the cooperative consortium converged towards
328
91% (i.e., 10:1 ratio), and the CpA fraction of the competitive consortium diverged
329
(either 100% or 0%) with the transition occurring between 3:1 and 1:1. For comparison,
330
population ratio changes in additional cases of competition were also calculated
(Supplementary Fig. 11d-g). To quantify our findings, we further computed the entropy,
332
a measure of the diversity of an ecosystem, and the intensity correlation quotient (ICQ),
333
a measure of strain co-localization in space, of the experimentally observed (Fig. 6c)
334
and simulated patterns (Supplementary Fig. 11h, i). These results pointed to the
335
existence of opposite population driving forces exerted by cooperation that promotes
336
coexistence and by competition favoring mutual exclusion.
337 338
In addition to well-mixed colonies, we investigated community organization in structured
339
environments where droplets of individual strains are spaced with varying distances
340
(Supplementary Fig. 12a-c and Online Methods). For neutralism, we found that the
341
strains (NeA and NeB) always coexisted. For cooperation, the strains (CoA and CoB)
342
coexisted but their patterns decayed with the spacing from the well-mixed filled circles
343
(0 mm), to back-to-back domes (3 mm) and to diminishing edges (5 mm). For
344
competition, emerged patterns shifted from one-strain exclusive circles (0mm) to
345
repelled two-strain domes (3 mm) and to full circles (5 mm) with the increase of droplet
346
distance. For comparison, additional cases of competition were also experimentally
347
tested (Supplementary Fig. 12d-g). The results confirmed that social interactions
348
continue to serve as a driving force in structured settings; meanwhile, spatial factors,
349
such as colony spacing in this case, function as additional regulators that modulate
350
pattern emergence.
351 352 353
With increasing appreciation of microbiomes’ profound impacts on human health,
355
environment and agriculture, understanding and manipulating complex microbial
356
ecosystems has become a defining mission for microbiome science. Our study provides
357
fundamental insights into the structure, dynamics and ecology of interacting microbial
358
species by characterizing synthetic consortia that serve as well-defined abstractions of
359
native communities. In addition, our work demonstrates that social interaction
360
engineering, through the combination of modular pathway reconfiguration and model
361
creation, is a systematic strategy to design ecosystem behaviors. Such a synthetic
362
biology approach sets the stage for creating complex, community functions for a variety
363
of applications. For example, toward microbial cell factories, social interaction
364
programming can be utilized to build the population stability of multiple synthetic strains
365
co-involved in the division of labor in chemical synthesis by introducing cross feeding or
366
differentiating substrate utilizations; such augmented stability will boost the robustness
367
and yield of chemical production during microbial fermentation. Social interaction
368
engineering also enables to establish synthetic ecosystems with predictable temporal
369
and spatial dynamics, which can serve as a controllable tool to systematically perturb
370
microbiomes and further alter their structure and dynamics in a desired manner.
371
Looking forward, as microbes inhabit primarily complex, natural environments, our
372
engineering strategy will become more versatile by validating the translatability of its
373
applications from well-controlled, laboratory conditions to realistic settings.
374 375
Methods
376
Methods, including statements of data availability and any associated accession codes
377
and references, are available in the online version of the paper.
378 379
Acknowledgements
380
We thank M. Sivaguru, G. Fried and A. Cyphersmith for their help with colony imaging
381
at the IGB Core Facilities at UIUC, and B. Pilas of the Roy J. Carver Biotechnology
382
Center at UIUC for assistance with flow cytometry analysis in this study. We also thank
383
H. Liu, W. van der Donk, X. Yang and A. Blanchard for stimulating discussions and help.
384
This work was supported by the National Science Foundation (1553649, 1227034), the
385
Office of Naval Research (N000141612525), the American Heart Association
386
(12SDG12090025), the Center for Advanced Study at UIUC, National Center for
387
Supercomputing Applications, the Paul G. Allen Frontiers Group, and the Defense
388
Threat Reduction Agency (HDTRA1-14-1-0006).
389 390
Author Contributions
391
T.L. and J.J.C. designed the study; T.L. conceived the project; W.K. performed the
392
experiments and collected the data; D.R.M. and T.L. developed the computational
393
models; W.K., D.R.M. and T.L. analyzed the data; T.L., J.J.C., W.K. and D.R.M.
394
discussed the results and wrote the paper.
395 396
Competing financial interests
397
The authors declare no competing financial interests.
1. Brenner, K., You, L. & Arnold, F.H. Engineering microbial consortia: a new
400
frontier in synthetic biology. Trends Biotechnol. 26, 483-489 (2008).
401
2. Großkopf, T. & Soyer, O.S. Synthetic microbial communities. Curr. Opin.
402
Microbiol. 18, 72-77 (2014).
403
3. De Roy, K., Marzorati, M., Van den Abbeele, P., Van de Wiele, T. & Boon, N.
404
Synthetic microbial ecosystems: an exciting tool to understand and apply
405
microbial communities. Environ. microbiol. 16, 1472-1481 (2014).
406
4. Bittihn, P., Din, M.O., Tsimring, L.S. & Hasty, J. Rational engineering of synthetic
407
microbial systems: from single cells to consortia. Curr. Opin. Microbiol. 45, 92-99
408
(2018).
409
5. Weber, W., Daoud-El Baba, M. & Fussenegger, M. Synthetic ecosystems based
410
on airborne inter-and intrakingdom communication. Proc. Natl. Acad. Sci. USA
411
104, 10435-10440 (2007).
412
6. Balagaddé, F.K. et al. A synthetic Escherichia coli predator–prey ecosystem. Mol.
413
Syst. Biol. 4, 187 (2008).
414
7. Chen, Y., Kim, J.K., Hirning, A.J., Josić, K. & Bennett, M.R. Emergent genetic
415
oscillations in a synthetic microbial consortium. Science 349, 986-989 (2015).
416
8. Gore, J., Youk, H. & Van Oudenaarden, A. Snowdrift game dynamics and
417
facultative cheating in yeast. Nature 459, 253 (2009).
418
9. Chuang, J.S., Rivoire, O. & Leibler, S. Simpson's paradox in a synthetic microbial
419
system. Science 323, 272-275 (2009).
10. Mee, M.T., Collins, J.J., Church, G.M. & Wang, H.H. Syntrophic exchange in
421
synthetic microbial communities. Proc. Natl. Acad. Sci. USA 111, E2149-E2156
422
(2014).
423
11. Wintermute, E.H. & Silver, P.A. Emergent cooperation in microbial metabolism.
424
Mol. Syst. Biol. 6, 407 (2010).
425
12. Zhou, K., Qiao, K., Edgar, S. & Stephanopoulos, G. Distributing a metabolic
426
pathway among a microbial consortium enhances production of natural products.
427
Nat. Biotechnol. 33, 377-383 (2015).
428
13. Minty, J.J. et al. Design and characterization of synthetic fungal-bacterial
429
consortia for direct production of isobutanol from cellulosic biomass. Proc. Natl.
430
Acad. Sci. USA 110, 14592-14597 (2013).
431
14. Hood, L. Tackling the microbiome. Science 336, 1209-1209 (2012).
432
15. Cho, I. & Blaser, M.J. The human microbiome: at the interface of health and
433
disease. Nat. Rev. Genet. 13, 260-270 (2012).
434
16. Falkowski, P.G., Fenchel, T. & Delong, E.F. The microbial engines that drive
435
Earth's biogeochemical cycles. Science 320, 1034-1039 (2008).
436
17. Berendsen, R.L., Pieterse, C.M. & Bakker, P.A. The rhizosphere microbiome and
437
plant health. Trends Plant Sci. 17, 478-486 (2012).
438
18. Faust, K. & Raes, J. Microbial interactions: from networks to models. Nat. Rev.
439
Microbiol. 10, 538-550 (2012).
440
19. Shou, W., Ram, S. & Vilar, J.M. Synthetic cooperation in engineered yeast
441
populations. Proc. Natl. Acad. Sci. USA 104, 1877-1882 (2007).
communication mediates a consensus in a microbial biofilm consortium. Proc.
444
Natl. Acad. Sci. USA 104, 17300-17304 (2007).
445
21. Hasty, J., McMillen, D. & Collins, J.J. Engineered gene circuits. Nature 420,
224-446
230 (2002).
447
22. Endy, D. Foundations for engineering biology. Nature 438, 449-453 (2005).
448
23. Andrianantoandro, E., Basu, S., Karig, D.K. & Weiss, R. Synthetic biology: new
449
engineering rules for an emerging discipline. Mol. Syst. Biol. 2, 2006.2008 (2006).
450
24. Arkin, A. Setting the standard in synthetic biology. Nat. Biotechnol. 26, 771-773
451
(2008).
452
25. Brophy, J.A. & Voigt, C.A. Principles of genetic circuit design. Nat. Methods 11,
453
508-520 (2014).
454
26. Collins, J.J. et al. Synthetic biology: How best to build a cell. Nature 509, 155-157
455
(2014).
456
27. Purnick, P.E. & Weiss, R. The second wave of synthetic biology: from modules to
457
systems. Nat. Rev. Mol. Cell Biol. 10, 410-422 (2009).
458
28. Hartwell, L.H., Hopfield, J.J., Leibler, S. & Murray, A.W. From molecular to
459
modular cell biology. Nature 402, C47-C52 (1999).
460
29. Lubelski, J., Rink, R., Khusainov, R., Moll, G. & Kuipers, O. Biosynthesis,
461
immunity, regulation, mode of action and engineering of the model lantibiotic
462
nisin. Cell. Mol. Life Sci. 65, 455-476 (2008).
30. Stoddard, G.W., Petzel, J.P., Van Belkum, M., Kok, J. & McKay, L.L. Molecular
464
analyses of the lactococcin A gene cluster from Lactococcus lactis subsp. lactis
465
biovar diacetylactis WM4. Appl. Environ. Microbiol. 58, 1952-1961 (1992).
466
31. West, S.A., Diggle, S.P., Buckling, A., Gardner, A. & Griffin, A.S. The social lives
467
of microbes. Annu. Rev. Ecol. Evol. Syst. 38, 53-77 (2007).
468
32. Foster, K.R. Social behaviour in microorganisms. in Social Behaviour: Genes,
469
Ecology and Evolution 331-356 (Cambridge Univ. Press, Cambridge, 2010).
470
33. Xavier, J.B. Social interaction in synthetic and natural microbial communities. Mol.
471
Syst. Biol. 7, 483 (2011).
472
34. Kong, W., Kapuganti, V.S. & Lu, T. A gene network engineering platform for
473
lactic acid bacteria. Nucleic Acids Res. 44, e37 (2016).
474
35. Kong, W. & Lu, T. Cloning and optimization of a nisin biosynthesis pathway for
475
bacteriocin harvest. ACS Synth. Biol. 3, 439-445 (2014).
476
36. Volterra, V. Variations and fluctuations of the number of individuals in animal
477
species living together. ICES J. Mar. Sci. 3, 3-51 (1928).
478
37. Nadell, C.D., Drescher, K. & Foster, K.R. Spatial structure, cooperation and
479
competition in biofilms. Nat. Rev. Microbiol. 14, 589-600 (2016).
480 481
Figure 1 483
484
Figure 1: Modular pathway reconfiguration for engineering microbial consortia.
485
(a) Two approaches to engineering gene circuits. A circuit can be created by
486
assembling selected genetic parts from scratch or through modular reconfiguration of
487
existing gene clusters. (b) nisin and lactococcin A (lcnA) biosynthesis gene clusters. (c)
488
Modular organization of the nisin pathway. It involves five functionally independent
489
modules, including those for precursor production (1), translocation and initial
490
modification (2), additional modification (3), signaling (4), and nisin immunity (5). (d)
491
modules, including those for precursor production (1), translocation (2), and lcnA
493
immunity (3). (e) Design of six two-strain consortia that differentially utilize the signaling
494
and antimicrobial features of the bacteriocins.
497
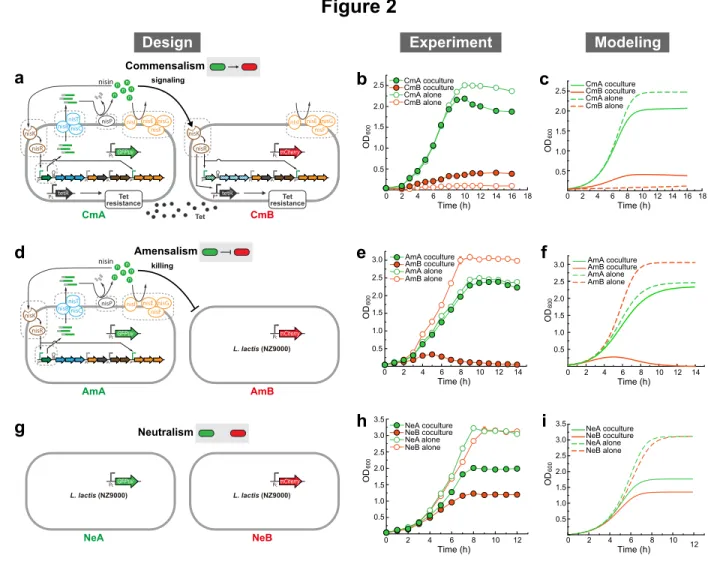
Figure 2: Synthetic consortia with one-way social interactions.
498
(a) Circuit diagram of a commensal microbial consortium. CmA is a nisin producer with
499
constant tetracycline resistance. CmB has nisin-inducible tetracycline resistance. Here,
500
genes filled with diagonal lines are knocked out. (b) Growth of CmA and CmB of the
501
commensal consortium, in monoculture and co-culture experiments using GM17 media
502
supplemented with tetracycline. (c) Simulated population dynamics for the commensal
503
consortium. (d) Circuit diagram of a consortium of amensalism. AmA is a nisin producer
504
that inhibits the growth of AmB. (e) Growth of AmA and AmB of the amensal consortium,
505
in monoculture and co-culture experiments. (f) Simulated population dynamics for the
506
consortium of amensalism. (g) Circuit diagram of a neutral consortium, where the two
507
strains NeA and NeB do not have any active social interactions. (h) Growth of two
508
neutral strains, NeA and NeB, in monoculture and co-culture experiments. (i) Simulated
509 NeA coculture NeB coculture NeA alone NeB alone 0 2 4 6 8 10 12 Time (h) 3.0 2.5 2.0 1.5 1.0 0.5 3.5 OD 600 AmA coculture AmB coculture AmA alone AmB alone 3.0 2.5 2.0 1.5 1.0 0.5 0 2 4 6 8 10 12 14 Time (h) OD 600 3.0 2.5 2.0 1.5 1.0 0.5 OD 600 0 2 4 6 8 10 12 14 Time (h) AmA coculture AmB coculture AmA alone AmB alone CmA coculture CmB coculture CmA alone CmB alone 0 2 4 6 8 10 12 14 Time (h) 16 18 2.5 2.0 1.5 1.0 0.5 OD 600 0 2 4 6 8 10 12 14 Time (h) 16 18 2.5 2.0 1.5 1.0 0.5 OD 600 CmA coculture CmB coculture CmA alone CmB alone 0 2 4 6 8 10 12 Time (h) 3.0 2.5 2.0 1.5 1.0 0.5 3.5 OD 600 NeA coculture NeB coculture NeA alone NeB alone c a b Experiment Modeling f d e i g h NeA NeB L. lactis (NZ9000) L. lactis (NZ9000) PcmCherry PcGFPuv Neutralism Amensalism Commensalism nisK nisR nisF nisE nisG nisI nisin n n nisP
nisB nisCnisT
n n n n tetR Pc CmA CmB signaling P* Pc Pc P* PcGFPuv resistanceTet nisK nisR nisF nisE nisG nisI P* Pc Pc P* tetR P* PcmCherry resistanceTet Tet nisK nisR nisF nisE nisG nisI nisin n n nisP
nisB nisCnisT
n n n n AmA AmB P* Pc Pc P* killing L. lactis (NZ9000) PcmCherry PcGFPuv Design
population dynamics for the neutral consortium. In panels b, e, and h, closed and open
510
circles stand for population growth in co- and monoculture experiments, respectively. In
511
each co-culture experiment, strains were inoculated at 1:1 initial ratio. Experimental
512
data are presented as mean (s.d.), n=3. In panels c, f, and i, dashed lines correspond to
513
monoculture growth, while solid lines correspond to co-culture growth.
516
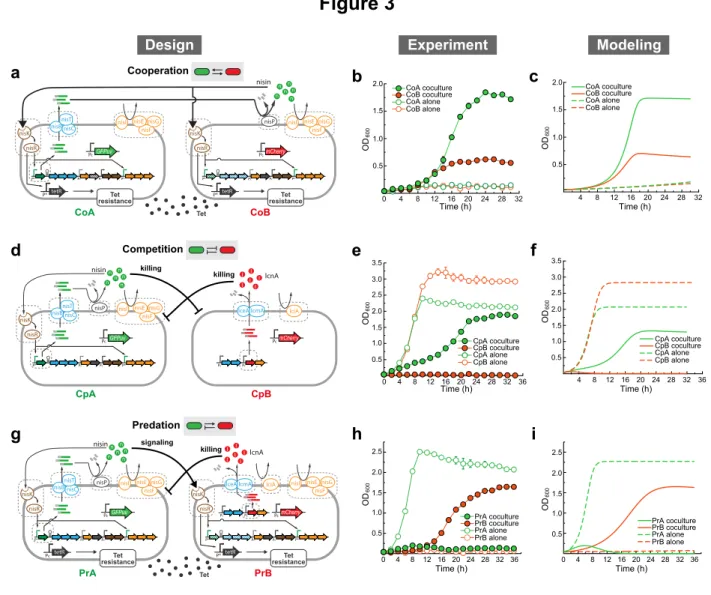
Figure 3: Synthetic consortia involving two-way social interactions.
517
(a) Circuit diagram of a cooperative consortium. CoA produces nisin precursor and CoB
518
modifies the precursor to produce active nisin, forming a cooperation of successful nisin
519
production. Nisin induces the tetracycline resistance of both strains, which enables them
520
to survive in tetracycline-supplemented media. Here, genes filled with diagonal lines are
521
knocked out. (b) Growth of two cooperative strains (CoA and CoB) in co-culture and
522
monoculture experiments. (c) Simulated population dynamics for the cooperative
523
consortium. (d) Circuit diagram of a mutually competitive consortium. CpA is a nisin
524
producer and CpB is a lcnA producer. CpA outcompetes CpB in the co-culture
525
experiment. (e) Growth of two competitive strains (CpA and CpB) in co-culture and
526
monoculture experiments. (f) Simulated population dynamics for the competing
2.0 1.5 1.0 0.5 OD 600 CoA coculture CoB coculture CoA alone CoB alone 0 4 8 12 20 24 32 Time (h)16 28 2.0 1.5 1.0 0.5 OD 600 CoA coculture CoB coculture CoA alone CoB alone 24 12 8 32 4 20 Time (h)16 28 Cooperation nisK nisR nisF nisE nisG nisI nisB nisCnisT
tetR P* CoA CoB P* Pc Pc P* PcGFPuv resistanceTet nisK nisR nisF nisE nisG nisI nisin n n nisP n n n n tetR P* P* Pc Pc P* resistanceTet PcmCherry Tet c a b f d e i g h 3.0 2.5 2.0 1.5 1.0 0.5 3.5 OD 600 CpA coculture CpB coculture CpA alone CpB alone 0 4 8 12 20 24 32 36 Time (h)16 28 3.0 2.5 2.0 1.5 1.0 0.5 3.5 OD 600 24 12 36 8 32 4 20 Time (h)16 28 CpA coculture CpB coculture CpA alone CpB alone Competition nisK nisR nisF nisE nisG nisI nisin n n nisP
nisB nisCnisT
n n n n CpA CpB P* Pc Pc P* PcGFPuv PcmCherry lciA lceA lcmA lcnA l l l l l l Pc Pc killing killing 0 4 8 12 20 24 32 36 Time (h)16 28 2.5 2.0 1.5 1.0 0.5 OD 600 PrA coculture PrB coculture PrA alone PrB alone 0 4 8 12 20 24 32 36 Time (h)16 28 PrA coculture PrB coculture PrA alone PrB alone OD 600 2.5 2.0 1.5 1.0 0.5 Predation nisK nisR nisF nisE nisG nisI nisin n n nisP
nisB nisCnisT
n n n n tetR Pc PrA Tet PrB signaling P* Pc Pc P* PcGFPuv resistanceTet killing nisK nisR nisF nisE nisG nisI P* Pc Pc P* tetR P* PcmCherry resistanceTet lciA lceA lcmA lcnA l l l l l l Pc Pc Experiment Modeling Design
consortium. (g) Circuit diagram of a predative consortium. PrA (prey) is a nisin producer
528
with constant tetracycline resistance. PrB (predator) is an lcnA producer with
nisin-529
inducible tetracycline resistance. PrA induces the growth of PrB by secreting nisin; in
530
turn, PrB suppresses the growth of PrA by releasing lcnA. Here, genes filled with
531
diagonal lines are knocked out. (h) Growth of two predation strains, PrA and PrB, in
co-532
culture and monoculture experiments. (i) Simulated population dynamics for the
533
consortium of predation. In panels b, e, and h, closed and open circles stand for
534
population growth in culture and monoculture experiments, respectively. In each
co-535
culture experiment, strains were inoculated at 1:1 initial ratio. Experimental data are
536
presented as mean (s.d.), n=3. In panels c, f, and i, dashed lines correspond to
537
monoculture growth, while solid lines correspond to co-culture growth.
538 539
541
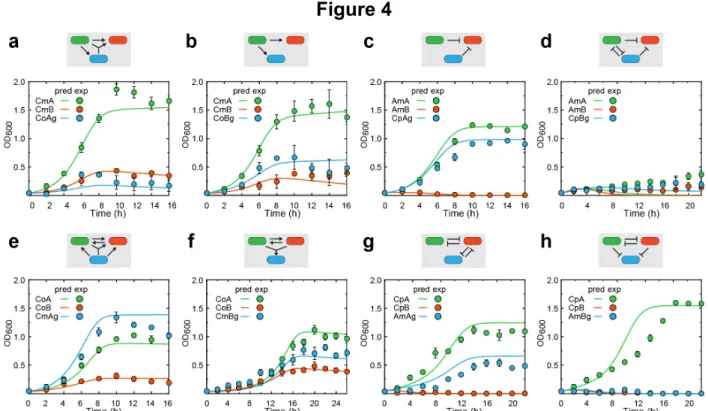
Figure 4: Model-predicted and experimentally measured population dynamics of
542
three-strain ecosystems.
543
(a) Population dynamics of a three-strain consortium composed of the two
544
commensalism strains (CmA and CmB) and a cooperation strain (CoAg). (b) Population
545
dynamics of a three-strain consortium composed of the two commensalism strains
546
(CmA and CmB) and a cooperation strain (CoBg). (c) Population dynamics of a
three-547
strain consortium composed of the two amensalism strains (AmA and AmB) and a
548
competition strain (CpAg). (d) Population dynamics of a three-strain consortium
549
composed of the two amensalism strains (AmA and AmB) and a competition strain
550
(CpBg). (e) Population dynamics of a three-strain consortium composed of the two
551
cooperation strains (CoA and CoB) and a commensalism strain (CmAg). (f) Population
552
dynamics of a three-strain consortium composed of the two cooperation strains (CoA
553
and CoB) and a commensalism strain (CmBg). (g) Population dynamics of a
three-554
strain consortium composed of the two competition strains (CpA and CpB) and an
555
amensalism strain (AmAg). (h) Population dynamics of a three-strain consortium
556
composed of the two competition strains (CpA and CpB) and an amensalism strain
557
panel. For all panels, lines and color circles stand for model predictions and
559
experimental results, respectively. Data are presented as mean (s.d.), n=3. In all
co-560
culture experiments, strains were inoculated at 1:1:1 initial ratio.
561 562
564
565
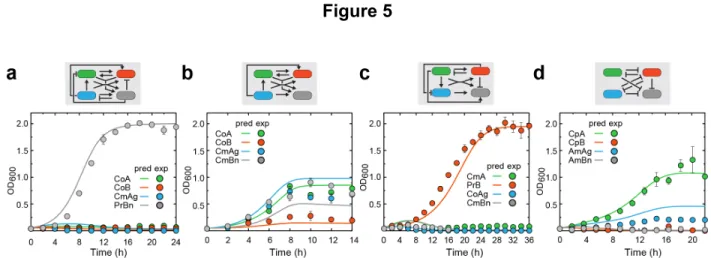
Figure 5: Model-predicted and experimentally measured population dynamics of
566
four-strain ecosystems.
567
(a) Population dynamics of a four-strain consortium composed of two cooperation
568
strains (CoA and CoB), a commensalism strain (CmAg) and a predation strain (PrBn).
569
(b) Population dynamics of a four-strain consortium composed of two cooperation
570
strains (CoA and CoB) and two commensalism strains (CmAg and CmBn). (c)
571
Population dynamics of a four-strain consortium composed of two commensalism
572
strains (CmA and CmBn), a predation strain (PrB) and a cooperation strain (CoAg). (d)
573
Population dynamics of a four-strain consortium composed of two competition strains
574
(CpA and CpB) and two amensalism strains (AmAg and AmBn). Each ecosystem’s
575
interaction network is shown on the top of the corresponding panel. For all panels, lines
576
and color circles stand for model predictions and experimental results, respectively.
577
Data are presented as mean (s.d.), n=3. In all co-culture experiments, strains were
578
inoculated at 1:1:1:1 initial ratio.
579 580
Figure 6 581
582
Figure 6: Spatial dynamics of three symmetrical communities.
583
(a) Spatial patterns emerged from the well-mixed consortia of neutralism, cooperation
584
and competition growing on agar plates. A density of OD600=0.2 and varied ratios from
585
90:1 to 1:90 were used as initial conditions. Each experiment was repeated at least
586
three times. Representative pictures from the experiments are shown. (b) Comparison
587
of the total initial and final population ratios of the consortia the experimental patterning
588
processes. The NeA fraction increases in all cases due to a fast growth rate of NeA, the
589
CoA fraction converged to ~90%, and CpA fraction diverged to either 100% or 0%
590
depending on the initial conditions. Experimental data are presented as mean (s.d.),
591
n=3. (c) Entropy (open circles) and intensity correlation quotient (ICQ) (closed circles) of
592
the experimental patterns in panel a. The values of entropy and ICQ both follow the
593
order of cooperation > neutralism > competition, although they are subject to initial
594
conditions. Data are averaged from n=3 experiments. Each experiment was repeated at
595
least three times. Representative pictures from experiments are shown.
596 597 598 599
Strains. Lactococcus lactis NZ9000 was used as host for strains in all ecosystems.
602
Lactococcal strains were cultured in M17 medium with 0.5% glucose (GM17) at 30°C. All
603
plasmids were first constructed and sequenced in E. coli NEB-10β, then transformed into L.
604
lactis by electroporation. Antibiotics were added as required: chloramphenicol (10 µg ml-1),
605
erythromycin (250 µg ml-1), tetracycline (3 µg ml-1), kanamycin (50 µg ml-1), spectinomycin
606
(50 µg ml-1), and streptomycin (150 µg ml-1) for E. coli, and chloramphenicol (5 µg ml-1),
607
erythromycin (5 µg ml-1), and tetracycline (10 µg ml-1) for L. lactis. Please see
608
Supplementary Table 1 for full strain and plasmid information.
609 610
Construction of the reporter and selector plasmids. Oligos for plasmid construction are
611
listed in Supplementary Table 2. All reporter and selector plasmids were developed from an
612
L. lactis-E. coli shuttle vector, pleiss-Nuc, which contains a pSH71 origin, a chloramphenicol
613
resistance gene, a PnisA promoter from a nisin gene cluster, and a Nuc reporter38. Gibson
614
assembly was used to construct all the reporter and selector plasmids. The plasmid for
615
constitutively expressing GFP (pleiss-Pcon-gfp) was constructed by replacing PnisA
616
promoter and Nuc in pleiss-Nuc with a gfpuv gene and the constitutive promoter of lcnA30.
617
The plasmid for constitutive expression of RFP, pleiss-Pcon-rfp, was constructed by
618
replacing gfp in pleiss-Pcon-gfp with mcherry. The selector plasmids
pleiss-Pnis-tet-Pcon-619
gfp and pleiss-Pnis-tet-Pcon-rfp were constructed by amplifying tetR gene from the plasmid 620
pVPL3112 and Pcon-gfp or Pcon-rfp cassette from the plasmid constructed above and
621
cloning them into pleiss-Nuc39. The tetR gene was under the control of PnisA promoter. The 622
plasmid pleiss-Pcon-tet-Pcon-gfp was constructed by insertion of tetR and its RBS 623
downstream of gfp in pleiss-Pcon-gfp. Both gfp and tetR were under the control of the 624
glucuronidase (GusA)40 were constructed by replacing gfp in the plasmids
pleiss-Pnis-tet-626
Pcon-gfp and pleiss-Pcon-tet-Pcon-gfp with gusA. The reporter-free selector plasmids were
627
constructed by deleting the gfp gene from pleiss-Pnis-tet-Pcon-gfp and
pleiss-Pcon-tet-628
Pcon-gfp.
629 630
Construction of the plasmids for nisin production and nisin resistance. All
nisin-631
producing plasmids in ecosystems were constructed based on the plasmid, pWK6, which
632
was cloned by insertion of a wild-type nisin gene cluster from L. lactis k29 into pCCAMβ1;
633
an L. lactis-E. coli shuttle vector34,35. To avoid leaky expression of promoter PnisA in cells
634
provided with multi-copy nisRK, the nisRK gene in the multi-copy plasmid pWK6 was
635
knocked out. In brief, the plasmids pWK6 and the Red/ET recombination plasmid pRedET
636
(GeneBridges) were transferred into 10β to generate the strain
NEB-637
10β/pWK6/pRedET. Then the aadA gene (spectinomycin resistant gene) was amplified
638
from plasmid pBeta34 and the generating fragment was flanked with a short sequence of 3’
639
of nisP and 5’ of nisF and transformed into the induced competent cells of
NEB-640
10β/pWK6/pRedET using the protocol described previously34. After recombination, the
641
nisRK gene in pWK6 was replaced with the aadA gene, generating a new plasmid
pWK6-642
RK-. Then, pWK6-RK- was transferred into L. lactis NZ9000 (a single copy nisRK in its
643
chromosome) to test the complementation and recovery of the nisin positive phenotype.
644
The plasmid pWK6 was also engineered to reduce its nisin productivity through
645
reducing the RBS strength of nisB using ssDNA recombination performed as described
646
previously34. In brief, a 90-nt ssDNA oligo nisB269 embracing an RBS sequence with a
647
translation initiation rate (TIR) of 269 AU was designed using RBS calculator
648
(https://salislab.net/software/). The ssDNA was transferred to the Beta protein expressing
further engineered to generate a nisRK knock-out version pWK6b-RK- according the
652
method described above. Then, pWK6b-RK- was also transferred to L. lactis NZ9000 to test
653
nisRK complementation.
654
The nisin resistant plasmid was developed based on pWK6. First, the start codon
655
and RBS of nisA were mutated in pWK6 by ssDNA recombination using a 90-nt oligo
656
nisAmut. Second, nisP and nisRK were knocked out by selection and counter-selection
657
using a knstrep cassette as described previously34. Briefly, knstrep cassette flanking with 5’
658
of nisP and 3’ of nisRK was PCR amplified and transferred to NEB-10β/pWK6/pRedET
659
replacing nisPRK. A fragment generated by fusion of a short fragment of 5’ of nisP and 3’ of
660
nisRK using overlap extension PCR (OE-PCR) was transformed into the strain to replace
661
knstrep by counter selection. Third, nisBTC was knocked out using the same method. The
662
resulting plasmid was named pWK6-IFEG. Though pWK6-IFEG was unable to produce and
663
modify nisin, it has all promoters and nisin immunity genes; it was transferred to L. lactis
664
NZ9000 to test nisin immunity.
665 666
Construction of the plasmids for nisP- nisin precursor producer and nisP+ nisin 667
resistant strain. The NisP deficient prenisin synthesis plasmid for cooperation was
668
constructed from the plasmid pWK6b. First, nisP and nisRK genes in pWK6b were knocked
669
out by replacing them with knstrep cassette. Second, a fragment combining 5’ of nisP and 3’
670
of nisRK was generated by overlap extension PCR and used to replace the knstrep
671
cassette by counter selection. The resulting plasmid was named pWK6b-PRK-. The NisP+
672
nisin resistant plasmid for cooperation was generated from pWK6. First, start codon and
673
RBS of nisA were mutated in pWK6 by ssDNA recombination using the 90-nt oligo nisAmut.
cassette. Third, nisBTC was knocked out by selection and counter selection. The resulting
676
plasmid was named pWK6-IPFEG. Then, it was transferred to L. lactis NZ9000 to test nisin
677
immunity. In addition, NZ9000/ pWK6b-PRK- and NZ9000/ pWK6-IPFEG were co-cultured
678
at 1:1 ratio to examine their ability in cooperative production of nisin.
679 680
Construction of the plasmid for lcnA producer. Genes of lcnA gene cluster were
681
amplified from plasmid pFI2396 and pFI2148 and assembled with P32 promoter into
pleiss-682
Nuc vector in the following order: pleiss-3’-lciA-lcmA-lceA-Promoter-5’-5’-P32-lcnA-3’-pleiss
683
(P32-lcnA has a different direction with other genes in the cluster)41. The RBS TIR of the
684
precursor gene lcnA was changed by designing of RBS sequence with different TIR using
685
RBS calculator. Then the lcnA gene cluster was amplified and subcloned to Not I site of
686
pCCAMβ1 by Gibson assembly. Two variants pWK-lcnA5k and pWK-lcnA20k with TIR of
687
5078 AU and 19950 AU were chosen for subsequent experiments. In addition, genes of
688
lcnA gene cluster were also assembled to wild-type gene cluster with their native promoters
689
in original order in pleiss-Nuc vector. The wild-type gene cluster was then transferred to
690
pCCAMβ1 to generate the plasmid pWK-lcnAwt.
691 692
Construction of the plasmid with nisin resistance and lcnA gene cluster. The plasmid
693
with both nisin resistance and lcnA production in predation was constructed by combining
694
pWK-lcnAwt and pWK6. First, pWK6 was engineered to nisA mutation, nisBTC knockout and
695
nisPRK knockout by ssDNA recombination and selection and counter selection as
696
mentioned above. Then, the modified nisin gene cluster with only nisin resistance function
697
was amplified and cloned to Not I site of pWK-lcnAwt through Gibson assembly. The
698
resulting plasmid was named pWK6-IFEG-lcnAwt.
NZ9000. Agar diffusion assays were performed to measure nisin productivity of modified
702
nisin producers and cooperative strains in cooperation as well as lcnA productivity of lcnA
703
producers. Agar diffusion assay was performed as previously described34 except a new L.
704
lactis 117 indicator strain was used. The plasmid pCCAMβ1 (ErmR) and
pleiss-Pcon-tet-705
Pcon-gfp (CmR TetR) were co-transformed to L. lactis 117 so that it was resistant to
706
erythromycin, chloramphenicol and tetracycline simultaneously. Then, the inhibition zone
707
could affect the concentration of nisin in the culture without interference of antibiotics.
708 709
Co-culture experiments. Bacterial strains were grown overnight in GM17 media containing
710
chloramphenicol and erythromycin to an early stationary phase. Bacteria were centrifuged
711
and washed twice with fresh GM17 media. Then OD600 of the cells was adjusted to 2.0.
712
Each strain in co-culture or monoculture was inoculated to fresh media with appropriate
713
antibiotics at a 1:50 dilution. For neutralism, amensalism and competition, erythromycin and
714
chloramphenicol were added. For commensalism, cooperation and predation, erythromycin
715
and tetracycline were added for selection. Samples were taken from the cultures every two
716
hours for measurement of growth. Meanwhile, cells from 500 µl of cultures were centrifuged
717
and resuspended in PBS buffer. The cells were diluted to 106 cells ml-1 and stored in PBS
718
buffer at 4°C for at least 4 hours then vigorously vortexed breaking most chains of
719
lactococci into single cells. Then green and red fluorescent cells in the sample were
720
counted by a Flow cytometer (BD LSR Fortessa). GFP was measured on the FITC channel,
721
excited with a 488-nm blue laser and detected with a 530/30-nm bandpass filter. RFP was
722
measured on PE-Texas Red channel using a 561-nm yellow/green laser and a 610/20-nm
723
bandpass filter. At least 10,000 events were recorded for green and red cell counting per
fluorescence microscope and at least 1000 cells from each sample were counted manually.
726
The GusA-containing strains in the three- and four-strain consortia were distinguished by
727
their blue color on GM17 agar plates containing 50 µg ml-1 of X-gluc
(5-Bromo-4-chloro-3-728
indolyl beta-D-glucuronide sodium salt), and their colony forming units (CFUs) were counted
729
to calculate their ratio in the population. For the no-color strains in four-strain consortia, their
730
populations were obtained by subtracting the numbers of green, red and blue cells from the
731
total populations. The growth curve of each strain in the population was drawn by
732
multiplying total OD600 of the population with individual ratios. Control experiments with a
733
single strain in commensalism, cooperation and predation induced with nisin was performed
734
as follows: overnight cultures (diluted to OD600=2.0) were inoculated to fresh GM17 media
735
with erythromycin, tetracycline and 25 ng ml-1 of nisin (1 IU=25 ng) at a ratio of 1:50. Then
736
the culture was incubated at 30°C and cell densities were measured at one or two hours’
737
intervals.
738 739
Spatial patterns of well-mixed consortium droplets. Overnight single-strain cultures for
740
neutralism, cooperation and competition were centrifuged and washed with fresh GM17
741
media. The cells were diluted to an OD600 of 0.2 using fresh media. Strain A and strain B in
742
each ecosystem were mixed at different ratios from 90:1 to 1:90. Then 1 µl of the mixture
743
was added onto a 90-mm agar plate (20 ml of GM17 agar with appropriate antibiotics and
744
2% agar). The plates were incubated at 30°C for different time. The incubation time was
745
determined by the growth rate of strains in neutralism, cooperation (induced with 25 ng/ ml
746
of nisin) and competition. The ratio of average growth rate of two strains in each consortium
747
is 0.6 (Cooperation): 0.79 (Competition): 1 (Neutralism) in liquid culture. Cooperation with
748
the lowest growth rate formed clear laws on agar after 45 h growth. Then the end point of