Developing a Methodology to Link Printed Circuit Board
Assembly Yield Targets to Commodity Group
Quality
Goals
By
Jason Wessing
Cauthen
Bachelor of Science, Mechanical Engineering, University of California at Berkeley, 2000 Submitted to the MIT School of Management and the Engineering Systems Department
in Partial Fulfillment of the Requirements for the Degrees of
Master of Business Administration AND
Masters of Science in Engineering Systems
In conjunction with the Leaders for Manufacturing Program at the
Massachusettes Institute of Technology
June 2009
@2009 Jason Cauthen. All rights Reserved.
The author hereby grants permission to MIT to reproduce and distribute publicly paper and electronic copies of this thesis document in whole or in part
Signature of Author- ,
Department of Engineering Systems and MIT Sloan School of Management
May 8, 2009
Certified by
t7 Roy Welsch, Thesis Supervisor Professor of Statistics & Mana nent Science andyngineering Systems
Certified by
David Hardt, Thesis Supervisor Ralph E. and Eloise F. Cross Professor of Mechanical Engineering and Professor of Engineering Systems
Accepted by
Nancy Leveson Professor of Engineering Systems and Aeronautics & Astronautics Chair ESD Education Committee
Accepted by
Debbie Berechman
MASSACHUSETTS INSlTruTE Executive Director, MIT Sloan MBA Program
OF TECHNOLOGY
JUN 10 2009
ARCHIVES
ARCHIVES
LIBRARIES
Developing a Methodology to Link Printed Circuit Board
Assembly Yield Targets to Commodity Group Quality Goals
By
Jason Wessing Cauthen
Submitted to the MIT Sloan School of Management and the
Engineering Systems Department on May 8, 2009 in Partial Fulfillment of the Requirements for the Degrees of Master of Business Administration and
Master of Science in Engineering Systems
ABSTRACT
The increasing complexity of high-end routing products, a highly diverse product mix, and continually demanding quality requirements have intensified the challenges faced by Cisco. Primary among these is managing the broad array of suppliers to ensure that the parts they are delivering meet the quality needs of the end product while balancing this with the need to remain cost competitive. Because components are often used across many product lines, it is can be difficult to determine exactly how an improvement to the quality of an individual component will impact Cisco's overall yield metrics.
This thesis establishes a methodology for linking component quality to assembly-level yields. The component level quality is measured in Defective Parts Per Million (DPPM) at the Commodity Group level, and PCBA Yield is measured as the percentage of boards which meet Cisco's Six Sigma yield targets. The proof of concept for such an analytical link shows that these two metrics can be analytically related, and furthermore can be used to ensure that the effort expended to improve DPPM is optimally targeted to have an impact on assembly-level yields.
Thesis Supervisor:
Roy Welsch
Professor of Statistics & Management Science and Engineering Systems David Hardt
Ralph E. and Eloise F. Cross Professor of Mechanical Engineering and Professor of Engineering Systems
ACKNOWLEDGEMENTS
I would like to thank Cisco for sponsoring my internship. In particular, I would like to thank Mike Lydon and Gary Cooper always making the time to ensure that my internship continuously provided opportunities for meaningful educational and experiential learning. The support and Mike and Gary provided resulted in an internship that enabled me to continue to learn and develop throughout the six months.
In addition to Mike and Gary, I would like to thank Sachin Kothawade for his contribution to the work that went into this thesis. This work would not have gotten off the ground without Sachin's early coaching and assistance in refining the issue. There are many others whose help and support also contributed directly to the work in this thesis who I would like to recognize. Among these are Zoe Conroy, JP Loose, Hitesh Merchant, Sade Sobande, Pavan Kollipara, George Solorzano, and Sylvain Tourangeau.
Due in part to the broad range of responsibilities I was permitted to explore through the course of the internship, there are many Cisco personnel who generously shared their time, expertise, and encouragement to ensure my internship was a meaningful experience. Ali Nouri, Dan Monge, Marc Hartranft, Jim Comb, Manny Raposa, Dave Wooldrige, Raj Gupta, Mary Tong, Jon Glommon, Peri Ryan, Ginni Chadha, David Senk, and Erich Schafer, thank you. Finally, thank you to the LFM alumni at Cisco: Jim Miller, Prentis Wilson, Chris Pandolfo, Erik Stewart, Julie Go, and Johnson Wu for your help, feedback, and support.
I would also like to thank my thesis advisors, Roy Welsch and David Hardt for their guidance, expertise, and feedback. I would like to thank the LFM program for its support of this work. Finally, I would like to acknowledge two LFMs in particular, Daniel Davis '08 for completing an internship and leaving well-defined for me to build on and Andres Olivella '09 for helping me to work through some of my less developed ideas. Each of you have been instrumental in helping me to complete the work of this thesis.
Finally, I would like to thank my fiancee, Sam Test, for her understanding and the unmatched confidence that she places in me. Her easy laugh, incredible warmth, and unflagging support have made the last two years, and the ones preceding them, indescribably special. Thank you Sam, for consistently providing the love that enables me to keep everything else in proper perspective.
Table of Contents
1 Cisco's M odel for Yield Targets ... ... 13
1.1 Developm ent of Unified "Six Sigm a" Targets... ... ... 13
1.2 Com m odity-level goal setting ... ... 14
1.3 Relationship between the two sets of goals ... ... 15
2 Project Orientation ... 16
2.1 Project Objectives ... ... 16
3 Com pany Background ... ... 17
3.1 Cisco History ... ... ... 17
3.2 Outsourcing M odel... 17
3.3 Innovation ... 18
3.4 PCBA M anufacture and Com ponent-Related Failures ... 19
4 Challenges to Change -Three Lens Analysis ... ... 21
4.1 Strategic Design ... .. 21
4.2 Political ... 24
4.3 Cultural ... 24
4.4 Three Lens Sum m ary ... ... 25
5 Literature Review : Linking PCBA Yields to Com ponent DPPM ... . 26
6 Methodology ... 27
6.1 Description and Developm ent of M odel ... 27
6.2 Approach ... 27
6.3 Data Collection ... 29
6.4 Key Assum ptions ... 36
6.5 M ixed Integer Program m ing Optim ization ... ... 38
6.6 Param eters ... ... ... 38
6.7 Decision Variables ... ... 41
6.8 Decision Expressions ... ... 42
6.9 Objective Function ... ... 45
6.10 Constraints ... 46
7 Optim ization Proof of Concept ... ... 48
7.1 Data Inputs ... 48
7.2 Outputs ... ... ... 49
7.3 Ratcheting up the Percent Pass Threshold ... 50
7.4 Results ... ... ... 51
7.5 Sum m ary ... 52
8 Recom m endations for Future Study... 53
8.1 Refining Input Data ... ... 53
8.2 Im proving Com m odity Groupings ... 53
8.3 Expanding the Size of the Data Set ... 54
8.4 Im proving the M odel of DPPM Im provem ent ... ... ... 54
8.5 Optim izing for Total Cost ... ... 54
9 Conclusions ... 55
10 Appendix ... ... 57
10.2 Appendix B: Optimi zationCode ... 58 Appendix C: Supplementary Data... 60
Figure 1: Simplified Diagram of Cisco's Supply Chain... ... 18
Figure 2: PCBA Process Flow and Assembly Steps... ... 19
Figure 3: Example of the Contributions of Different Factors to Six Sigma Targets ... 30
Figure 4: Performance vs. Six Sigma Target... 32
Figure 5: Historical DPPM for Representative Commodity Groups... 33
Figure 6: Operational and Aspirational Targets for DPPM in Commodity Groups ... 34
Figure 7: Decoder Ring between BOM-designated Component Groupings and Commodity Group Classifications ... ... . . .... 35
Figure 8: U sage Inform ation ... 36
Figure 9: Distribution of DPPM over different ASIC Part Numbers ... 36
Figure 10: Graph of DPPM Improvement vs. Normalized Engineering Effort ... 37
Figure 11: Input for DPPM Data for Test Run ... 48
Figure 12: First 25 PCBAs used in Analysis...49
Figure 13: Results for First 25 Boards (Complete Results in Appendix) ... 50
Figure 14: D PPM -Related O utput ... ... 50
Figure 15: Six Sigma Compliance as a Result of Invested Effort ... . 51
1 Cisco's Model for Yield Targets
1.1 Development of Unified "Six Sigma" Targets
With an increasingly large product portfolio, Cisco needed to develop a unified way to evaluate yields across all product lines. To achieve this Cisco created a methodology to assign yield targets to every PCBA it manufactures. These targets are based on several factors related to the complexity of the boards, and are designed to enable comparisons of yield performance between boards of similar complexity. Throughout this thesis, these targets will be referred to as the "Six Sigma" targets.
1.1.1 Motivation for developing Six Sigma targets
Prior to developing the Six Sigma targets, Cisco set yield targets for each product line independently. These targets were usually comprised of a combination of historical improvements and often heavily influenced by what the director responsible for a particular product believed was possible based on his experience. This resulted in yield targets - and performance - that was often inconsistent across the company. Similar products that would theoretically exhibit similar yield performance demonstrated wildly differing yields in practice. Because there was no systematic way to aggregate this data to determine what drove these differences, it was not always clear whether discrepancies were caused by product design, process instability, component quality, or any of a host of other possible issues. When problems did arise, it was difficult to determine who was responsible for the problem: ambiguity regarding the cause could lead to finger-pointing and acrimony between different groups. It was clear that a better way was needed to track manufacturing yield performance.
1.1.2 Six Sigma target model
The Six Sigma yield methodology was developed to provide an analytical means to set yield targets that could be applied throughout the company. These targets were intended to be used for current and new products to provide consistent targets across all business units. A statistical analysis revealed the four biggest drivers to PCBA yield and resulted in a formula that
could provide a predicted yield target for any type of board. One of these drivers had to do with the components on a board. Boards falling well below this target were selected for improvement or remediation, and boards above the target were deemed to be good quality. All newly introduced products, as well as production products falling below the designated target, were required to be put on a "Yield Achievement Plan." Each plan outlined the steps for improving board yield, which could include focusing on a particular problematic component, improving a key process step, or even in some cases "re-spinning1" an ASIC in order to insure it
delivered the required performance to enable achievement of the targets.
In this way, all PCBAs made by Cisco were given clear goals, and teams were aligned to meet these goals by improving the boards.
1.2 Commodity-level goal setting
At the component/commodity level, things worked somewhat differently. Target yields for components are not set on a component-by-component basis, but rather at the commodity group level and include all the components within the commodity group. For example, the ASIC commodity group may have a goal of 5000 DPPM (not the real number) that includes all ASICs. These cover a wide range from very simple ASICs with few pins to very complex ones with dozens of pins. Commodity groups typically have Component Engineers and Supplier Quality
Engineers who are responsible for improving the yield of the components in that group, but the number of dedicated engineers varies somewhat from one commodity group to another. However, there is not a consistent method for choosing which commodity groups need to be targeted for improvement within a commodity group and it is often the case that the components being targeted are those that have most recently caused a problem. Though this is an effective means of reactively addressing known problems, it does not meet Cisco's aspiration to pro-actively manage component quality issues.
1 Re-spinning is a major redesign of a component, typically an ASIC. Though this can sometimes result in substantial yield improvements, it comes at a substantial cost, so a cost-benefit analysis is required to determine if the improvements predicted in a re-spin will result in sufficient savings to cover the investment.
A lack of actionable data makes determining how many engineers are needed to address issues in a particular commodity group a practice that is more art than science. Ideally, component engineers and supplier quality engineers would be staffed in such a way as to improve component quality such that it had the biggest impact on PCBA yields. Unfortunately, there is not clear data that relates the reduction of DPPM for a particular commodity group to an increase in the number of PCBAs that meet their Six Sigma targets. Building this critical link is a recognized need at Cisco, and is what this thesis endeavors to do.
1.3 Relationship between the two sets ofgoals
As mentioned above, currently the commodity level DPPM goals and the PCBA-level Six Sigma targets are established completely independently from one another, via independent means. Furthermore, each group tasked with achieving those metrics operates mostly independently. For example, component and supplier quality engineers are not formally incentivized to increase the number of PCBAs that meet their Six Sigma target. A single improvement in component quality will often impact multiple boards (1). In the case of Cisco, this means that the effect of a single improvement can ripple across different business units throughout the organization, but be diffuse enough that it is difficult to measure quantitatively. Component engineers and supplier quality engineers are incentivized to reduce average DPPM for their commodity group with insufficient focus on the impact to the yield of the final products. This disconnect needs to be bridged in order to maximize the effectiveness of the efforts to improve component quality.
2 Project Orientation
At Cisco, the alignment of commodity level goals and the PCBA-level Six Sigma targets has been identified as a critical link in insuring that Cisco will be able to consistently meet its price, quality, and delivery commitments to customers. Perfect alignment would mean that CEs and SQEs would spend 100% of their effort focused on the components whose improvement would have the greatest impact on meeting the PCBA-level targets. There are two key factors that are needed to determine where this effort should be focused to have the greatest impact.
* Impact of Improvements: Choosing commodity groups where improving the DPPM by a given amount would enable the greatest number of PCBAs to meet their Six Sigma targets.
* Effort Required for Improvement: Choosing commodity groups where a given DPPM improvement can be achieved with the least effort as measured in engineering man-hours.
2.1 Project Objectives
This thesis aspires to develop a methodology linking these two sets of metrics, and provide a framework for making decisions about where component engineering effort can be focused to
make the biggest impact on PCBA-level yields.
The Mixed Integer Program developed in the course of this work uses the bill of materials data
(as broken out by commodity group) for each PCBA to model what impact an improvement in DPPM for a commodity group will have on the number of boards that meet their yield targets. Using this model, it seeks to minimize the amount of effort required to reduce DPPM for each commodity group sufficiently achieve such an improvement.
3
Company Background
3.1 Cisco History
Cisco was founded in 1984 by Len Bosack and Sandy Lerner to connect networks in different buildings at Stanford University. In the past twenty-five years, it has grown to be company of more than sixty-seven thousand employees that earned $39.5B in revenue in fiscal year 2008. This growth has been driven both by organic growth and by acquisition. By leveraging both home-grown and acquired technologies, Cisco has maintained an impressive track record of releasing new and innovative products to market each quarter. These products span all types of networking equipment from a simple IP phone to an incredibly complex core router. Recently, Cisco launched Telepresence, a technology that enables individuals to conduct extremely high quality video conferences with one another - these Telepresence meetings use ultra high definition technology for extremely high quality visuals, use stereo speaker for locational audio, and eliminate the slight delay common to most long distance communication. The incredible variety of this product mix is one of Cisco's great strengths but also presents some significant challenges(2).
3.2 Outsourcing Model
Headquartered in San Jose, California, Cisco recognized that it needed a more flexible manufacturing base in order to support its level of innovation and growth. Cisco follows an outsourced strategy and outsources its manufacturing to 37 factories worldwide(3), partnering with four primary contract manufacturers (CMs). In addition, Cisco has developed relationships with thousands of component suppliers. These relationships cover the entire spectrum of supplier engagement and integration: arms-length purchasing of commodity products requires minimal information; for high-end or more specialized products, close coordination is needed between Cisco and its suppliers to make sure that needs are aligned with product features and that supplier and customer technology roadmaps are aligned.
-opnn
-uple
-,Figure 1: Simplified Diagram of Cisco's Supply Chain
The challenge for Cisco is to manage these various relationships in order to be able to offer products that meet or exceed customer expectations for price, quality, and delivery. This is difficult enough for companies like Toyota who produce incredibly complex machines with thousands of parts. For Cisco, this challenge is an order of magnitude more difficult due to the incredible range of the product mix. Cisco's low-end products are typically 1/50,000 the price of its high-end products, and the expectations regarding the quality of the two products are vastly different. If a latent defect causes one 0.1% of IP phones to stop working after three years, it is a substantial - yet manageable - inconvenience. However, if every core router has a
0.1% chance of failing, it represents represent an incredibly large problem that would impact
millions of end users. As the impact of a potential defective increases, so to does the quality standard that the unit requires. A related challenge caused by this complexity is the enormous range of volumes of items produced. Whereas yearly shipments for a core router may measure in the dozens, tens or hundreds of thousands of IP phones may ship in a given year. These different manufacturing volumes cause additional challenges when collecting yield information.
3.3 Innovation
Cisco's commitment to innovation introduces still more challenges. Because Cisco positions
itself on the cutting edge, it does not have the luxury of using off the shelf products with long field histories. In many cases, key components for important new products are custom designed for Cisco. Though Cisco then puts all products through a rigorous testing and qualification system, there is always some uncertainty about the product performance until there is time to gather sufficient field data.
Cisco's
Customer
3.4 PCBA Manufacture and Component-Related Failures
PCBA manufacture is a critical and highly complicated endeavor and requires design and process expertise, advanced equipment, and highly-skilled employees. A complicated PCBA can be easily consist of tens of thousands of discrete parts all placed and soldered to the underlying PCB. A schematic representation of PCBA manufacture is shown in Figure 2.
*,..der
Pa1t
So3 AcIi
**Ra Sca
o ff Soldcr A0
Soly Sts 00
*PCB boards are *Solder is * Components are *Solder *Solder *Test to of simple *Test of complete
loaded into "squeegied" automaticall y connections are connections are functionality and functionality
automated onto board placed on board made scanned by X- to confirm good
assembly line thorugh a stencil Ray device electric
connections
Figure 2: PCBA Process Flow and Assembly Steps
PCBA boards can fail for several reasons which can be broken into three overarching categories:
connection failures, component defects, and device interaction.
3.4.1 Connection Failures
Physical failures are caused when an improper physical and electronic connection - either a short or an open circuit occurs - between the device and the board or on the board and is often due incorrect placement or a poor solder weld. These problems are detected either at the Automatic X-ray Inspection (AXI) or at In-Circuit Test (ICT) and are usually not caused by any defect inherent in a particular device.
3.4.2 Component Defects
When a component defect is the cause of a failure, it can be caught in either the ICT test or in the Functional test. The ICT test measures the electronic connectivity and some basic functionality of the components on a PCBA. If a component has a gross functional defect, then it may be caught in an ICT test. However, most defects that are a result of component quality are caught one step later, in the functional test. The functional test pushes the assembly to its limits and uncovers latent defects that may have escaped earlier tests.
3.4.3 Device Interactions
The third type of failure occurs when a problem arises from interactions between devices. This is the most difficult type of failure to isolate and diagnose. Even if every device on a PCBA is operating within its specified parameters, there is still a chance that two devices - both operating too near the edge of their specs - will interact in a way that causes the PCBA to fail the functional test. The chances of this type of failure increase dramatically with the number of components on a board.
4
Challenges to Change
-
Three Lens Analysis
2Aligning the goals for various commodity groups with those for PCBAs faces not only substantial technical obstacles, but also significant organizational challenges. Coordinating these metrics is a truly cross-functional challenge that spans multiple organizations and working groups and touches many stakeholders, each with his or her own incentives, motivations, cultural norms, expertise, and thought structure. The following section discusses some of these challenges as viewed through a Three-Lens Analysis.
4.1 Strategic Design
When considering the impact of component quality on manufacturing yields, there are a large number of working groups, organizations, and business units who must be counted as stakeholders. The most central among these are Manufacturing Ops, Component Engineers, Contract Manufacturers, Commodity Managers, Suppliers, and Product Ops. A brief description of each of these groups follows.
4.1.1 Manufacturing Operations (MfgOps)
Manufacturing Ops is responsible for the manufacture and sustaining improvement for all of Cisco's product lines. It is the group primarily responsible for managing the contract manufacturers and for the final quality of the products. Its goals include improved yields, reduced manufacturing defects, and improved quality on products that are already well into their product lifetime. Sub-groups within MfgOps are generally focused on and aligned with one of the four contract manufacturers.
2 A Three Lens Analysis is a technique developed by the faculty at MIT Sloan in order to shed light on some of the
less obvious organizational challenges incurred when introducing or change. The first lens "Strategic Design" looks at the formal structures within an organization (hierarchies and incentives, for example) that shape motivations and actions. The second "Political" focuses on the various informal influences, stakeholders, allegiences, and potential for significant changes in the power or prestige of individuals or groups. The third "Cultural" considers the working patterns, attitude, and other factors that determine the "feel" of a particular group or organization.
4.1.2 Component Engineers (CEs)
Component Engineers are responsible for improving the quality of components purchased from suppliers as is measured by the DPPM of that component when used in production. Component Engineers also qualify and sign off on new suppliers and new components needed for New Product Introduction. CEs are grouped by commodity groups that align with their own personal expertise (such as ASICs, Power Supplies, etc.) A single CE will typically be responsible for components within one commodity group that end up in various Cisco products at all
Contract Manufacturing sites.
4.1.3 Contract Manufacturers (CMs)
Contract manufacturers are responsible for all production and assembly as well as data collection and test for every one of Cisco's products. They are currently compensated by an activity-based costing model and managed by MfgOps to improve yields and reduce lead-times. When there is a problem with a PCBA, one of the common rework practices is to replace one suspected component at the time until the board passes the test, meaning that several components can be replaced before the problem is resolved. Incentives for CMs are designed to encourage high quality and low cost manufacturing, but there is only a secondary emphasis on accurate recording and monitoring of infrequent failure modes. Due to this and other factors, the DPPM data collected for defective components is believed to be pessimistic and may not always reflect the true quality of the underlying components.
4.1.4 Commodity Managers (ComMgrs)
Commodity managers are responsible for the business side of relationships with suppliers. Though in a separate organization (reporting to a separate VP) than the Component Engineers, they are co-located with them in the same physical space, and have similar alignment with particular commodity groups. Like CEs, commodity managers typically work with suppliers from the sourcing decisions associated with new products through the lifespan of a particular component. However rather than dealing directly with technical and defect issues, ComMgrs are focused on price reductions and cost. Though it is widely acknowledged that the Cost of Poor Quality (COPQ) may have a significant impact on the total cost that may offset the gains of
a slightly lower piece price, this Cost of Poor Quality is difficult to quantify and equally difficult to factor into purchasing allocations.
4.1.5 Suppliers
Parts purchased (either by Cisco or one of the CMs) from the suppliers are assembled into Cisco's PCBAs at the CM sites. Though all products purchased from suppliers are referred to as components, the term covers a wide range of complexity. A so-called component can be as simple as an individual resistor, as challenging as a cutting edge ASIC or Microprocessor, even a sub-assembly (which can contain optical devices, ASICs, resistors, capacitors, optical components and dozens of other components as well). Suppliers are motivated to maintain long term relationships with Cisco, and no supplier wants their quality defects to be the cause of a major problem. However, when a problem occurs with a supplier's component on the manufacturing floor even if the CMs collect the defective products for return to the supplier -the problem may remain unresolved if -the supplier is unable to replicate it on -the test bench.
4.1.6 Product Operations (Product Ops)
The Product Ops group is responsible for the product throughout its entire lifetime, from cradle to grave. The most intensive period for the Product Ops group is during the New Product Introduction process, when the Business Unit design organization hands off the product to Manufacturing Ops. Whereas the Manufacturing Ops group is organized by CM, and the CEs and Commodity Managers are organized by Commodity Group, the Product Ops sub-groups are organized by product line. As a result, they become the primary experts on a particular product or product line with secondary expertise for the components that go in it or the manufacturing facility in which it is produced.
4.1.7 Strategic Design - Summary
These different organizations and working groups, with their different alignments, incentives, and expertise present considerable challenges for any change to normal procedures at Cisco. The Six Sigma Yield initiative shifted governance of yields from the Product Ops teams to the Quality Engineers within Manufacturing Ops and overcame substantial organizational resistance
through tireless communication, VP-level support and buy-in, and - eventually - signed contracts from each one of the Directors of Product Ops. Introducing a methodology for extending these yield targets to the commodity level will also require buy-in, executive support, and organizational alignment. The next section will discuss some of the political ramifications of such a change.
4.2 Political
Currently, DPPM values are measured by the CMs, collected by Cisco's internal Quality Data group, and used by Component Engineers to measure performance against goals. These goals are currently established within the Component Engineering group based on historical improvements and perceived industry benchmarks but without a thorough understanding of how much - or if - achieving these goals will have a significant impact on PCBA yields. A methodology that links the Commodity Group goals to the PCBA goals should have the benefit of aligning more closely the work of the group with the best interest of Cisco, but may take away some of the Component Engineers' ability to leverage their expertise to provide input on what goals are reasonable. Furthermore, since much of CE's current work is in "fire-fighting" the latest problem, this methodology would focus their efforts in a more systematic way. This should have benefits for achieving more consistent gains, but will also reduce the opportunities for the "hero effort" or "diving catch" which is still appreciated (even if officially discouraged) at Cisco.
4.3 Cultural
Cisco has a very product-focused culture. Traditionally, Cisco has used its major product releases once per quarter to generate buzz and build brand recognition among corporate clients; however, it has also recently increased its marketing effort to improve brand recognition among consumers. Also, moving to a 100% outsourced model has enabled the culture become even more Product focused (and away from the process focus of a
manufacturing company). This product focus permeates most parts of the organization.
However, Component Engineers are significantly less product facing, and with notable specific exceptions, do not have a clear view of exactly how and what impact incremental component
DPPM improvements have on manufacturing yields throughout the organization. Introducing a methodology to connect these two yields introduces an opportunity to help connect these dots, but also faces challenge of requiring a slightly different mindset among CEs. Furthermore, there is the risk that a CE's laser-like focus on one commodity group enables him or her to use his or her expertise to drive down DPPM, and that any shift towards a product focus would serve as a distraction and undermine this goal.
4.4 Three Lens Summary
The introduction of any new system at a company as large and diverse as Cisco represents a substantial challenge. Even the partial list of major stakeholders above reveals how different the incentives, organizations, and motivations of the various groups are. Furthermore, the political impact of such a change could be substantial, but in this case it is not clear exactly how the change would impact the various formal and informal sources of power. Finally, though it could enable alignment between currently unaligned groups, there is the risk that altering the focus of the CEs would reduce their effectiveness.
5 Literature Review: Linking PCBA Yields to Component DPPM
Various attempts have been made to develop methods to predict the expected yields of PCBAs based on various complexity parameters. One such study, conducted by Li, Mahahan, and Tong, was able to predict the yields of 30 part numbers with a sample size of at least 1000 units per part number. The methods used were a linear regression model and an artificial neural network. The three factors identified as significant by the linear regression were the number of terminations of chip components on the top side of the board, the number of gull-wing leads, and the number of Plastic Leaded Chip Carriers. The results of the ANN method were the same as those found with the linear regression.(4)Helo, Ellis, and Kobza describe another method to link assembly-level yield and the components defects. The method described divides components into several categories based on component size, number of pins, and mounting type, the three of which are proxy measures of the mounting difficulty and the complexity of the components. Using the Poisson approximation for the binomial distribution, they assume that each component type has an
(unknown) fault probability. The optimization algorithm then optimizes the various fault rates such that the absolute value of difference of the measured yields and the predicted yields is minimized. Through this method, for a sample of 30 different boards, the yields were able to be predicted with an average difference of less than 3%.
Modeling the behavior of different components with the binomial method implies that failures of different component groups are independent. In order to check this assumption, the researchers also used the negative binomial yield model based on Stapper's analysis of clusters of faults on ICs. Because the results of this method were did predict the actual yield as well as the Poisson method, the research confirmed that the component failures were, in fact, independent. The authors also were able to reformulate the exponential Poisson estimate into a linear form (by taking the log of each side of the equation) to enable significant improvements in calculation time. (5)
6 Methodology
6.1 Description and Development of Model
The Mixed Integer Program is designed provide a tool to determine how to achieve a designated level of performance while optimally applying engineering effort to do so. Performance is measured by the percentage of boards which will meet or exceed their Six Sigma targets, and this target percentage is one of the inputs to the algorithm. The predicted yield for a board is calculated by modeling the board's fallout rate based on the average DPPM of the commodities used to build the PCBA. This modeled yield is then compared with the Six Sigma target to determine if the board will pass or fail the target. The amount of effort required to improve the DPPM for a particular commodity group is estimated by the historical rates of improvement. Running the optimization is intended to provide guidance for targeting future efforts to yield the greatest improvements in Six Sigma compliance. In other words, which commodity groups should be improved to have the biggest impact on PCBA yields.
6.2 Approach
The first step in developing alignment between Six Sigma targets and Commodity Group goals is to collect data about the current performance of PCBAs and Commodity groups, and the relationship between the two. These data are then used as inputs into the MIP. After running through the optimization algorithm to minimize the objective function while meeting all of the constraints, the MIP outputs values corresponding to the effort required for each commodity group to achieve the desired percentage of passing PCBAs.
6.2.1 Rolled Throughput Yield Model
In order use a MIP as an efficient optimization method, it was necessary to develop a linear approximation to the classic rolled throughput yield equation.3 In the rolled-yield equation the
3 PCBA yield can be modeled as by the rolled throughput yield, where each component is treated as one stage in
the series because in this case, the failure of any component is independent of the failure of any other, and the failure of one component will cause the entire PCBA to be defective.
total probability of fallout is equal to the product of one minus the probability of failure for each component I (pi), raised to a power equal to the number of those components (ni) (6).
Equation I
PCBA Yield = -(1 - )n
In order to calculate the probability of catching x defects, the binomial equation can be used (7). Equation 2 n! x )n-x b [x; n, p] = - x) 1 -x! (n - x)! n n Where Equation 3 S= np
Though this provides an accurate way for modeling yields, it has the undesirable consequence of forcing the optimization equation to be non-linear, substantially complicating the solution process. Given that this methodology needs be able to account for boards numbering in the thousands in order to be applicable to Cisco's product portfolio, a linear formulation is needed in order to enable the calculation to be manageable for a large data set. The following section describes this linearization and draws heavily from the work of Helo et al (5) (8).
6.2.2 Linearization of the Yield Model
The Poisson equation is a valid approximation of the Binomial equation when the true fault probability p is small relative to the number of occurrences (5), (7). The difference in absolute predicted yield between the Binomial distribution and the Poisson approximation is less than 0.0005 (0.05%) for 10 components with 10000 DPPM; the error in the approximation gets smaller as the DPPM decreases. Actual approximation errors are likely to be much smaller because the likelihood of any component having such a high DPPM is exceedingly small. Using the Poisson approximation, the yield for a particular PCBA j can be expressed by the following equation, where nij is the number of components of type i on board j.
Equation 4
PCBA Yield = ei pini
Though this is a step in the right direction it still does not result in an appropriate linear formulation. In order to complete the linearization the logarithm is taken of both sides of the equation, giving:
Equation 5
log(PCBA Yield) = pli
In order to test if the modeled yield of each board meets the Six Sigma target or not, the log of the target is taken as well for each PCBA. The modeled log of the yield is compared to the log of the Six Sigma target to determine whether or not a PCBA meets its target.
6.3 Data Collection
In order to determine where effort would best be applied, the following data is needed.
1. Yield targets for PCBAs. These targets are taken as a given and based on board complexity and Cisco's Six Sigma yield targeting methodology
2. DPPM data for each commodity group. Based on manufacturing fallout rates, historical DPPM data for each commodity group are needed to determine DPPM Slope and the DPPM Current parameters in the MIP.
3. DPPM Benchmarks. Using a combination of industry benchmarks and Cisco expertise, best-in-class DPPM values are needed to establish the minimum conceivable DPPM levels for each commodity group.
4. Usage Data. The bill of materials (BOM) of each PCBA contains components from several different commodity groups. This information is critical for modeling how an improvement in the DPPM of a particular commodity group will impact board-level yields.
The collection of the critical data outlined above is discussed in more detail in the following sections.
6.3.1 PCBA Yield Targets
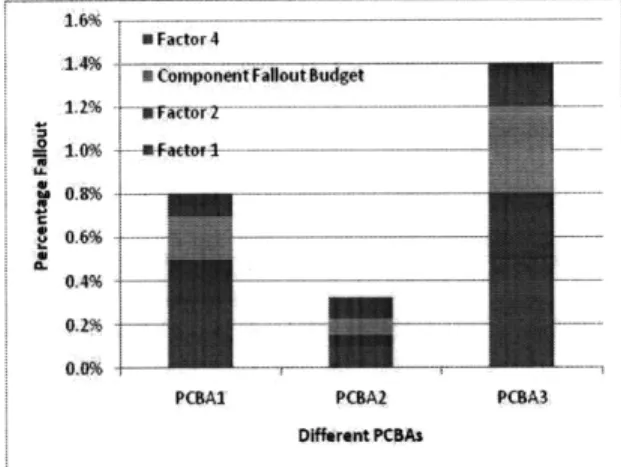
PCBA Yield targets are established based on Cisco's Six Sigma method. Using factors that represent the complexity of a given board, this method assigns a particular yield target for each PCBA made by Cisco's contract manufacturers. Because board fallout can be caused by several factors, one of which is component defects, the entire fallout target is allocated between each of these factors, with only a portion given to components. In other words, the yield target for only component-related failures is higher than the yield target for the overall boards (which includes both related and other failure modes). As shown in Figure 3, component-related fallout is only one of the factors used to calculate the Six Sigma fallout targets.
St Factor 4
StCoponntFall out Budet
....
. .... ... . . ... ... ...
0496 _-111~.1 .-- 1.. --- - 11_
PCBAI PCBAZ PCBA3
Figure 3: Example of the Contributions of Different Factors to Six Sigma Targets
For the purposes of this analysis, only the component portion of the overall Six Sigma target is relevant.
Percent Deviation
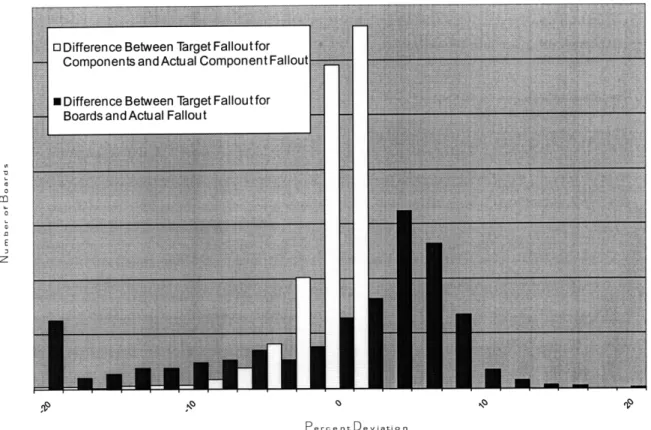
Figure 4 a histogram of PCBA shows the performance vs. Six Sigma targets. The darker colored columns represent the distribution of PCBA yield with respect to their overall Six Sigma targets. The lighter columns represent the distribution PCBA yield due to component-caused fallout with respect to the component portion of the Six Sigma targets. The boards represented by the columns to the right of the graph are passing their the Six Sigma targets, while those to the left
Percent Deviation
Figure 4: Performance vs. Six Sigma Target
As is clear from Figure 4, there are many boards which still do not meet their overall Six Sigma
targets, and even more that miss their component budget for those targets. Component quality issues still cause a large fraction of boards to not meet their Six Sigma targets. However,
it is not clear which commodity groups are responsible for pushing more of the boards below the targets.
6.3.2 DPPM Historical Data
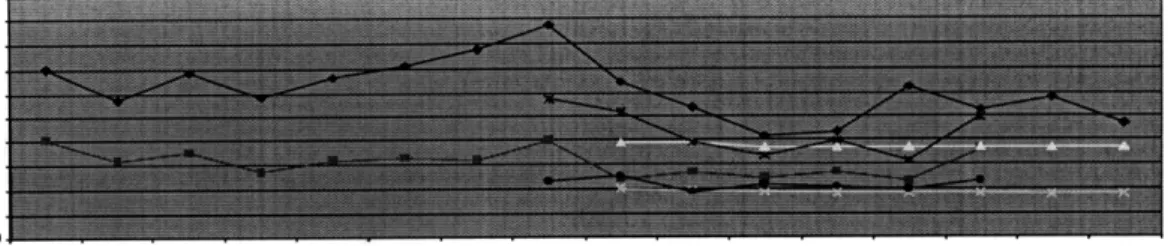
Currently, DPPM goal setting occurs by looking at historical improvements of each commodity group and setting future targets accordingly. This process has led to progressively better DPPM performance for commodity groups. This progress that has not always been matched by PCBA yield improvements.
QIFY05 Q2FY05 Q03FY05 04FY5 01FYOS 02FY6 Q03FYOB Q4FYOS QiFY07 Q2FY07 Q3FY07 Q4FY07 Q1 FYOB Q2 FY08 Feb Mar FYOB FYOB
Q1FY05 Q2FYO5 03FY05 04FY05 Q1FY06 Q2FY06 Q3FY06 Q4FYO QIFY07 Q2FY07 Q3FY07 Q4 FY7 Q1 FY08 02 FY8 Feb FYO Mar FYOB
Figure 5: Historical DPPM for Representative Commodity Groups
In addition to the DPPM Slope information derived from this historical data, it was also necessary to assess the current DPPM rates for each commodity group, this information is read off as the most recent data point for each commodity group.
6.3.3 DPPM Benchmarks
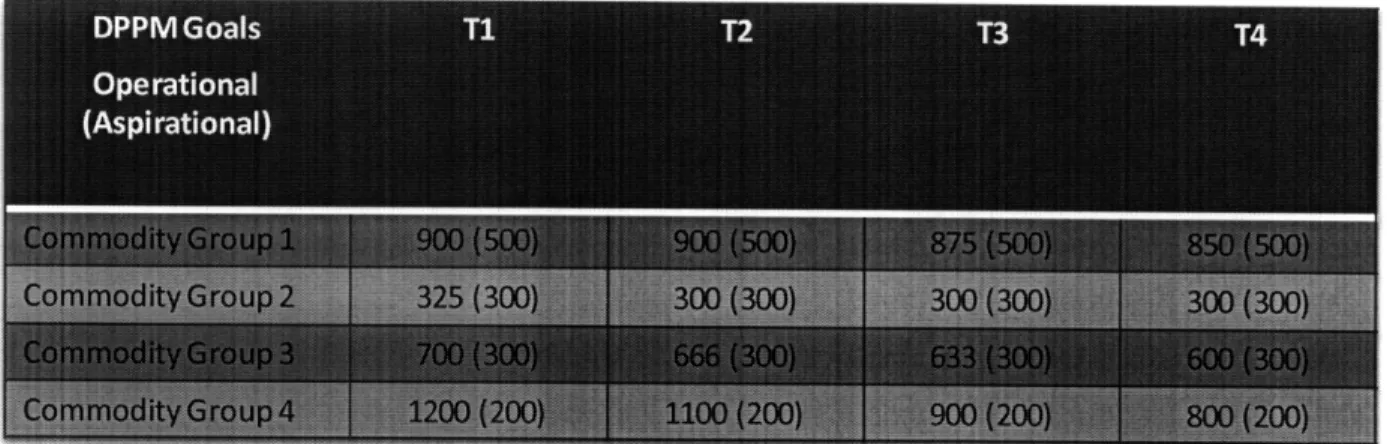
The DPPM benchmarks are derived from a combination of industry knowledge and benchmarks provided by external consultants during a recent study. The values are typically well below the average values for DPPM currently measured by Cisco, and are taken to represent "best in class" performance, and classified as "aspirational" targets within Cisco. The Operational targets are updated on either a quarterly or monthly schedule as DPPM performance improves.
Figure 6 shows historic and current operational targets, as well as the "aspirational" industry benchmarks.
Figure 6: Operational and Aspirational Targets for DPPM in Commodity Groups
6.3.4 Usage Data
Each PCBA is assigned an assembly part number and each contains a printed circuit board (PCB) with anywhere to a few dozen to tens of thousands of components on the board, which fall into
different commodity groups. Commodity groups are used for component engineering, but when pulling BOM information, the components are classified differently, by "Commodity Codes." Because the components are classified differently for BOM data than they are for commodity management, it is necessary to create a mapping between the two taxonomies. Such a mapping is shown in Figure 7.
BOM Part Numbers
ssive + Optics Active
rk
oqic Devices + Linear Devices + DataCOMM + DRA
Y .100ASIC 101 nla Capacitors 104 Resistor 106 RC Netwo Crystals 10 SRAM + L aDataCOMM at!N 110 -random ? E PR - 112 Transistor
FLAS 113 Fuses and
LED s 114 Switches
Linear Devices 115 Relays
Logic.Devices 116Transform
"gDvs 117 LED
icr ssors 119 Connector
.cs
Active 120 PCB Fab
Optics Passe 11 onnto
Oscilia 122 Modules: 123 Wires, Ca PCB Fabs -124 Lug Sp 125 Fans Resistors 126 Poer Su S RF 127Power Sup SRAM " 128Batteries 130 Batteries
Figure 7: Decoder Ring between BOM-designated Component Groupings and Commodity Group Classifications
With these two sets of data reconciled it is possible to create a Commodity Group-based BOM for each board, showing how many components from each commodity group are used in each
PCBA. A partial list of this information is shown in Figure 8.
Commodity Comodity Commodity Commodity Commodity
Group 1 Group 2 Group 3 Group 4 Group 5
PCBA1 8 0 0 26 4 PCBA2 4 0 2 12 4 PCBA3 8 0 0 26 4 PCBA4 8 0 0 26 4 PCBA5 4 0 6 10 2 PCBA6 0 0 0 27 18 PCBA7 7 0 12 16 2 PCBA8 4 0 14 0 8 PCBA9 4 0 0 6 12 PCBA10 4 2 6 8 2 PCBA11 8 0 7 16 2 PCBA12 8 0 7 16 2 PCBA13 8 0 7 16 2 PCBA14 8 0 7 16 2 PCBA15 14 2 0 14 0
f m dirntr ritu sla
PLD+ FLASH
:PLD +FLAS'H
)sciliator
Fuse holders
er/lnductor
Optical Power converters, etc bles
pplies/Converters
plies
terials
Figure 8: Usage information
6.4 Key Assumptions
Several simplifying assumptions have been made in order to make the optimization algorithm feasible.
6.4.1 Key Assumption 1
-
Components within commodity groups perform
similarly
The first and most significant assumption is that the mean is a good approximation for the performance of an entire commodity group. This assumption works reasonably well for some groups, but is a significant limitation for groups with a large and skewed distribution of DPPM, most notably in ASICs. As shown in Figure 9, ASICS are heterogeneous enough that none cluster into a normal distribution, and the mean is not a good representation of the
performance of the group.
70 - 120% 60 100% 50 80% 40 -... 60% " S0% DPPM
Figure 9: Distribution of DPPM over different ASIC Part Numbers
This limitations imposed by this assumption also highlight the inadequacy of the current method of setting commodity level goals, which are set by comparing the weighted average DPPM of the commodity group to a target.
6.4.2 Key Assumption 2 - Improvement is proportional to effort
The second key assumption is that past improvement of DPPM is a good means of characterizing likely future improvement. Furthermore, it is assumed that if historic improvement can be achieved with the current amount of effort (in terms of engineering hours, etc.) then proportionally more improvement can be achieved by increasing the intensity of the effort. -4- Commodity Group 1 -- CommodityGroup2 - Linear(Commodity Group 1) - Linear(CommodityGroup2) 1 1.2 1.4 1.6 1.8 2 2.2 2.4 Elre o., Tm.
Figure 10: Graph of DPPM Improvement vs. Normalized Engineering Effort
Though proportionality may not prove true for every case, it also captures the current way commodity-level goals are set, namely by using historic trends in DPPM data to extrapolate goals for each successive quarter.
6.4.3 Key Assumption 3 - Faults occur Independently
Though it expected that defects occur within a particular commodity group as predicted by the Poisson approximation to the binomial equation, it assumed that the defects that occur within one group happen independently from defects which may occur in another group. There are faults caused by the interaction between two different components that are not independent. These types of defects are assumed to occur relatively infrequently and are outside of the scope of this thesis.
6.5 Mixed Integer Programming Optimization
The mixed integer optimization will converge to a solution by selecting decision variables that minimize the optimizing function subject to the pre-defined constraints. In the following sections, the various parameters which characterize the nature of the optimization are defined and explained. This is followed by a description of the decision variables, and the decision expressions - expressions that are based on the values of the decision variables. The objective function is described next with a discussion of how minimizing the engineering effort is achieved. Finally, the constraints to the optimization are defined. These constraints model
both practical, real-world constraints - such as keeping DPPM within an acceptable range- and constraints that increase usefulness of the model - such as the constraint that more than the predetermined percentage of boards must pass their Six Sigma targets.
6.6 Parameters
The following section describes all of the inputs used in the optimization algorithm.
6.6.1 PCBA Boards
The PCBA board is treated as the final product for the purpose of this thesis, and final yield is measured at the board or assembly level. Each board consists of a unique bill of materials
(BOM) that consists of anywhere from zero to hundreds of components from each commodity group.
In production, boards are measured in functional tests to determine if they will pass or fail. The functional yield rate (passing boards/tested boards) is required to meet a target specified by the Six Sigma analysis described above. In the model, each board is indexed by
Equation 6
b = 1...m to represent each PCB Assembly
6.6.2 Commodity Groups
Each PCBA is made up of a PCB and components from each of several commodity groups. The commodity groups shown in Figure 7 are indexed in the model by
Equation 7
c = 1...n to represent each Commodity Group {ASIC, Capacitors, ...}
6.6.3 Usage Data
The usage data is a representation of the number of components from each commodity group that appear on each board. It is a 2x2 matrix with a number of rows equal to the number of boards, and a number of columns equal to the number of commodity groups. It is represented in the model as
Equation 8
Ubc = number of components of commodity group c, used on PCBA b
6.6.4 Six Sigma Yield Target
The Six Sigma Yield Target is defined as the target yield for each board when only taking into account fallout that can occur due to defective components. This input for each board b based on the Six Sigma yield methodology defined in the internal Cisco process. This methodology first specifies a target component-based DPU for each board based on its components, and the
Six Sigma Yield Target (Sb) is calculated from that as below.
Equation 9
Sb - e-DPUb
6.6.5 DPPM Current
DPPM Current is inputted for each commodity group c and represents the most recent average DPPM performance for that commodity group. This is represented in the model by the variable DC.
Equation 10
DCc = the average current DPPM for a particular commodity group c
6.6.6 DPPM Slope
DPPM Slope is a parameter inputted for each commodity group and is used to represent the baseline rate of improvement of DPPM for that particular group. Typically this number is based on a straight-line linear regression of the historical rate of improvement over the past several
quarters (see Figure 5: Historical DPPM for Representative Commodity Groups), but for some very low DPPM parts that do not yet have the infrastructure in place to measure and report DPPM these numbers had to be estimated. It is represented in the model as DS.
Equation 11
DSc = the rate of improvement of DPPM for commodity group c
6.6.7 DPPM Min
There are practical limits to how much DPPM improvement can be estimated with a linear regression. For example, no matter how much effort is expended, DPPM cannot be negative. In order to prevent such impossibilities, as well as to incorporate some of the expertise that Cisco component engineers hold regarding DPPM, a Minimum DPPM is inputted for each commodity group that corresponds with the industry benchmarking for the best in class. It is represented in the model as DM.
Equation 12
DMc = the minimum threshold value for a commodity group c
6.6.8 Percent Pass Threshold
The Percent Pass Threshold is a user-defined percentage that corresponds with the number of boards that must pass the Six Sigma Yield targets. As PCBA yield performance improves, this value can be ratcheted up to find new opportunities for efficiently improving yields. However, too high a threshold can force a solution to be infeasible. The percent pass threshold is equal to the percentage of boards that must comply with the Six Sigma targets, therefore it is alternatively referred to as the Six Sigma Compliance rate.
Equation 13
PPT = the required rate of compliance to Six Sigma Targets
6.6.9 Summary of Parameters
Variable Equation/Source Comment Equation 6 b 1...n to represent each Index
PCBA
Equation 7 c 1...m to represent each Index
Equation 8 Ubc Number of components Derived from BOM data of Commodity group c
used on PCBA b
n/a DPUb Target for Defects per Based on the component makeup Unit for each PCBA board of a board, as defined by Cisco Six
b. Sigma methodology Equation 9 Sb e- DPUb Based on Cisco Six Sigma
methodology
Equation 10 DSc The most recent average Data based on recent DPPM data for a manufacturing data commodity group
Equation 11 DSc The rate of improvement Derived from linear regression of of DPPM for a historical DPPM improvement commodity group
Equation 12 DMc The minimum threshold Defined by industry benchmarks value for the commodity and opinions of available SMEs
group
Equation 13 PPT The required rate of A user inputted value that can be compliance to the Six ratcheted up as component quality
Sigma Target improves
Table 1: Summary of Parameters
6.7 Decision Variables
6.7.1 DPPM Effort
The model is formulated such that the decision variables correspond to the amount of effort spent to improve DPPM for a particular Commodity Group. When the model is run, this value minimized to enable the prescribed fraction of PCBAs to reach their Six Sigma targets with a minimal investment of engineering effort. This is represented by the decision variable X,
Equation 14
Xc = the effort expended to improve DPPM in commodity group c
Inherent in this parameter is the assumption that engineering effort currently applied in one commodity group (e.g. ASICs) can be transferred to another commodity group (e.g. Microprocessors) if that would result in better overall PCBA yields. Because each commodity group requires a specialized set skills and experience, major shifts in effort or focus are only appropriate for longer-term planning and staffing.
6.7.2 Binary Variable -Pass Six Sigma Target
The second key decision variable is the binary variable associated with each of the PCBAs that indicates whether the board must pass its Six Sigma target or not. This variable is set equal to 1
if it is required to pass and 0 if it is not. It is represented for each board by the variable PSb
Equation 15 PSb 1 if Board b is required to pass Six Sigma Target}
0 if board is not required to pass I
The constraints section contains a more complete discussion of how this binary variable must be equal to 1 for enough boards so that the percentage that are modeled to pass their Six Sigma targets is greater than or equal to the target percentage.
6.7.3 Summary of Decision Variables
Variable Equation/Source Comment
Equation Xb The amount of effort chosen to
14 improve DPPM for a commodity group
Equation 7 PSb 1 if board is required to pass Binary DV to ensure that
0 if board is not required to pass there are enough boards that meet the Six Sigma
targets
Table 2: Summary of Decision Variables
6.8 Decision Expressions
In order to simplify equations and improve model readability, several intermediate Decision Expressions have been created that are based on the values of the Decision variables.
6.8.1 Total DPPM Effort
The total DPPM effort is equal to the sum of the effort expended to improve DPPM on each commodity group c. It is this effort that the objective function seeks to minimize while satisfying the constraints of the optimization. This expression is represented as TE
Equation 16
TE =YXc
C
6.8.2 Percent Pass
Percent pass (PP) is the percentage of boards that are modeled to pass their Six Sigma Targets, it is derived by dividing the number of passing boards (PB) by the total number of boards analyzed (TB).
Equation 17
PB PP =
TB
6.8.2.1 Count Passing Boards
The number of passing boards is calculated by summing the binary variable Pass Six Sigma Target (PS) over the all boards (b).
Equation 18
PB = PSb
b
6.8.2.2 Count Total Boards
This is total number of boards analyzed (m).
Equation 19
TB = m
6.8.3 DPPM Improvement and Used DPPM
Used DPPM is a key decision expression used to represent what DPPM value is achievable for each commodity group given an expenditure of effort to improve DPPM. If the DPPM Effort is equal to zero, then the Used DPPM will remain equal to the DPPM Current. If the DPPM effort is equal to one, then the DPPM will be modeled to continue to improve at the historic pace. A doubling of the DPPM Effort (i.e. DPPM Effort = 2) corresponds to a doubling of the pace of
improvement. DPPM improvement is defined as the product of DPPM Effort (X) and DPPM Slope (DS). It is represented as DI.
Equation 20
DIc = Xc * DSc
The Used DPPM is represented as DU, and is the value of DPPM that is used in the model to predict the modeled fallout rate for the PCBAs.
Equation 21
DUc = DCc + DIc
6.8.4 Modeled DPU
The Modeled DPU is based on the Used DPPM and the Usage for each board. It is represented as the summation of the product of the number of defects expected for each Commodity Group, and the number of Devices from Each group on each board. It is represented as MDPU.
Equation 22 DUc
MDPUb = 106* Ubc
C
6.8.5 Six Sigma Target Minus Modeled DPU
The decision expression Six Sigma Target Minus Modeled DPU represents the difference between the Six Sigma target for DPU and the Modeled DPU described above. Recall from the above discussion that the Six Sigma DPU is an inputted parameter and a fixed value, and the Modeled DPU for each board constantly changes as the optimization seeks the optimal solution. Six Sigma Target Minus Modeled DPU is positive for a given board when that board is
"good" and passes the Six Sigma Target, and is negative when a given board is "bad" and fails the Six Sigma Target. It is represented in the model as TMM (target minus model)
Equation 23
TMMb = DPUb - MDPUb
6.8.6 Summary of Decision Expressions
Equation 16 TE Xc The total amount of effort expended to
C
improve DPPM for all commodity groups
Equation 17 PP PB The percentage of
TB boards modeled to pass their Six Sigma Targets
Equation 18 PB PSb The number of boards
b that are modeled to pass
Equation 19 TB m Total number of boards
being analyzed
Equation 20 DIc Xc * DSc Improvement in DPPM based on the historic rate of improvement and the effort chosen
Equation 21 DUc DCc + DIc New DPPM value based on improvement and recent value
Equation 22 MDPUb -' DUc Modeled PCBA fallout
106 * Ub rate based on usage and
_ used DPPM
Equation 23 TMMb DPUb - MDPUb Gap between modeled PCBA fallout and target fallout
Table 3: Summary of Decision Expressions
6.9 Objective Function
The objective of this optimization algorithm is to enable a defined percentage of PCBAs to meet their Six Sigma Targets by allocating engineering effort in an efficient and targeted way to be focused on the particular commodity groups where it is likely to have the greatest impact. In order to make sure that effort is not wasted and employed to either (1) improve yields to the point where they no longer help to meet the established targets or (2) work on commodity groups that are not having a major negative impact on yields, the objective function seeks to minimize the decision expression representing the Total DPPM effort (as defined above).
Equation 24
6.10 Constraints
While adjusting the decision variables to minimize the DPPM effort, the algorithm is subject to the following constraints
6.10.1 DPPM May not Fall below Min DPPM
Though a linear approximation is assumed to be a reasonable estimate of the improvement of DPPM within the current regime, there are also practical or other limits where this assumption no longer holds. Used DPPM is constrained to be greater than or equal to the Minimum DPPM
- defined above - for all commodity groups c.
Equation 25
Vc: DUc 2 DMc
6.10.2 Passing Boards
This critical constraint assures that enough boards are passing the Six Sigma target. There are two possibilities, when the binary variable PS is equal to 1, and the board must pass; when the binary variable is equal to 0, and the board may or may not pass the target. Each case will be taken separately, but either case is represented by the equation below. The large multiplier guarantees that any board that is even slightly passing can be accounted for by the binary decision variable 1, whereas any board that is failing will be represented by the binary decision variable 0.
Equation 26
Vb: TMMb 2 [PSb - 1] * 109
6.10.2.1 Binary Variable = 1
When the binary variable is equal to 1, the right hand side of the equation above is equal to 0, meaning that Six Sigma target Minus Modeled DPU must be greater than or equal to 0. Recall from the discussion of this decision expression above that when PS is greater than 0, it represents a passing board.