A concept for stimulated proton transfer in
1-(phenyldiazenyl)naphthalen-2-ols
S. Hristova
a, V. Deneva
a, M. Pittelkow
b, A. Crochet
c, F.S. Kamounah
b, K.M. Fromm
c,
P.E. Hansen
d, L. Antonov
a,∗aInstitute of Organic Chemistry with Centre of Phytochemistry, Bulgarian Academy of Sciences, Acad. G. Bonchev str., bl. 9, 1113 Sofia, Bulgaria
bUniversity of Copenhagen, Department of Chemistry, Universitetsparken 5, DK-2100 Copenhagen, Denmark
cUniversity of Fribourg, Department of Chemistry, Chemin du Musée 9, CH-1700 Fribourg, Switzerland
dRoskilde University, Department of Science and Environment, Roskilde, DK-4000, Denmark
A R T I C L E I N F O Keywords: Tautomerism Molecular switches Molecular spectroscopy Azo dyes A B S T R A C T
A series of aryl azo derivatives of naphthols (1–3) were studied by means of UV–Vis and NMR spectroscopy in different solvents as well as by quantum chemical calculations and X-ray analysis. Previous studies have shown that Sudan I (1) exists as a tautomeric mixture. The effect of the solvents is minimized by the existing in-tramolecular hydrogen bond. Therefore, the influence on the tautomeric state in structurally modified 1 has been investigated. Structure2 contains an additional OH-group, which deprotonates easily and affects the position of the tautomeric equilibrium by changing the electronic properties of the substituent. The implementation of a sidearm in3 creates a condition for competition between the nitrogen from the azo group and from the pi-peridine unit for the tautomeric proton. In this case the use of acid as a stimulus for controlling the tautomeric process was achieved.
1. Introduction
Aromatic azo derivatives are one of the largest and the most im-portant classes of colorants. Their practical and theoretical importance has been reflected in textiles, food, paper printing, nonlinear optical (NLO) devices and liquid crystalline displays (LCDs) [1]. Most of the azodyes are tautomeric ones, and therefore the study of their tauto-merism is of practical and fundamental significance. Moreover, some structurally modified tautomeric azonaphthols are recently considered as a promising prototype compounds for the development of new sys-tems, exploiting controlled proton transfer for signal conversion and for use in molecular electronics [2]. This can be achieved by implementing an antenna - host (crown ethers or similar macrocyclic receptors), which transfers the signal from external stimuli to the tautomeric backbone [3,4]. In such a way, the change in the tautomeric state re-sults from appearance/disappearance of the external stimuli. The sen-sitivity of the electronic ground and excited states of the tautomeric forms to the environment stimuli (light, pH, T, solvents), and to the presence of a variety of substituents or hydrogen bonding motifs are used as tools to tune the expected action. Our previous studies on 4-(phenyldiazenyl)naphthalen-1-ol derivatives, in which a side moiety is connected to a tautomeric unit [4], showed that, when the tautomeric
proton becomes part of a stabilizing, intramolecular hydrogen-bonding system, a full shift of the tautomeric equilibrium to the enol form is achieved. In such compounds controlled shift in the position of the tautomeric equilibrium can be accomplished through protonation/de-protonation or complexation. In these systems, the tautomeric proton is transferred through a long distance, which makes it very sensitive to the solvent used. Therefore, it is interesting to see how the antenna could behave, when the proton exchanges through intramolecular hydrogen bonds within the tautomeric unit.
Sudan I (1-(phenyldiazenyl)naphthalen-2-ol), the most intensively used azo dye [5,6], is a typical example for the effect of the
in-tramolecular hydrogen bonding on the proton transfer. Previous studies have shown that Sudan I (1) always exists as a tautomeric mixture in solution [7,8]. Having in mind that the specific effects of the solvents
are minimized by the existing intramolecular hydrogen bond, the sol-vent polarity plays an important role - in non-polar solsol-vents such as i-octane and tetrachloromethane 1a (enol, azo) form predominates, while in more polar solvents (like methanol) the opposite effect is ob-served and form1b (keto-hydrazo) prevails (Scheme 1).
The aim of this study is to investigate how structural modifications in1 can influence its tautomerism. Structure 2 contains an additional OH-group which is expected to deprotonate easily and to affect the
∗Corresponding author.
E-mail address:[email protected](L. Antonov).
http://doc.rero.ch
Published in "Dyes and Pigments 156 (): 91–99, 2018"
which should be cited to refer to this work.
position of the tautomeric equilibrium by changing the electronic properties of the substituent (from OH to O−). The implementation of a sidearm in the newly synthesized compound3 creates conditions for a competition between the nitrogen atom from the azo group and the nitrogen atom from the piperidine unit (3a vs. 3a,Scheme 2) for the tautomeric proton. The overall idea is to investigate if these modi fica-tions could provide possibilities for controlling the tautomeric equili-brium in the backbone of1 in solution. The investigations were per-formed by using UV-Vis and NMR spectroscopy in various solvents, quantum-chemical calculations and crystallographic analysis.
2. Experimental part
Compounds. 3-Hydroxy-2-naphthoic acid A and 2,6-dihydrox-ynapthalene were purchased from TCI research chemicals. All other reagents and solvents were analytical grades purchased from Sigma-Aldrich Chemical Co. and used as received unless otherwise stated. Fluka silica gel/TLC-cards 60778 withfluorescence indicator 254 nm were used for TLC chromatography. Merck silica gel 60 (0.040–0.063 mm) was used for flash chromatography purification of the products. The HRMS LC/MS experiments were carried out on a Bruker MicrOTOF-QII-system with ESI-source with nebulizer 1.2 bar,
dry gas 8.0 l/min, dry temperature 200 °C, capillary 4500 V and end plate offset −500 V.
2.1. Synthesis
2.1.1. 1-(Phenyldiazenyl)naphthalen-2-ol1
A solution containing of aniline (0.93 g, 10 mmol) and concentrated HCl (5.0 ml) in distilled water (25.0 ml) was stirred at 0–5 °C for 30 min. To this solution was added slowly a cold solution of sodium nitrite (0.83 g, 12 mmol) in distilled water (10.0 ml) and the mixture left stirred at 0–5 °C for 45 min. The diazonium salt solution was then added dropwise with vigorous stirring over 25 min to a solution of 2-naphthol (1.5 g, 10.05 mmol), sodium hydroxide (0.8 g, 20 mmol) in distilled water (50.0 ml) maintained at 0–5 °C. After complete addition, the mixture stirred in cold for 45 min and 1 h at room temperature, and then acidified with 6 M HCl to pH 2–3. The red precipitate was collected and washed with water until neutral. The solid was dried in vacuum at room temperature and recrystallized three times from absolute ethanol (15 ml) to give red needles (1.96 g, 76%). The NMR data are consistent with that reported in literature [9]. HRMS-ESI calculated for C16H13N2O (M + H)+249.10279, found 249.10252.
2.1.2. 1-(Phenyldiazenyl)naphthalen-2,6-diol2
A solution containing aniline (1.02 g, 11 mmol) and concentrated HCl (3.25 ml) in distilled water (5.0 ml) was stirred at 0–5 °C for 30 min. To this solution was added slowly an ice-cold solution of so-dium nitrite (0.77 g, 11 mmol) in distilled water (5.0 ml) and the mix-ture left stirred at 0–5 °C for 45 min. The diazonium salt solution was then added dropwise with vigorous stirring over 30 min to a solution of 2,6-dihydroxynaphthalene (1.76 g, 11 mmol) in 10% aqueous sodium hydroxide (9.15 ml)) maintained at 0–5 °C. After complete addition, the mixture stirred in the cold for 45 min and then 1 h at room temperature. The red precipitate was treated with distilled water (50.0 ml) and fil-tered, the solid washed with water until neutral and the red solid re-sidue dried in vacuum at room temperature. The crude product was purified by flash column chromatography on silica gel with di-chloromethane/ethyl acetate (10:1) and recrystallization from 75% aqueous ethanol (12 ml) to obtain2 as a dark-red solid (0.89 g, 31%) as a dark-red solid.1H NMR (DMSO‑d6, 400 MHz)δ 15.59 (s, XH), 9.77 (bs, O6), 8.36 (d, 8, J = 8.8 Hz), 7.81 (d, 4, J = 9.6), 7.80 (d, H-2´.H-6′, J = 7.7), 7.52 (“t”, H-3′,H-5′, J = 7.7 and J = 8.1 Hz), 7.33 (t, H-4′, J = 7.3 Hz), 7.10 (d,d, H-7, J = 2.5 and J = 8.8 Hz), 7.08 (d, H-5, J = 2.4 Hz), 6.82 (d, H-3, J = 9.4 Hz). 13C NMR data are given in
Table 1. HRMS-ESI calculated for C16H13N2O2 (M+H)+ 265.09770, found 265.09783.
Compound3 was synthesized in three steps starting with 3-hydroxy-2-naphthoic acidA as shown inScheme 4.
2.1.3. Step 1: 3-Hydroxy-2-naphthoic acid-N-piperidinylamideB A solution of 3-hydroxy-2-naphthoic acid (6.18 g, 32 mmol) in dry dichloromethane (250 ml) was treated with 8 drops of dry DMF fol-lowed by slow addition of oxalyl chloride (8.6 ml, 98.4 mmol). The reaction mixture was stirred at 25 °C under nitrogen atmosphere for 24 h. The solvent was evaporated under reduced pressure and the crude solid residue was diluted with dry dichloromethane (75 ml) and dry THF (75 ml) and the solution was stirred at 0 °C for 20 min under a nitrogen atmosphere. A 2 M solution of piperidine in THF (49.2 ml) was added dropwise and the heterogeneous mixture left stirred at 25 °C under nitrogen atmosphere for 72 h. The white solid wasfiltered and thefiltrate evaporated under reduced pressure to afford a crude amber solid. This was purified by flash column chromatography on silica gel with dichloromethane/ethyl acetate (10:1) to obtain the amide com-poundB as a white solid (6.2 g, 74%). The1H NMR (CDCl
3, 500 MHz) data are consistent with that reported in literature [10] 13C NMR ((CDCl3, 126 HMz)δ 170.2 (CO), 154.6 (C-3) 135.9 (C-4a), 128.7 C-5 or C-8), 128.5 (C-5 or C-8), 128.0 (C-4a) 127.0 (C-6 or C-7), 124.1 (C-6 or Scheme 1. Tautomeric equilibrium in 1 and structures of the investigated
compounds2 and 3.
Scheme 2. Possible equilibria in 3.
C-7), 120.4 (C-2), 112.3 (C-4), 47.22, 41.76, 26.3, 24.7. HRMS-ESI calculated for C16H18NO2(M + H)+256.09770, found 256.09762.
2.1.4. Step 2: 3-(1-Piperidinylmethyl)naphthalen-2-olC
A solution of the amideB (1.84 g, 7.2 mmol) in dry THF (35 ml) was added dropwise under nitrogen atmosphere to a suspension of LiAlH4 (0.56 g, 14.7 mmol) in dry THF at 0 °C with vigorous stirring. After complete addition, the mixture stirred at 25 °C for 15 min and then refluxed under nitrogen atmosphere for 2 h. Cooled to 0 °C and quen-ched with saturated aqueous potassiumfluoride solution (20 ml). The product was then extracted with dichloromethane (3 × 50 ml), washed with brine and dried over anhydrous magnesium sulphate. Filtration and subsequent evaporation of solvent under reduced pressure afforded a solid residue, that was purified by flash column chromatography on silica gel with dichloromethane/n-heptane (2:1) and finally with di-chloromethane to obtain compoundC as a white solid (1.4 g, 82%).1H NMR (CDCl3, 500 MHz)δ 11.23 (broad s, 1H), 7.57–7.55 (m, 2H), 7.37 (d, 1H, J = 8.2 Hz), 7.26 (t, 1H, J = 7.4 Hz), 7.15 (t, 1H, J = 7.4 Hz), 7.07 (s, 1H), 3.73 (s, -CH2), 2.45 (s, H-2′, H-6′), 1.55 (s, H-3′, H-5′), 1.40 (s, H-4′).13C NMR (CDCl 3, 126 MHz)δ 156.3 (C-2), 134.6 (C-8a), 128.1 (C-4a), 127.8 (C-8), 127.4 (C-5), 126.3 (C-7), 126.1,124.6 (C-3), 123.1 (C-6), 110.4 (C-1), 62.4 (CH2), 54.0 (C-2′), 25.9 (C-3′), 24.1 (C-4′). HRMS-ESI calculated for C16H20NO (M + H)+ 242.15449, found 242.15435.
2.1.5. Step 3: 1-(Phenyldiazenyl)-3-(1-piperidinylmethyl)naphthalen-2-ol 3
A solution containing of aniline (0.28 g, 3.0 mmol) and con-centrated HCl (3.0 ml) in distilled water (50.0 ml) was stirred at 0–5 °C for 45 min. To this solution a cold solution of sodium nitrite (1.02 g, 14.5 mmol) in distilled water (5.0 ml) was added slowly and the mix-ture was left stirring at 0–5 °C for 45 min. The diazonium salt solution was added dropwise with vigorous stirring over 30 min to a solution of compound C (0.24 g, 1.0 mmol) in 0.2 M aqueous sodium hydroxide (10.0 ml) and THF (10 ml) maintained at 0–5 °C. After completion of the addition the mixture was stirred in the cold for 45 min and subse-quently 30 min at room temperature and the red-orange solid was fil-tered off. The filtrate was neutralized to pH 7 and extracted with di-chloromethane (3 × 30 ml), then washed with water andfinally dried over anhydrous sulphate and evaporated under reduced pressure. The solid residue was purified by flash column chromatography on silica gel,first with dichloromethane and then with dichloromethane/ethyl acetate (10:2) and finally with dichloromethane/methanol (95:5) to obtain the pure compound3 as an orange solid (0.22 g, 58%).1H NMR (CDCl3, 500 MHz) δ 16.64 (s, OH), 8.47 (d, H-8, J = 8.2 Hz), 8.25 (broad s, H-4), 7.69 (d, H-5, J = 7.6 Hz), 7.67 (dd, H-2′, H-6′, J = 8.5 Hz, J = 2.0 Hz), 7.55 (“t”, d H-7, J = 8.4 Hz and J = 1.2 Hz), 7.48 (“t”, H-3′ and H-5, J = 8.3 Hz), 7.42 (t,d, H-6, J = 7.3 Hz and Table 1 13
C chemical shifts of compounds1–3. The numbering is shown inScheme 3.
Carbon/Compounds 1aCDCl
3 1 DMSO‑d6 2 Acetonitril-d3 2 DMSO‑d6 3bCDCl3 3eDMSO‑d6
C-1 129.67 129.17 130.20 129.26 129.95 129.58 C-2 171.56 168.77 169.74 169.97 174.80 173.40 C-3 124.48 123.89 125.20 124.54 mc mc C-4 139.64 139.92 139.66 140.00 144.09 brd mc C-4a 127.71 127.80 127.32 129.68 127.49 126.92 C-5 128.27 129.07 112.81 112.48 129.71 128.99 C-6 125.35 125.81 155.78 155.83 126.43 126.32 C-7 128.48 128.87 119.26 119.05 129.90 129.27 C-8 121.44 121.28 123.95 123.13 121.61 121.20 C-8a 133.26 132.73 mc 125.35 133.84 132.98 C-1′ 144.44 145.08 146.23 144.73 143.47 143.08 C-2′ 118.26 118.93 119.32 118.2 118.13 117.91 C-3′ 129.23 129.79 130.26 129.74 129.90 129.87 C-4′ 127.03 128.06 128.05 127.19 127.32 127.20 a Assignment according to [9].
b The resonances for CH
2and the piperidine ring, 54.53 ppm, 53.90 ppm, 24.43 ppm, 23.33 ppm. c Missing.
d
br means broad.
e The resonances for CH
2and the piperidine ring, 54 ppm (br), 52.97 ppm, 23.65 ppm, 22.07 ppm.
Scheme 3. Numbering of the tautomeric backbone.
Scheme 4. Synthesis of compound 3.
1.2 Hz), 7.31 (t, H-4′, J = 7.5 Hz), 3.94 (s,CH2), 2.86 (s, H-2″,H-6″), 1.86 (s, H-3″, H-5″) and 1.26 (s, H-4″). For13C NMR data seeTable 1. HRMS-ESI calculated for C22H24N3O (M + H)+ 346.19194, found 346.19182.
2.2. NMR measurements
1H NMR and13C NMR spectra were recorded either at 500 MHz and 126 MHz on a Bruker Ultrashield Plus 500 or 400 MHz spectrometer using CDCl3, CD3CN or DMSO‑d6 as a solvent and TMS as internal standard. The low temperature experiments were recorded in CDCl3. APT and HMBC (tuned to a CH coupling of 7 Hz) spectra were recorded according to the Bruker standard procedures.
The assignments of the13C chemical shifts of1 in CDCl
3are given in Ref. [9] based on carbon-carbon coupling constants. The chemical shift changes in DMSO‑d6are minor (seeTable 1) and as the changes mostly will be due to a change in the equilibrium, the variations are well documented for C-2 and the benzene ring chemical shifts [11]. The assignments of the13C resonances of compound2 are based on APT and HMBC spectra and on those of compound1 combined with OH sub-stituent effects and so are those of the titrated spectra. The assignment of the13C NMR spectrum of2 in CD
3CN was done by extrapolations as explained above. The assignment of3 is partially based on APT and HMBC spectra. However, the assignment is complicated by the broad-ening of some lines and of one or two missing resonances in the aro-matic region. These missing resonances are likely appearing at 223 K. The1H spectrum is showing a broad H-4 resonance and C-4 is likewise broad at ambient temperature. C-2′ and C-3′ can be assigned based on intensities and confirmed together with C-4′ from the HMBC spectrum. C-1′ and C-2 can be assigned based on chemical shifts. C-6 and C-8 can be assigned from the HMBC spectrum and C-4a and C-8a are identified
from the APT spectrum and distinguished based on chemical shift ar-guments and supported by a H-7 to carbon cross peak to C-8a in the HMBC spectrum.
2.3. UV–Vis measurements
Spectral measurements were performed on a Jasco V-570 UV–Vis–NIR spectrophotometer, equipped with a thermostatic cell holder (using Huber MPC-K6 thermostat with 1 °C precision) in spectral grade solvents at 20 °C. Protonation was made with 96% sulfuric acid. Deprotonation was made with 25% NH3. The derivative spectra were calculated according to the“step-by-step filter” procedure [12]. 2.4. Quantum chemical calculations
Quantum-chemical calculations were performed by using the Gaussian 09 D.01 program suite [13]. DFT and time-dependent (TD)-DFT [14,15] were used to explore the ground- and excited-state prop-erties of each molecule. For all cases, the solvent effect was described by applying the polarizable continuum model (PCM) in its integral equation formalism variant (IEFPCM) [16]. For all calculations, an M06–2X-fitted hybrid meta-GGA functional [17] and the TZVP basis set [18] were used, keeping in mind that this level of theory was shown to provide very good results in predicting tautomerism of azonaphthols [19]. All tautomeric forms of the investigated compounds were opti-mized without restrictions and then were characterized as true minima using vibrational frequency calculations.
The NMR calculations were done using the GIAO approximation [20] and B3LYP/6-31G(d) functional and basis set.
2.5. Single crystal x-ray diffraction
Single red block-shaped crystals of3 were recrystallized from me-thanol by slow evaporation. A suitable crystal (0.20 × 0.15 × 0.08) mm3was selected and mounted on a MiTeGen holder in oil on a STOE IPDS 2 diffractometer. The crystal was kept at T = 250 K during data collection. UsingOlex2 [21], the structure was solved with theShelXT [22] structure solution program, using the Intrinsic Phasing solution method. The model was refined with version 2017/1 of ShelXL [23] using Least Squares minimization.
Crystal Data. C22H23N3O, Mr= 345.43, triclinic, P-1 (No. 2), a = 10.8103(10) Å, b = 11.2369(12) Å, c = 17.1688(18) Å, α = 80.314(10)°, β = 75.096(7)°, γ = 64.142(7)°, V = 1809.8(3) Å3, T = 250 K, Z = 4, Z' = 2, m(MoKa) = 0.079, 23416 reflections mea-sured, 6462 unique (Rint= 0.1037) which were used in all calculations. Thefinal wR2was 0.1013 (all data) and R1was 0.0426 (I > 2(I)).
The single crystal data of3 has been deposited at the Cambridge Crystallographic Data Centre and allocated the deposition number CCDC-1587825.
3. Results and discussion 3.1. In solution
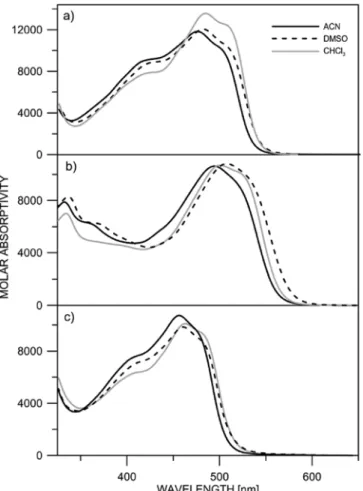
The absorption spectra of compounds1–3, shown onFig. 1, clearly show the presence of the tautomeric mixture in solution, irrespective of the solvent used, with absorption maxima of the enol form in the range 410–430 nm and red shifted keto form absorbance around 500 nm. Detailed information can be found in the second derivative spectra. On
Fig. 2, the maximum of the enol form can be seen at 420 nm for 1, 430 nm for2 and 420 nm for 3. According to the derivative spectra, the keto form absorbance consists of several sub bands as shown previously from curve decomposition [8]. As seen fromFig. 1a, compound1 exists as tautomeric mixture in acetonitrile (ACN) and DMSO with pre-dominance towards the keto tautomer in chloroform, which can be expected because of the proton donor nature of the solvent [24]. Fig. 1. Absorption spectra of a) 1, b) 2 and c) 3 in various solvents.
This conclusion is supported by the NMR results, taking into account the discussion in Ref. [25] about comparability of the UV–Vis and NMR data in tautomeric dyes. For1 in CDCl3a 70:30 ratio1b:1a was found [11]. As seen fromTable 1both C-1′and C-4′are shifted towards higher frequency in DMSO-d6 which means a shift towards the enol form.
In the case of 2, the quantity of the enol form decreases from acetonitrile to chloroform and DMSO. According to the NMR a com-parison with the calculated nuclear shielding (Table 2) gives that the
hydrazo form is about 90% in DMSO.
The absorption spectra of3 are similar as shape of the curve and position of the absorption maxima as those in 1, proving that the sidearm chain does not influence the position of the tautomeric equi-librium.
The presence of the tautomeric mixture in2 and 3, can be confirmed by a simple experiment. It is well known that the addition of water shifts the tautomeric equilibrium towards the keto form in azo-naph-thols [25,26]. As shown onFig. 3, in both compounds, the addition of water leads to a decrease of the maximum of the enol form and cor-respondingly increase of the band belonging to the keto tautomer. If only the keto form is presented in solution, no spectral shifts could be observed.
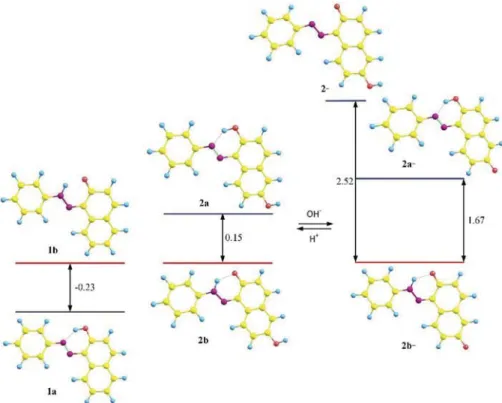
The coexistence of the tautomers in the studied compounds is con-firmed by the theoretical calculations as well. The moderate energy gap between the enol and the keto tautomeric forms, suggests that com-pound1 always exists as a tautomeric mixture (1a and 1b,Fig. 4, left) in solution as it is actually observed [8]. The implementation of an additional non-tautomeric hydroxyl group (compound 2) does not change the situation dramatically. Actually, it acts as a simple electron acceptor substituent shifting the tautomeric equilibrium towards the keto form2b (Fig. 4, centre). Compound2 has two options for depro-tonation: loss of the tautomeric proton giving non-tautomeric anion2 -or deprotonation of the additional OH group, which could affect the tautomeric equilibrium (2a- vs 2b-, Fig. 4, right). As seen from the calculations, the anion 2-is energetically unfavourable, which means that the deprotonation occurs at the additional OH group. As a result, the tautomeric equilibrium between2a-and2b-is almost fully shifted to the keto tautomer2b-with an energy gap of 1.67 kcal/mol.
Compound3 possesses an option for competitive hydrogen bonding in the enol form, where the tautomeric proton interacts either with the nitrogen from the azo group (3a,Scheme 2), or with the nitrogen atom from the piperidine unit (3a’). As seen fromFig. 5left, the structure3a is preferred. Actually, there is no competition for the tautomeric proton, between the nitrogen atom from the chromophore backbone and the nitrogen atom from the piperidine unit (energy gap of 2.5 kcal/mol between3a’ and 3b). Although the overall effect of the existence of the sidearm stabilizes the keto tautomer 3b (in comparison with 1), a substantial amount of3a could be expected in solution as the energy gap of 0.86 kcal/mol suggests. Obviously, the sidearm acts as a simple Fig. 2. Second derivative spectra of a) 1, b) 2 and c) 3 in various solvents.
Table 2
Calculated13C nuclear shielding for both tautomers of2 as well as of the anions.
Carbons/tautomer 2a 2a- 2b 2b- 2 -C-1 64.2 (63.8)a 60.1 64.0 (63.5) 59.5 59.9 C-2 43.3 (43.9) 46.0 18.2 (18.0) 13.1 32.4 C-3 74.8 (76.3) 84.0 66.7 (68.0) 74.3 59.7 C-4 59.3 (59.8) 53.7 54.2 (53.8) 44.4 67.5 C-4a 66.7 (66.9) 62.7 66.0 (61.6) 65.8 70.6 C-5 83.9 (84.8) 80.8 81.3 (81.6) 72.8 86.5 C-6 44.7 (41.9) 27.6 43.4 (41.1) 23.9 50.6 C-7 78.8 (75.3) 60.2 80.3 (77.6) 68.9 85.4 C-8 71.7 (71.7) 75.3 71.7 (71.4) 70.3 73.5 C-8a 67.5 (68.1) 81.8 67.7 (68.8) 87.0 60.4 C-1′ 46.0 (45.8) 43.7 54.9 (54.6) 52.2 37.2 C-2′ 66.1 (66.4) 71.0 78.7 (79.1) 83.9 67.9 C-6′ 81.4 (81.3) 81.2 81.8 (81.3) 83.8 84.5 C-3′ 67.3 (67.5) 69.7 67.3 (67.5) 69.9 70.3 C-5′ 67.4 (67.5) 66.5 66.5 (66.6) 67.8 70.5 C-4′ 66.8 (67.3) 75.2 71.8 (72.6) 81.9 78.8
a Values in brackets are for a molecule with a DMSO molecule hydrogen
bonded to the non-tautomeric OH hydrogen.
Fig. 3. Absorption spectra of a) 2 and b) 3 in ACN and DMSO, upon water addition: (____without water addition;____final spectrum upon water addition).
alkyl substituent, because when the whole sidearm is replaced by a methyl group the energy gap between tautomers3a and 3b remains almost the same - 0.7 kcal/mol.
The X-ray analysis of compound3, as will be shown below, clearly indicates that compound3 exists as the keto form 3b in the solid state and the nitrogen atom from the piperidine unit is far from the tauto-meric backbone, as predicted by the theoretical calculations (Fig. 5).
The NMR data show at room temperature very broad H-4 and C-4 re-sonances and one missing C-3 resonance. It was found in Ref. [27] that the piperidine ring wasflipping at ambient temperature and that the flipping could be stopped by lowering the temperature. Upon cooling the 4 and C-4 resonances broaden even further, whereas those of H-2″, H-6″ and H-4″ each split into two indicating that the ring flipping has slowed down, whereas the corresponding 13C resonances do not
Fig. 4. Relative energies (M06–2X/TZVP, in kcal/mol) in ACN of the tautomers of 1 (left), neutral tautomers (centre) and deprotonated forms of 2 (right).
Fig. 5. Relative energies (M06–2X/TZVP, in kcal/mol) of the neutral tautomers of 3 (centre) and the protonated species in ACN (right).
split either indicating that the piperidine ring is positioned symme-trically with respect to the naphthalene ring or the piperidine ring is moving with respect to the piperidine ring. However, the broadening of the resonances at ambient temperature can only be explained if the piperidine ring is pointing in the direction of H-4 as shown inScheme 2. This means that the hydrogen bond is clearly between the substituents at C-1 and C-2 as also indicated by the very high frequency shift of the XH proton (XH means either OH or NH).
As seen fromFig. 5right, the acid addition is a suitable stimulus for switching the tautomeric equilibrium to the pure keto form, because the protonated piperidine nitrogen atom, participates in additional in-tramolecular hydrogen bond formation, which further stabilizes the keto form, shifting the equilibrium fully towards the keto form.
The calculated positions of the absorption maxima of the corre-sponding enol and keto forms of the neutral compounds collected in
Table 1logically follow the spectral changes in solution. The calculated absorption maxima of the enol and keto forms respectively in com-pounds1 and 3, coincide, as observed by the experiment. In case of 2, the calculated absorption maximum of the enol form is slightly red shifted, compared to1 and 3, and the position of the keto form ab-sorbance is not affected. As seen fromTable 3, the deprotonation of2 leads to red shift in the maxima of both enol and keto tautomers, while the protonation of3 does not bring substantial effect, which is logical having in mind that the protonated nitrogen atom from the piperidine unit is not conjugated to the chromophore system.
As seen fromFig. S1, in which deprotonation of 1 and 2 is com-pared, the addition of base to the solution of2, leads to decrease of the maximum of the keto form at 500 nm and appearance of a new band at 600 nm. This additional band, which is not observed in1, gives in-dication that in2, the additional hydroxyl group is deprotonated as theoretical calculations suggest.
Addition of one equivalent of tetrabutylammonium hydroxide to2 led to precipitation so the NMR results shown inScheme 5are for ad-dition of 0.66 equivalent of base. High frequency shifts are found for C-2, C-5, C-6, C-7 and C-1′, whereas C-3 and C-8a are shifted to low frequency. The interpretation may be complicated by the fact that two tautomers exist and the equilibrium constant may change as a function of titration. Titration of the phenol group of 3-hydroxybenzoic acid led to a high frequency shift for C-3 whereas that of C-6 was shifted to high frequency [28]. As discussed above, in case of2 titration may occur either at O-2 or at the nitrogen depending on the tautomeric form (2-) or at O-6 (2a-/2b-). Looking at the changes in13C chemical shifts of
Scheme 5the picture is not immediately clear. However, taking the calculated nuclear shieldings ofTable 2into account it is obvious that the OH/NH proton at C-2 or N is not titrating as this would lead to a considerable low frequency shifts of C-2 (remember that the nuclear shieldings and the chemical shifts have opposite signs). The opposite is found. The change in chemical shifts around C-6 is in agreement with thefinding for 3-hydroxybenzoic acid as mentioned above. Based on thesefindings the OH proton at C-6 is titrated in DMSO using tetra-butylammonium hydroxide as base. The high frequency shift of C-1′can due both to titration and to a shift in the equilibrium. However, the low frequency of the C-4′ could also be due to titration, but the small magnitude indicates that it is most likely both due to titration (low
frequency shift) and a shift in the equilibrium versus the azo-form (high frequency shift).
As seen fromFig. 6, the addition of acid leads to gradual shift of the tautomeric equilibrium in3 to the keto form, which can be monitored with the decreasing absorption maxima of the enol form and raise of the red shifted absorption of3b. As a result, the pure spectrum of the keto form can be seen, which approximates very well with the pure spectrum of1b obtained by overlapping bands decomposition [8]. The process is reversible upon base addition, which shows that the tautomerism in3 can be controlled.
3.2. In the solid state
The X-ray analysis of compound 3, presented on Fig. 7, clearly shows that compound3 exists as a keto form 3b in the solid state and that the nitrogen atom from the piperidine unit is far from the tauto-meric backbone, as predicted by the theoretical calculations (Fig. 5). Compound3 crystallizes in the space group P-1 (No. 2) with two in-dependent molecules A and B per asymmetric unit. Molecule A, around O1, features an angle of 16.2° between the mean angle comprising the phenyl ring, and the one of the naphthyl ring. Furthermore, the C8–O1 bond is 1.276(4) Å long, and in the adjacent aromatic ring, the C–C distances are distributed alternatingly as follows: C8–C9 1.448(5), Table 3
Predicted absorption maxima of the neutral forms of1–3 and ionized forms of 2 and3 in acetonitrile (seeFigs. 4 and 5).
compound Neutral forms Ionized forms
λmax, faenol λmax, f keto λmax, f enol λmax, f keto
1 374 nm, 0.63 405 nm, 0.61 – –
2 390 nm, 0.51 405 nm, 0.61 537 nm, 0.13 569 nm, 0.28
3 376 nm, 0.64 404 nm, 0.62 372 nm, 0.63 418 nm, 0.63
a f– oscillator strength.
Scheme 5.13C titration shifts of2 after addition of 0.66 equivalents of
tetra-butylammonium hydroxide.
Fig. 6. Absorption spectra of 3 in ACN upon acid addition: (____without acid
addition;____final spectrum upon acid addition).
C9–C10 1.325(5), C10–C11 1.466(6), C11–C16 1.397(5), C16–C7 1.462(4) and C7–C8 1.426(6) Å. The distances C7–N2 and N2–N1 are respectively 1.337(5) and 1.328(4) Å long, indicating the trend of dis-tances expected from the structure of3b, except for the fact that the N1–N2 bond seems shorter than the expected N–N single bond of 1.47, but longer than a N=N bond with 1.24 Å (seeFigs. S2 and S3). The N1⋯O1 distance is 2.523(5) Å, the distance H1⋯O1 is 1.748 Å, and a stable 6-ring is thus stabilized in molecule A via N1–H1–O1 of 133.9°. O1 makes a short contact of 2.510 Å to H18B of a neighbor molecule A’ (3-x, -y, -1-z), which is another confirmation of the fact that the mo-lecule A is in its keto form.
In molecule B, the phenyl and naphthyl groups form an angle of only 13.3° to each other, and the O2–C30 distance is even shorter than in molecule A, with 1.269(5) Å. The distances in the aromatic ring bearing O2 are C30–C31 1.451(4), C31–C32 1.350(5), C32–C33 1.437(5), C33–C38 1.407(4), C38–C29 1.440(5) and C29–C30 1.453(6) Å, while the distances C29–N5 and N5–N4 are respectively 1.334(4) and 1.310(5) Å long. The N4⋯O2 distance is 2.501 Å and H4A is 1.754 Å away from the O2. This H-bond is again stabilized by a stable 6-ring with an N–H–O angle of 137.8°. O2 also makes a short contact to H44B of another molecule B’ (2-x, -2-y, -z) at 2.449 Å, which is even shorter than for molecule A and A’. Yet, the N–N distance in molecule B is significantly shorter than in A, which might indicate a more stable azo-group. Nevertheless, in both molecules A and B, the H-atom in-volved in tautomerism (H1 or H4A) is completely found linked to the respective nitrogen atom, with the3b form as clearly the most stable one. The crystal structure further supports the discussion on the pi-peridyl entity, which is turned away from the tautomeric site. Indeed, in molecule A, a short contact between the N3 atom and H10 is found to be 2.505 Å long (N3–C10 2.872(2) Å), while in molecule B, the ana-logue distance between N6 and H32 is 2.580 Å (N6–C32 2.923(2) Å). Both N-atoms, N3 and N6, are also fixed in their pyramidal con-formation with angle sums of ca. 328.6 ± 0.7° on average.
The partially significant differences between molecules A and B might as well occur from packing effects. Indeed, there are offset par-allelπ-π interactions as well as C–H … π interactions as follows: H25 of a molecule B undergoes C–H … π interactions with C2 and C3 of mo-lecule A at distances of respectively 2.878 and 2.837 Å, with an angle between the two involved phenyl groups of almost 72°. Further packing involves a pair of two offset molecules B, arranged head-to-tail which
interact twice via C30 of one and C24 of the neighbor molecule (and vice versa) at a distance of 3.368(6) Å. The molecules of A are also packed in an antiparallel way with an offset parallel packing of the naphthyl groups, but the average distances between the aromatic cores is typically longer than 3.55 Å, so only weak interactions can be con-sidered. Stacks of A and stacks of B lead to a chevron type arrangement in the three dimensional packing.
4. Conclusions
Compounds1, 2 and 3 exist as tautomeric mixtures in solution as shown by UV-Vis, NMR spectroscopy and quantum chemical calcula-tions. The structural changes in2 and 3, make possible to control the tautomerism in solution.
In the case of2, a shift in the equilibrium can be achieved through deprotonation of the additional hydroxyl group, while in3, the proto-nation of the piperidine nitrogen stimulates shift to the keto tautomer. Compound3 is more suitable as tautomeric switch, because the piperidine unit is not conjugated to the tautomeric backbone and the protonation process does not influence the absorption spectra directly. Acknowledgements
The financial support by the Swiss National Science Foundation ([email protected] SCOPES Institutional Partnership pro-ject IZ74Z0_160515) and Bulgarian Science Fund (Bulgarian Science Fund and DAAD joint research project DNTS/Germany/01/04 Proton Cranes) is gratefully acknowledged. In addition, we acknowledge the access to computational facilities provided by Project MADARA (Project RNF01/0110).
Appendix A. Supplementary data
Supplementary data related to this article can be found athttp://dx. doi.org/10.1016/j.dyepig.2018.03.070.
References
[1] Zollinger H. Color Chemistry: Syntheses, Properties, and Applications of Organic Dyes and Pigments. 3rd ed. Zürich: Weinheim: Verlag Helvetica Chimica Acta;
Fig. 7. X-ray analysis of 3, ellipsoids are represented with 30% of probability, H bonds are drawn as blue dashed lines. (For interpretation of the references to color in thisfigure legend, the reader is referred to the Web version of this article.)
Wiley-VCH; 2003.
[2] Nedeltcheva-Antonova D, Antonov L. Controlled tautomerism: is it possible? In: Antonov L, editor. Tautomerism: Concepts and Applications in Science and Technology Weinheim, Germany: Wiley-VCH Verlag GmbH & Co; 2016. p. 273–94.
http://dx.doi.org/10.1002/9783527695713.ch12.
[3] Antonov LM, Kurteva VB, Simeonov SP, Deneva VV, Crochet A, Fromm KM. Tautocrowns: a concept for a sensing molecule with an active side-arm. Tetrahedron
2010;66:4292–7.http://dx.doi.org/10.1016/j.tet.2010.04.049.
[4] Antonov L, Deneva V, Simeonov S, Kurteva V, Nedeltcheva D, Wirz J. Exploiting tautomerism for switching and signaling. Angew Chem Int Ed 2009;48:7875–8.
http://dx.doi.org/10.1002/anie.200903301.
[5] Ball P, Nicholls CH. Azo-hydrazone tautomerism of hydroxyazo compounds—a
re-view. Dyes Pigments 1982;3:5–26.http://dx.doi.org/10.1016/0143-7208(82)
80010-7.
[6] Kelemen J. Azo—hydrazone tautomerism in azo dyes. III. The tautomeric structure of 1-(4′-nitrophenylazo)-2-naphthylamine from crystal structure determination.
Dyes Pigments 1982;3:249–71.http://dx.doi.org/10.1016/0143-7208(82)80001-6.
[7] Lyčka A, Hansen PE. Deuterium isotope effects on 13C and 15N nuclear shielding
ino-hydroxyazo dyes. Org Magn Reson 1984;22:569–72.http://dx.doi.org/10.
1002/mrc.1270220910.
[8] Antonov L, Stoyanov S, Stoyanova T. Tautomeric equilibrium in
1-phenylazo-2-naphthol— a quantitative study. Dyes Pigments 1995;27:133–42.http://dx.doi.
org/10.1016/0143-7208(94)00042-Z.
[9] Hansen PE, Lyčka A. Carbon-carbon coupling constants of 1-phenylazo-2-naphthol and 2-phenylazo-1-naphthol obtained by the SEMINA-1 technique. Magn Reson
Chem 1986;24:772–6.http://dx.doi.org/10.1002/mrc.1260240908.
[10] Li X, Hewgley JB, Mulrooney CA, Yang J, Kozlowski MC. Enantioselective oxidative biaryl coupling reactions catalyzed by 1,5-diazadecalin metal complexes: efficient formation of chiral functionalized BINOL derivatives. J Org Chem
2003;68:5500–11.http://dx.doi.org/10.1021/jo0340206.
[11] Lyčka A, Šnobl D, Macháček V, Večeřa M.13C NMR spectra of non-labelled and
15N-mono-labelled azo dyes. Org Magn Reson 1981;15:390–3.http://dx.doi.org/
10.1002/mrc.1270150413.
[12] Antonov L. Drawbacks of the present standards for processing absorption spectra recorded linearly as a function of wavelength. TrAC Trends Anal Chem
1997;16:536–43.http://dx.doi.org/10.1016/S0165-9936(97)00064-2.
[13] Frisch MJ, Trucks GW, Schlegel HB, Scuseria GE, Robb MA, Cheeseman JR, Scalmani G, Barone V, Petersson GA, Nakatsuji H, Li X, Caricato M, Marenich A, Bloino J, Janesko BG, Gomperts R, Mennucci B, Hratchian HP, Ortiz JV, Izmaylov AF, Sonnenberg JL, Williams-Young D, Ding F, Lipparini F, Egidi F, Goings J, Peng B, Petrone A, Henderson T, Ranasinghe D, Zakrzewski VG, Gao J, Rega N, Zheng G, Liang W, Hada M, Ehara M, Toyota K, Fukuda R, Hasegawa J, Ishida M, Nakajima T, Honda Y, Kitao O, Nakai H, Vreven T, Throssell K, Montgomery Jr. JA, Peralta JE, Ogliaro F, Bearpark M, Heyd JJ, Brothers E, Kudin KN, Staroverov VN, Keith T, Kobayashi R, Normand J, Raghavachari K, Rendell A, Burant JC, Iyengar SS, Tomasi J, Cossi M, Millam JM, Klene M, Adamo C, Cammi R, Ochterski JW, Martin RL,
Morokuma K, Farkas O, Foresman JB, Fox DJ. Gaussian 09, revision D.01. Wallingford CT: Gaussian, Inc.; 2013.
[14] Furche F, Ahlrichs R. Adiabatic time-dependent density functional methods for
excited state properties. J Chem Phys 2002;117:7433–47.http://dx.doi.org/10.
1063/1.1508368.
[15] Casida ME, Jamorski C, Casida KC, Salahub DR. Molecular excitation energies to high-lying bound states from time-dependent density-functional response theory: characterization and correction of the time-dependent local density approximation
ionization threshold. J Chem Phys 1998;108:4439–49.http://dx.doi.org/10.1063/
1.475855.
[16] Tomasi J, Mennucci B, Cammi R. Quantum mechanical continuum solvation
models. Chem Rev 2005;105:2999–3094.http://dx.doi.org/10.1021/cr9904009.
[17] Zhao Y, Truhlar DG. Density functionals with broad applicability in chemistry. Acc
Chem Res 2008;41:157–67.http://dx.doi.org/10.1021/ar700111a.
[18] Weigend F. Accurate Coulomb-fitting basis sets for H to Rn. Phys Chem Chem Phys
2006;8:1057.http://dx.doi.org/10.1039/b515623h.
[19] Kawauchi S, Antonov L. Description of the tautomerism in some azonaphthols. J
Phys Org Chem 2013;26:643–52.http://dx.doi.org/10.1002/poc.3143.
[20] Wolinski K, Hinton JF, Pulay P. Efficient implementation of the gauge-independent atomic orbital method for NMR chemical shift calculations. J Am Chem Soc
1990;112:8251–60.http://dx.doi.org/10.1021/ja00179a005.
[21] Dolomanov OV, Bourhis LJ, Gildea RJ, Howard JAK, Puschmann H. OLEX2 : a complete structure solution, refinement and analysis program. J Appl Crystallogr
2009;42:339–41.http://dx.doi.org/10.1107/S0021889808042726.
[22] Sheldrick GM. SHELXT– integrated space-group and crystal-structure
determina-tion. Acta Crystallogr Sect Found Adv 2015;71:3–8.http://dx.doi.org/10.1107/
S2053273314026370.
[23] Sheldrick GM. Crystal structure refinement with SHELXL. Acta Crystallogr Sect C
Struct Chem 2015;71:3–8.http://dx.doi.org/10.1107/S2053229614024218.
[24] Fabian WMF, Antonov L, Nedeltcheva D, Kamounah FS, Taylor PJ. Tautomerism in hydroxynaphthaldehyde anils and azo analogues: a combined experimental and
computational study. J Phys Chem 2004;108:7603–12.http://dx.doi.org/10.1021/
jp048035z.
[25] Nedeltcheva D, Antonov L, Lycka A, Damyanova B, Popov S. Chemometric models for quantitative analysis of tautomeric schiff bases and azo dyes. Curr Org Chem
2009;13:217–40.http://dx.doi.org/10.2174/138527209787314832.
[26] Antonov L, Fabian WMF, Taylor PJ. Tautomerism in some aromatic Schiff bases and
related azo compounds: an LSER study. J Phys Org Chem 2005;18:1169–75.http://
dx.doi.org/10.1002/poc.965.
[27] Manolova Y, Kurteva V, Antonov L, Marciniak H, Lochbrunner S, Crochet A, et al. 4-Hydroxy-1-naphthaldehydes: proton transfer or deprotonation. Phys Chem Chem
Phys 2015;17:10238–49.http://dx.doi.org/10.1039/C5CP00870K.
[28] Hansen PE, Thiessen H, Brodersen R, et al. Bilirubin acidity. Titrimetric and 13C
NMR studies. Acta Chem Scand 1979;33b:281–93.http://dx.doi.org/10.3891/acta.
chem.scand.33b-0281.