HAL Id: hal-01870926
https://hal.sorbonne-universite.fr/hal-01870926
Submitted on 10 Sep 2018HAL is a multi-disciplinary open access archive for the deposit and dissemination of sci-entific research documents, whether they are pub-lished or not. The documents may come from teaching and research institutions in France or abroad, or from public or private research centers.
L’archive ouverte pluridisciplinaire HAL, est destinée au dépôt et à la diffusion de documents scientifiques de niveau recherche, publiés ou non, émanant des établissements d’enseignement et de recherche français ou étrangers, des laboratoires publics ou privés.
Mass and Fine-Scale Morphological Changes Induced by
Changing Seawater pH in the Coccolith Gephyrocapsa
oceanica
Michaël Hermoso, Fabrice Minoletti
To cite this version:
Michaël Hermoso, Fabrice Minoletti. Mass and Fine-Scale Morphological Changes Induced by Chang-ing Seawater pH in the Coccolith Gephyrocapsa oceanica. Journal of Geophysical Research: Biogeo-sciences, American Geophysical Union, 2018, 123, �10.1029/2018jg004535�. �hal-01870926�
Journal of Geophysical Research: Biogeosciences (Volume 123 – 2018) https://doi.org/10.1029/2018JG004535
Mass and Fine-Scale Morphological Changes Induced by Changing
Seawater pH in the Coccolith Gephyrocapsa oceanica
Michaël Hermoso1,*, and Fabrice Minoletti1,*
1 Sorbonne Université, CNRS-INSU, Institut des Sciences de la Terre de Paris, UMR ISTeP, 75005 Paris, France.
* The Authors contributed equally to the study.
Corresponding author: Michaël Hermoso ([email protected])
Key Points:
• High resolution microscopic analyses of coccolith biominerals cultured under pH ranging from 7.4 to 9.0.
• Detection of ultrastructural changes within the biominerals to provide a mechanistic understanding of the effect of pH on biomineralization.
• Decrease in calcite mass at lowest pH corresponds to a strong reduction of the breadth of the central tube of the coccoliths.
Abstract
Coccolithophores have been extensively studied to understand the environmental control on calcification in a key biological group influencing the alkalinity of seawater. Previous studies have established that bulk calcification scales with cell division rates under a wide range of pH conditions. Yet, the fine scale ultrastructural changes of the coccoliths and therefore the pH-sensitive underlying mechanisms altering biomineralization of the coccoliths remain largely under-constrained. Using circularly polarized light and high-resolution microscopy, we have generated mass estimates of cultured Gephyrocapsa oceanica coccoliths grown in media with pH values ranging from 7.4 to 9.0. These mass estimates representing a bulk calcification response were related tothe morphological changes within the coccoliths. From optimal (pH 8.6) down to pH 7.4 conditions, we have observed that impaired cell growth and lower calcite quota are accompanied by a 35% decrease in mean coccolith mass. The data further show that seawater acidification does not homogenously affect calcification of the coccoliths, as a clear decrease of the breadth of the tube (a structure surrounding the central area of the coccoliths) was detected, whereas all other ultrastructural components were far less impacted. We discuss this specific sensitivity to acidification as the possible consequence of the altered interaction of the acidic polysaccharides used for biomineralization and ambient concentration of protons released by calcification that substantially modify the growth patterns, the morphology, and ultimately the mass of the coccoliths.
Plain Language Summary
Anthropogenic rise in CO2 concentrations induces ocean acidification, which represents a threat for marine organisms. As calcium carbonate is sensitive to pH, those organisms secreting calcite shells, such as the coccolithophores (unicellular microalgae) are particularly exposed to ongoing climate change. Previous studies have documented that the coccoliths, the calcite biominerals produced intracellularly by the coccolithophores, will be adversely affected by decreased ambient pH values. Yet, how this reduction operates at the scale of the coccolith remains elusive and we are thus lacking an understanding of the intracellular mechanisms behind undercalcification, which is essential to anticipate the response of marine calcifiers in a changing planet. We analyzed the morphometric parameters of coccoliths grown under the pH range 7.4 – 9.0. Our data show a clear reduction in coccolith mass in more acidic conditions, and we explain this change by altered growth of calcite at an early
stage of the formation of the biomineral. This study suggests that certain organic molecules used to promote intracellular calcification are perturbed by decreased local pH, and that less calcified coccoliths produced within the cell cannot be the result of a post mortem process that may occur when calcite is bathed in relative low pH environments after their secretion outside the cells.
1 Introduction
Calcification by coccolithophore microalgae occurs in the oceans since the Late Triassic (~200 Ma) and has offered a valuable deep sea climatic archive that paleoceanographers study to reconstruct ancient climates. By mineralizing dissolved inorganic carbon and alkaline earth cations, the production of the coccoliths in sunlit oceanic waters is influential on the carbonate chemistry of seawater, which in turn controls, with temperature and salinity, the dynamics of the exchange of CO2 between the atmosphere and the surface oceans, and hence climates (Sigman and Boyle, 2000; Ridgwell, 2005). With raising concerns about the future climate of the Anthropocene, there is a need to quantitatively and mechanistically understand the effect of decreasing pH values of the surface oceans on oceanic phytoplankton (e.g. Doney et al., 2009). Under a perturbed environment, the environmental, physiological and genetic parameters –and the interplay thereof– controlling cellular calcite quota in the coccolithophores remain largely under-constrained beside a bulk response that has been achieved thus far. Overall, culture studies of the coccolithophores have been overwhelmingly focused on Emiliania huxleyi and showed reduced bulk calcification at the lowest pH (Riebesell et al., 2000; Iglesias-Rodriguez et al., 2008; Rickaby et al., 2010; Langer et al., 2011; Hoppe et al., 2011; Bach et al., 2012; Sett et al., 2014; Riebesell et al., 2016; Müller et al., 2017). In addition, changes in bulk calcite production under pH/pCO2 perturbation experiments was previously documented for the ubiquitous coccolithophore species
Gephyrocapsa oceanica (Rickaby et al., 2010; Sett et al., 2014; Hermoso, 2015). Specifically,
it has been showed that cell division rates of Gephyrocapsa oceanica (µ) and µ-normalized calcite quotas scaled linearly: Cells dividing more frequently (high µ) have higher calcite quota (calcite produced per cell and per day) (Sett et al., 2014). However, a much more limited number of studies have approached this problem by characterizing changes in fine-scale morphometrics of the coccoliths (Bollmann et al., 2010; Young et al., 2014). In this study, we dissect the effect of changing ambient pH values on calcification patterns of
individual coccoliths through laboratory cultures of Gephyrocapsa oceanica. The overarching question addressed in our work is to determine whether calcification is homogenously affected at the scale of the coccolith and to establish how the discrete ultrastructural parts of the biomineral (the shields, the elements of the tube and of the bridge, and the central area) specifically respond to acidification (Figures 1 and 2).
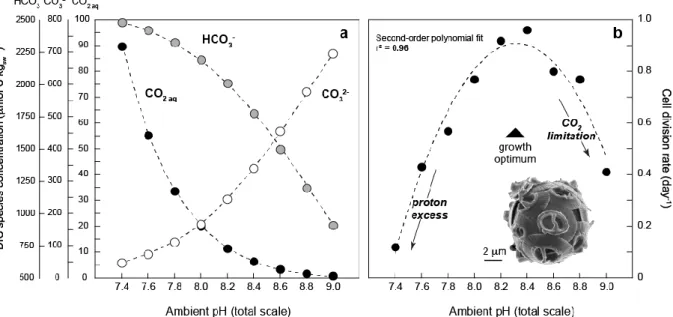
Figure 1. Change in cellular division rates of the coccolithophore Gephyrocapsa oceanica (strain RCC 1314) with changes in ambient pH. (a) The status of the carbonate chemistry in medium (relative abundance of dissolved inorganic carbon species (DIC)) as a function of pH. (b) The changes in cell division rates induced by alteration of pH and speciation of the DIC species for Gephyrocapsa oceanica. Data from Hermoso (2015).
2 Materials and Methods
2.1 Culture Material
We analyzed cultured coccoliths of the species Gephyrocapsa oceanica (strain RCC 1314) that were grown and geochemically measured in an earlier study aiming at understanding the biological isotopic fractionation in coccolith calcite (Hermoso, 2015). The raw medium was made from natural seawater from the English Channel with chemical amendments following the K/2 recipe (Keller et al., 1987). Temperature was kept constant at 15 °C. Light irradiance was 150 μmol photons m–2 s–1 with an illuminated period of 14 h and a dark period of 10 h. The final pH values ranged from 7.4 to 9.0 pH units (total scale). Full procedure of the implementation of the cultures can be found in Hermoso (2015). The shift in carbonate equilibrium in media induced by H+ or OH– addition made to reach the targeted pH values,
and in particular the availability of CO2 aq for cell growth, is depicted on Fig 1a. The saturation state of the medium with respect to calcite (ΩCaCO3) ranged from 1.1 to 16.6 from the lowest to the highest pH values.
2.2 Smear Slide Preparation
The culture residues comprising the coccospheres and detached coccoliths were not oxidized / bleached in order to avoid calcite dissolution during sample processing. About 2 mg of culture residues were dispersed in 4 mL neutralized deionized water. The glass vial containing this very diluted suspension was exposed to gentle and brief ultrasonic treatment (30 W / 25 kHz for approximately 20 s) to disaggregate the coccospheres and avoid clusters of materials in the suspension. The method for smear slide preparation followed that described by Koch & Young (2007). A volume of 0.25 mL of the suspension was pipetted out and deposited onto a 22 × 32 mm microscope slide. The preparation was dried on a hot plate and mounted using a UV light-reticulable NOA 61 glue (Norland Products Inc.).
2.3 Optical Microscopy and Evaluation of Calcite Thickness
The smear slides were processed and analyzed using a Zeiss Axio Imager M1 optical microscope fitted with a circular polarizer at Sorbonne Université, Paris. Individual coccoliths were photographed by a digital camera Axiocam MRc5 attached to the trinocular tube. The combination of a ×63 objective with a ×2.5 additional lens resulted in a resolution of one pixel width representing 0.034 µm. Preparing a very dilute suspension as described above was essential to ensure that the coccoliths were flat lying. Overlapping specimens or crooked coccoliths were disregarded from the analyses. The resulting 256 × 256 pixel-width frames containing one single coccolith per field-of-view were subsequently converted into 8-bit grayscale images for processing (Figure 2a). Transmitted light was set using Kohler illumination with 50% of the LED illumination power and a 400 ms exposure time resulting in background gray levels comprised between values of 32 to 44.
Gray level values and calcite thickness scale over the range of the first order birefringence color of the Michel-Lévy Chart and can be used to calculate calcite thickness, provided they are measured perpendicularly to the coccolith plane (Beaufort, 2005). Conversion between
gray levels and thickness was made applying the polynomial regression recast from the dataset by Bollmann (2014) (equation 1).
Calcite thickness = 0.0000004 × MGL2 + 0.0033 × MGL + 0.0072 (1)
where calcite thickness estimates are in micrometer, and the mean gray level (MGL) of a considered area is a dimensionless value comprised between 0 and 255.
We are fully aware that many technical parameters may complicate the application of equation (1) to transfer measured gray levels into estimates of calcite thickness (see, e.g., discussion by Linge Johsen & Bollmann, 2017). Indeed, the microscope optics, camera characteristics, the light source (halogen versus LED), and the exposure time are instrument specific, and hamper interlaboratory comparison in the evaluation of calcite thickness. This potential caveat induces that the equation 1 can in theory only be used if the measurements were made under the same analytical conditions as in Bollmann (2014). In any case, whichever equation linking gray level and thickness is used, both parameters are proportional, and they are linearly related within the range of the measurements of the present study. With this in mind, we only interpreted variations of the estimates of height (thickness) of the tube and the coccolith shields to decipher fine-scale changes in the morphometrics of the coccoliths grown at distinct pH. Nevertheless, coccolith thicknesses computed via equation (1) in our study appear to be realistic when comparing them with published data generated with other analytical conditions and transfer equations (see later discussion).
2.4 Detection of Fine-Scale Ultrastructure Within the Coccolith
The monocrystalline calcite elements within Noëlaerhabdaceae coccoliths – a family to which
G. oceanica belongs– are radially arranged with their crystallographic c-axis in the direction
of the coccolith plane (Young et al., 1992). This crystallographic feature allows full detection and quantification of calcite elements using circularly polarized light that eliminates the extinction patterns (Bollmann, 2014; Beaufort et al., 2014; Fuertes et al., 2014). As a result, calcite crystals are consistently birefringent with gray levels values greater (i.e., brighter) than the background values without the black cross that appears under cross polarized light. In our analyses and under the analytical settings, the presence of a particle was detected with a threshold at 44 gray levels, the upper limit of background values defined above.
On average, the mean measurements presented in this study originate from 30 different coccolith specimens and the error bars correspond to one standard deviation (1 SD) of the data around the mean. Morphometric measurements of the coccoliths were achieved from the images using a routine developed on the Fiji software (Schindelin et al., 2012). The routine was designed to detect (i) the external edge of the distal shield (Figure 2) with values greater than 44 gray levels (i.e., the maximum value of the black background) and (ii) the external edge of the tube with gray level values greater than 100 (thickness greater than 0.38 µm). The surface area of the latter structure may also include the innermost part of shields, and when present, the ascending part of the bridge that crowns the central area.
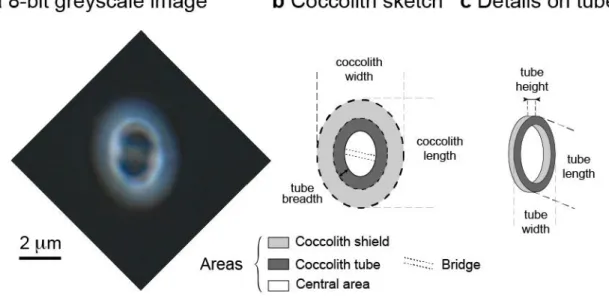
Figure 2. Parameters (morphometrics) of Gephyrocapsa oceanica coccoliths analyzed in the present study. (a) A micrograph of a coccolith observed using circularly polarized light. Scale bar is inset. (b and c) The discrete fine-scale ultrastructural parts of the coccoliths being investigated here (see Table 1).
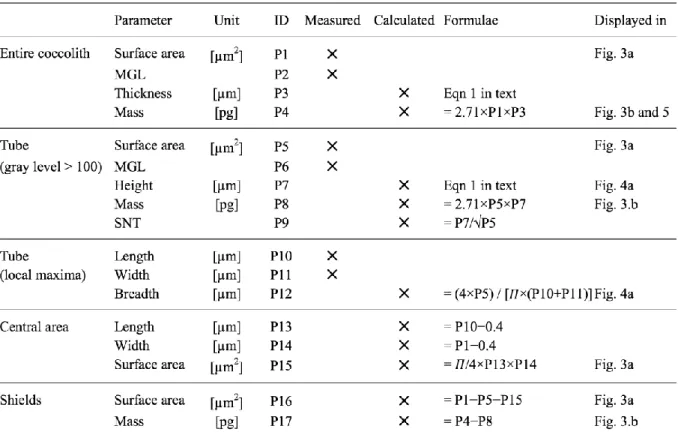
For both the whole coccolith and the tube, the routine automatically measured the surface area (Table 1; Parameters P1 and P5) and mean gray level or MGL (Table 1; Parameters P2 and P6) that were used to estimate the calcite thickness using equation (1) (Table 1; Parameters P3 and P7). Volume estimates were obtained by multiplying the surface area by the thickness, and lastly converted into calcite weight using a density of calcite of 2.71 (Table 1; Parameters P4 and P8).
Table 1. Coccolith Morphometric Parameters Defined in Text and Used in the Present Study. We also analyzed fine-scale ultrastructure within the biominerals, such as the morphometrics of the central area, the tube that connects the two cycles, and the radial shields (Figure 2). The axial ratio of the tube (length over width; Figure 2b) was determined by processing the gray level profiles of 96 radial segments across this structure, and determining each local maximum gray level. These local maxima were computed to fit an ellipse that accurately reflects the shape of the tube. From this outline, the major and minor axes (Table 1; parameters P10 and P11, respectively) were used to calculate the axial ratio of the tube, and that of the encircled central area. The morphometrics of the central area (P13, P14, P15) were derived from the parameters of this ellipse since the central area has the same shape and is slightly smaller (0.4 µm on average) than the length and width of the determined ellipse.
The tube breadth was inferred by combining the surface area and the size (length and width) of the tube by idealizing two ellipses derived from the local maxima, thus defining the distance between the edge of the central area and the external perimeter of the tube (Figure 2c). The surface area of the shield was calculated as the difference between the surface area of entire coccolith, and those of the tube and the central area (P16) (Figure 2).
Lastly, the size normalized thickness or SNT (Table 1; Parameter P9) is a dimensionless parameter that corresponds to a three dimensional aspect ratio of the tube, as calculated in McClelland et al. (2016) on the entire coccolith. It was calculated by dividing the tube height (P7) by the square root of the tube surface area (P5) to homogenize the 1-D (height) and 2-D (surface area) dimensions of the two variables (equation (2)).
Tube size normalized thickness [dimensionless] = Tube height [µm]
√Tube surface area [µm2] (2) 2.5 Scanning Electron Microscopy
An aliquot of a suspension containing the cultured coccoliths used for the preparation of the smear slides was poured onto a 2 μm polycarbonate membrane and dried out at room temperature. A 1 cm2 piece of this membrane was mounted onto a stub, carbon coated, and introduced in a Zeiss Ultra 55 Field Emission Scanning Electron Microscope at Sorbonne Université, Paris. The working accelerating voltage was 15 keV. On the scanning electron microscope (SEM) images, no overgrowth of secondary calcite on the coccoliths or non biogenic carbonate phases, such as aragonite needles, were observed. We did not observe notable malformation or etching features on G. oceanica coccoliths, although some specimens exhibited slit-like structures on the distal shield or incomplete bridges. We did not attempt estimates of the frequency of malformed coccoliths, as in the work by Langer et al. (2011) in which malformed E. huxleyi seemed to be much more frequent than observed for G. oceanica in our study.
3 Results
3.1 Influence of pH on Division Rates
The division rates of G. oceanica strain RCC 1314 previously measured by Hermoso (2015) were found to be highly sensitive to ambient pH values. Over the entire 7.4 – 9.0 spectrum, the relationship between pH and µ values was described by a second order polynomial relationship (bell curve) exhibiting an optimum between pH 8.2 and 8.4 (Figure 1b). These conditions correspond to the acclimation conditions of the strain, which is maintained in vitro for nearly 20 years and also to seawater pH in the Arcachon Bay (France) where this strain
was collected. The results for this strain match the reported µ values under varying pH (7.35 to 8.93) from the experiments conducted at 15 °C by Sett et al. (2014) on another strain of the coccolithophore G. oceanica (RCC 1303). Both strains correspond to the morphotype Large sensu Bollmann et al. (2010) and originate from the same temperate region of the Atlantic Ocean. Ecological and biogeochemical model predicts that in unicellular algae, the faster division rate, the smaller the cell size (Marañón, 2014; Aloisi, 2015). However, in the experiments, there was no clear influence of ambient pH and the induced change in µ on the diameters of the coccospheres with relatively steady values ranging from 6.4 to 7.4 µm across (Hermoso, 2015). The study by Sett et al. (2014) did not document coccosphere or cell sizes. However, the authors have provided key parameters pertaining to bulk calcification, and showed that the calcite quotas (expressed as pg C cell–1 day–1) were linearly related to the specific growth rates (µ) at 15 °C according to equation (3):
Calcite quota [pg C cell–1day–1] = (22.6 × μ [day–1]) − 0.49 (r2
= 0.93) (3)
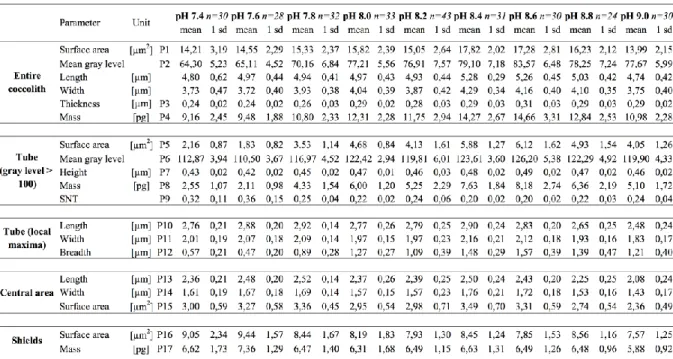
Table 2. Means and standard deviations of the measurements and calculated parameters (P1
to P17) defined in Table 1. Note: commas are used for decimal points.
3.2 Changes in Whole Coccolith Surface Area
As observed for the cellular divisions rates, the total surface area of the coccoliths is correlated with pH following a second order polynomial regression (Fig 3a). Although the
mean of measurements corresponding to pH 8.2 seems to depart from the bell curve with slightly lower values than expected, it appears that the largest coccoliths are produced by the coccolithophores dividing the faster. Decreasing ambient pH from 8.6 (optimum calcification) down to 7.4 leads to smaller surface areas of the coccoliths with values dropping from 18 to 14 µm2 on average. Under more basic conditions compared to the optimum, a sharp decrease in the surface area of the coccoliths is also observed up to pH 9.0 (coccolith surface areas on the order of 14 µm2).
Figure 3. Changes in mean surface area and mass of the coccoliths cultured at various pH. (a) How the surface area of the coccoliths and of their discrete ultrastructural parts (central area, tube and shield) evolved. (b) Data presented in panel a and calcite thickness (raw data presented in Table 2) and therefore shows the mass of the coccoliths and that of the tube and shields taken separately. Note that no mass quantification has been made for the central area.
3.3 Changes in Whole Coccolith Thickness
The effect of lowering ambient pH from pH 8.6 down to 7.4 led to a progressive decrease of the calcite thickness of the coccoliths (Table 2). The magnitude of this change is appreciable, representing a loss of 25% of calcite thickness with mean values falling from 0.31 to 0.24 µm. We emphasize that this result of our study corresponds to differences in MGLs and that the relative changes in calcite thickness do not depend on the calibration shown in equation (1). On the 8.6 – 7.4 pH range, the decrease appears to be linear with a statistically significant regression coefficient (r2 = 0.95; p-value < 0.0005). The two highest pH conditions, namely 8.8 and 9.0, depart from this regression line with a mean thickness around 0.29 µm, thus are
lowered compared to the maximum value observed at pH 8.6. These values reflect an integrated thickness of the total surface area of the coccoliths, and as such, these estimates may be influenced by changes of the constitutive crystallographic and ultrastructural parts forming the coccoliths (see below). From a methodological point of view (see section 2.3), coccolith surface area and thickness presented in this study for pH around 8 are in line with previous estimates inferred using another technique (SYRACO) and obtained from strain RCC 1314 grown in the same conditions also at the Oxford Biogeochemistry Laboratories (McClelland et al., 2016).
3.4 Changes in Whole Coccolith Mass
At the level of individual coccoliths, that is, regardless of cell division rates and µ-normalized calcite quota, there is appreciable variation of the degree of calcification of the biominerals produced by G. oceanica at distinct pH spanning from 9 to nearly 15 pg (Figure 3b). The results show that the average coccolith mass is minimum at both the lowest and highest pH values, whereas calcite biominerals are more heavily calcified at intermediate pH with an optimum between pH 8.4 and 8.6. On the entire pH spectrum, the pH/coccolith mass relationship follows a second order polynomial law (r2 = 0.76). Disregarding the two highest pH conditions (8.8 and 9.0), the two parameters linearly correlate (r2 = 0.94; p-value < 0.0005): The lower the pH from 8.6 to 7.4, the lower the average mass of calcite per coccolith. This trend, once again, parallels cell growth rates with a regression coefficient (r2) of 0.69 (p-value < 0.005).
3.5 Morphological Changes Within the Coccoliths
3.5.1 Changes Within the Coccolith Plane
We did not observe any statistically significant changes in the size of the central area for coccoliths precipitated from distinct ambient pH conditions, as measurements for each pH condition are indistinguishable from each other considering the standard deviation of the data. The mean value for all measurements (3.06 ±0.67 µm2; Figure 3a) matches the measurements conducted by Bollmann et al. (2010) based on SEM analyses with a mean of 3.81 µm2 for strain ARC03, which also belongs to the morphotype Large and originates from the same region than the strain RCC 1314 being analyzed here. By contrast, calcite constitutive of the
shields and the tube exhibits pronounced changes in their surface area, but the response of these two structures is contrasting. There is a progressive decrease in the surface area of the shield of the coccoliths with increasing pH (Figure 3a). This negative trend (r2 = 0.53; p-value < 0.05) corresponds to a decrease from 9.5 to 7.5 µm2 of the surface area of the distal shield (Figure 3a).
The most prominent change in the morphology of the coccoliths is the surface area of the tube that sharply and continuously decreases from pH 8.6 to 7.4 (r2 = 0.90; p-value < 0.005). This decrease of 70% of the surface area is considerable with mean values falling from 6.1 to 1.8 µm2. The larger tubes (in the coccolith plane) are thus observed from specimens grown at pH 8.6. At the highest pH (8.8 and 9.0), the tube becomes smaller (~4 µm2) and narrower (~1.2 µm), compared to maximum values observed atpH 8.6.
3.5.2 Changes Perpendicular to the Coccolith Plane (Height and Thickness)
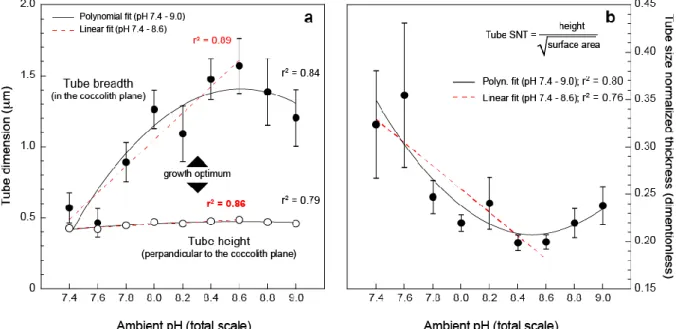
The tube height, as the thickness of the shield, both exhibit a decrease from pH 8.6 to 7.4 (r2 = 0.86; p-value < 0.005; r2 = 0.97; p-value < 0.005 for the tube and shield, respectively). For the tube, the mean values drop from 0.49 µm down to 0.42 µm over this pH range, thus representing a 14% decrease in height (or thickness). For the shields, we observed a 20% decrease with values falling from 0.39 to 0.31 µm.
3.5.3 Changes in the Tube Aspect Ratio
The axial ratio of the tube (length/width in the coccolith plane; Table 1) is found to be relatively invariant with a mean value of 1.38 ±0.01 (1 SD) combining all measurements (data not shown). This result is in line with the aforementioned study by Bollmann et al. (2010) on wild G. oceanica specimens that also reported the steady nature of the roundness –the inverse
of the axial ratio– of the central area with changing temperature and also among morphotypes
of this species.
Comparing the relative evolution of the surface area and height is not straightforward and requires normalization, as the two parameters have different dimensions. This can be achieved by introducing the SNT that corresponds to a three-dimensional aspect ratio of the tube according to equation (2). The data indicate a progressive increase in the SNT of the tube with
lowering pH from 8.6 to 7.4. Less heavily calcified tubes with more acidic ambient conditions are therefore primarily accounted for by a reduction of the breadth and therefore the surface area of this structure. Meanwhile, the height of the tube is relatively less variable (Figure 4b).
Figure 4. Dissecting the morphometric changes of the coccolith tube with changing ambient pH. (a) A bidirectional comparison between the elongation of the tube in the coccolith plane (defined as the breadth in text) and perpendicular to this direction (height or thickness). (b) The formalization of this comparison by the size normalized thickness (formula is inset top right). Overall, the data show a relative decrease of the tube breadth under lowest pH conditions.
3.6 Summary of Coccolith Changes
The diminution of calcite mass at the scale of the whole coccolith is primarily due to diminished radial extension of the tube on the 8.6 – 7.4 pH spectrum. The decrease in the mass of calcite in the tube at the highest pH (8.8 and 9.0) is due to the same morphological change within the coccoliths. Altogether, the data show that the breadth of the tube is the most sensitive parameter to pH-driven changes in intracellular calcification.
4 Discussion
4.1 Carbonate Chemistry, Cell Growth, and Calcite Quota
Calcification in coccolithophores occurs intracellularly in a highly buffered and chemically regulated microenvironment within the coccolith vesicle (Brownlee and Taylor, 2004; Taylor
et al., 2017). The link between ambient carbonate chemistry and the degree of calcification cannot be examined by the mere comparison between pH ([H+]), [CO2 aq], and the saturation state ΩCaCO3 ([CO32–]). It is well argued that unicellular eukaryotic algae are unable to source CO32– ions from the external environment. Data by Sett et al. (2014) from G. oceanica grown at 15 °C indicate a linear relationship between growth rate and µ-normalized calcite quota (equation (3)), indicating that the faster the division rate, the highest the calcification rates. It has been suggested that H+ released from calcification have a cellular function for the cell machinery, as they counterbalance basification of the microenvironment due to CO2 aq carbon fixation by photosynthesis, therefore potentially explaining the link between the rates of calcification and photosynthesis (Flynn et al., 2016). At the optimum pH that corresponds to the acclimation conditions of this strain, not only do the cells divide faster, but also each cell produced more heavily calcified coccoliths (Figure 3b). On the more basic side (pH 8.4 – 9.0), CO2aq limitation was put forward as the main factor responsible for lower division and calcification rates (Hermoso, 2015). Yet undercalcification at the lowest pH remains to be explained as the DIC resource (CO2 aq and HCO3–) are at highest concentrations.
Our data indicate that coccoliths precipitated from ambient conditions with high [CO32–] and ΩCaCO3 are undercalcified, an observation that challenges some previous reports (e.g., Beaufort et al., 2011), while it has to be acknowledged that the range of pH in our study exceeds the natural variability examined for these parameters of the carbonate system by Beaufort et al. (2011). Our finding is, however, in line with previous suggestions for the lack of a direct control by ambient CO32– on the degree of intracellular calcification (Smith et al., 2012; Young et al., 2014; Marañón et al., 2016). The apparent effect of pH on growth, calcification, and coccolith weight are asymmetrical on both sides of the optimum, suggesting that distinct mechanisms are at play under acidic and basic conditions, respectively. This contrasting behavior is apparent on Figure 5 where the combined effect of pH on calcite quota and averaged individual coccolith mass are plotted. In coccolithophores, the translocation of protons to the external milieu is allowed by the proton permeation of coccolithophore cells using voltage gated H+ channels (Suffrian et al., 2011; Taylor et al., 2011). The lower the pH, the lower the electrochemical gradient, and the less calcified coccoliths, as the efflux of protons is hampered (Figures 3b and 5). The severe decrease in calcification and coccolith mass from pH 8.2 down to 7.4 can be tentatively explained by the challenge faced by the cell to translocate protons in an environment relatively enriched in protons (Brownlee and Taylor, 2004; Suffrian et al., 2011; Brownlee et al., 2016). Yet which process of the cell machinery
related to the biomineralization toolbox is affected remains to be explored. Relevant to ocean acidification research, lowering ambient pH from 8.2 down to 7.4 leads to a decrease of 35% of the weight of the coccoliths on average that is mainly attributable to diminished calcification of the tube – a biogeochemical feature that we will discuss in the following account.
Figure 5. Comparison between inferred bulk calcification derived from the cellular growth rates of Gephyrocapsa oceanica strain RCC 1314 and average coccolith mass cultured as a function of ambient pH. Bulk calcification estimates reported in the y axis were obtained using our specific division rates and equation 3 in text. The estimates appear to be linearly correlated on the 7.4–8.4 pH range (regression not shown on the scatterplot).
4.2 Insights Into Coccolith Biomineralization
We have shown that calcification of the coccolith at the scale of the entire biomineral is not homogenously affected by change in ambient pH and induced alteration of physiologically relevant parameters. The way that the ultrastructure of the coccoliths changes among different carbonate chemistry on either side of the pH 8.2 – 8.6 optimum range is contrasting. Indeed, if the average masses of coccoliths measured for pH 7.8 and 9.0 are apparently similar, the morphometrics of the biominerals differ. The morphology of the inner parts of the coccoliths (central area and tube) is not affected by the alteration of ambient pH compared to the optimum conditions. This feature, which has been previously observed for the close relative species E. huxleyi (Bach et al., 2012), confirms that the implantation of the protococcolith
ring on the organic baseplate is not sensitive to the physiological status of the cell induced by ambient pH or CO2 aq availability. In the growth pattern of coccolithogenesis, it is the baseplate that will ultimately delimit the position of the tube in the final coccolith (Westbroek et al., 1984), and as such will control the surface area and the axial ratio of the central area. After the formation of the protococcolith ring, the radial propagation of the tube in the plane of the organic baseplate is the growth pattern that is the most altered by acidification. This feature is evidenced in our dataset by the fact that the tube becomes narrower while its elevation (height or thickness) remains unchanged at lowest pH compared to normal coccolith specimens. Thus, the SNT or three-dimensional axial ratio of the tube (equation (2)) is at a maximum at the lowest pH, indicating that radial expansion of the calcite within this structure is impaired by acidification, while the distal elongation of the crystals (height) is relatively unchanged.
From a crystallographic perspective, the tube expands distally perpendicular to the direction of the c axis. Hence, new calcite forms from the obtuse kink sites, whereas radial propagation is made with crystal elongating in the direction of the c axis. This crystallographic difference represents a possible explanation for the change in morphology of the tube related to the biomineralizing molecules. The organic compounds, and specifically acidic polysaccharides in coccolithophores, have a stereochemical function on substrate-crystal interfaces for calcite nucleation and dictate the overall and fine-scale organization of the biomineral (Borman et al., 1982; Westbroek et al., 1989; Borman et al., 2007; Giuffre et al., 2013; Lee et al., 2016). Studies by Henriksen et al. (2004) and Payne et al. (2008) experimentally showed that the role of acidic polysaccharides was to block the acute surface kinks, promoting growth of faces with lower angles to the c axis. Thus, the relative inhibition of the radial expansion of the tube (breadth) through calcification on acute kinks can arise from higher activity of the acidic polysaccharides under more acidic conditions microlocally at the site of calcification. Indeed, polysaccharides operate a control on biomineralization using an acid binding function of Ca2+ ions. It was recently suggested that the polysaccharide charge density, which arguably relates to ambient H+ concentrations, exerts a control on calcite precipitation in coccolithophores (Lee et al., 2016). This hypothesis would imply that biomineralization is adversely affected by the metabolic load of protons released incrementally from calcification, and that the relationship between site specific attachment to crystallographic steps, growth patterns, and ultimately ultrastructure are highly influential on the bulk sensitivity of calcification within the biominerals.
Radial growth of the shields mostly corresponds to the widening of crystals that have a c axis in the direction of the elongation of the crystal. We did not observe such a significant decrease of surface area of the shield at the lowest pH compared to the tube. However, still from a crystallographic point of view, calcite of the elements forming the shield has comparable orientation of their c-axis than the crystals grown radially within the tube. Under optimal growth and calcification conditions between pH 8.2 and 8.6 (Figure 1b) and equation (3), the mass of calcite constituting the tube and the shields are relatively similar (around 7 to 8 pg per coccolith). The shields do not exhibit significant changes in their appearance, nor in the absolute mass of calcite when pH decreases from 8.2 to 7.4. This feature indicates that this component of the coccolith is not affected by the acidification of the culture medium conversely to the tube (CaCO3 greater than unity for all conditions). From this, it emerges that change in the degree of calcification of the coccoliths grown in relatively low pH conditions cannot be accounted for by post mortem dissolution of coccolith calcite. This conclusion is also supported by the lack of significant dissolution features of the coccoliths observed under the SEM.
4.3 Implications for Naturally Occurring Assemblages
The degree and rate of calcification by the coccolithophores estimated from the analyses of wild assemblages reflect a mixed population signal. Altogether the individuals forming such populations in the water column or coccoliths in sediments have, by essence, greater plasticity and a potential adaptation to environmental changes compared to the clones grown during short term experiments in the laboratory. Specific to calcification, this feature is evidenced by distinct optima (division and calcification rates) by morphotypes of E. huxleyi and G.
oceanica subjected to perturbation experiments (Blanco-Ameijeiras et al., 2016; Hermoso et
al., 2016). In the natural environment, analyses of the morphometrics of coccoliths and estimates of calcification state through time series therefore reflect changes in the nannofloral composition transcending the strain specific level (Beaufort et al., 2011). Climate changes and particularly ongoing oceanic acidification favor the most adapted morphotypes (Blanco-Ameijeiras et al., 2016; Rickaby et al., 2016). Studies by Beaufort et al. (2011) and Smith et
al. (2012) have shown the occurrence of heavily calcified E. huxleyi coccoliths at relatively
low pH and low ΩCaCO3. In our study, such a pattern is not observed on cultured G. oceanica, but this response has to be regarded as a snapshot of the plasticity of calcification.
Two key studies have constrained the calcification state at the scale of the gephyrocapsid coccoliths in core top sediments from a wide array of biogeographical and climatic realms (Bollmann et al., 2002; Bollmann et al., 2010). Our study reveals that strain specific plasticity (calcification and biometric parameters, such as the axial ratio) exceeds the range of variability within the morphotypes Large of naturally occurring G. oceanica and laboratory specimens cultured at distinct temperatures. In both cases, temperature had relatively little effect on calcification compared to the larger scale perturbation of the environment induced by changes in the carbonate chemistry (and pH). The difference between these studies lies on the relatively small variability of the environment and in particular the status of carbonate chemistry of seawater compared to the substantial alteration of these parameters applied in our study.
Another line of evidence that carbonate chemistry exerts a primary control on calcification in
G. oceanica originates from thestudy by Beaufort et al. (2011), who have shown a decrease in the average weight by 25% since the last glacial maximum. Inference of seawater pH during the LGM is not straightforward, yet boron isotope measurements from planktonic foraminifera indicate a value nearing 8.4 in the surface waters (Foster, 2008). The pH offset between the LGM and modern values thus correspond to a drop by 0.3 pH units, which is indeed accompanied by decreased calcification of G. oceanica in our results. At face value using the linear regression line shown in Figure 5, our data indicate a loss by 10% in the averaged weight of G. oceanica coccoliths. Although such a comparison between sedimentary and culture data may be biased by many environmental factors (Hermoso et al., 2015), it appears that the intrinsic plasticity within a given strain is insufficient to account for the variations observed in fossil (downcore sediments) and subfossil (core tops) assemblages. Beaufort et al. (2011) have suggested that coccolith mass can be used as a proxy for calcification. From our single strain study, although it has to be mentioned that the inter strain response to environmental perturbation within G. oceanica is relatively minor compared to E.
huxleyi, we can infer that such a correlation is only observed between pH 7.4 and 8.2 (Figure
5). Within the supposed range of seawater pH values that we can infer across glacial/interglacial cycles (8.4 to 8.1; see discussion above), we do not observe any correlation between inferred bulk calcification and average coccolith mass, leaving the number of coccolith produced per cell the most likely controlling parameter of coccolithophorid biomineralization in more saturated waters.
5 Conclusion
We have shown that the link between [CO32–]and calcification in coccolithophore is only apparent and is best explained by the covariation between ambient concentrations of protons and aqueous CO2. Calcification optima for G. oceanica are obtained at pH 8.4 and 8.6. Both at relatively higher and lower pH values, we observe a decrease in the ability of this species to calcify, as reflected by the reduced coccolith mass of individual specimens. This change is more pronounced in acidic than in basic conditions when considering the optimum at pH 8.6 as a reference. From pH 8.6 down to 7.4, a range encompassing Cenozoic conditions, the coccoliths exhibit a loss of 35% of their average mass, primarily due to a reduction in the breadth of the tube of the coccoliths. Intrinsically to intracellular biomineralization in the coccolithophore G. oceanica, fine-scale observations within the coccolith indicate that radially grown calcite in the direction of the crystallographic c axis is the most affected growth pattern as a result of presumed elevated proton concentrations in the coccolith vesicle, and we have hypothesized that this crystallochemical feature can result from changing Ca2+ -binding ability of the acidic polysaccharides. By contrast, all the parameters set by the calcite nucleation of the protococcolith (hence the two-dimensional morphology of the central area) are insensitive to environmental changes, and as such can be regarded as under a strict control of the biomineralization toolbox. An implication of our work is that the morphometrics of central area and of the tube can be used as a supplementary biometric tool to explore the genotypic variability within Noëlaerhabdaceae coccoliths, as they convey a genetic signal, and are insensitive to post mortem and diagenetic alteration compared to the whole coccoliths and especially the shields, which are more classically measured.
The increasing use of birefringence color to determine the plasticity of calcification in a grain-to-globe approach in literature warrants a unified effort in the community to establish a unique calibration overcoming existing limitations with a view to allow meaningful interlaboratory comparisons. We also call for future biological work that will have to test the effect of proton concentrations in the coccolith vesicle by, for example, perturbing the organic molecules enabling intracellular calcification by the coccolithophores. This could be achieved through inhibition of transmembrane proton channels or by the perturbation of the capability of acidic polysaccharides – the latter would be implementable by inorganic precipitation experiments as a first, yet valuable step.
Acknowledgements
We are very grateful to Amélie Guittet (Sorbonne Université, Paris) for assistance in smear slide preparation and to Pascal Huang (Undergraduate research assistant at Sorbonne Université) for help with the acquisition and digital processing of the images. Omar Boudouma and Alexandre Lethiers (both at Sorbonne Université) are warmly thanked for running the SEM and advices in figure drafting, respectively. We are also grateful to Ian Probert (Station Biologique de Roscoff, France) for providing the strain of Gephyrocapsa
oceanica. The authors thank two anonymous reviewers for valuable inputs. MH
acknowledges financial support from the French National Research Agency (ANR) – Project “CARCLIM” under reference ANR-17-CE01-0004. Both authors are grateful to the CNRS-INSU Program INTERRVIE for financial support (Project “PRO-KIeC”) and to the host Research Unit (Institut des Sciences de la Terre de Paris, UMR SU-CNRS 7193) for funds attributed within the Coup de Pouce scheme to set up the culture labs. All the data generated in this study are provided in Table 2 and as Supporting Information Data Set S1.
References
Aloisi G. (2015) Covariation of metabolic rates and cell size in coccolithophores.
Biogeosciences 12, 4665–4692.
Bach L. T., Bauke C., Meier K. J. S., Riebesell U. and Schulz K. G. (2012) Influence of changing carbonate chemistry on morphology and weight of coccoliths formed by Emiliania huxleyi. Biogeosciences 9, 3449–3463.
Beaufort L. (2005) Weight estimates of coccoliths using the optical properties (birefringence) of calcite. Micropaleontology 51, 289–297.
Beaufort L., Barbarin N. and Gally Y. (2014) Optical measurements to determine the thickness of calcite crystals and the mass of thin carbonate particles such as coccoliths.
Nat. Protoc. 9, 633–642.
Beaufort L., Probert I., de Garidel-Thoron T., Bendif E. M., Ruiz-Pino D., Metzl N., Goyet C., Buchet N., Coupel P., Grelaud M., Rost B., Rickaby R. E. M. and de Vargas C. (2011) Sensitivity of coccolithophores to carbonate chemistry and ocean acidification.
Nature 476, 80–83.
Blanco-Ameijeiras S., Lebrato M., Stoll H. M., Iglesias-Rodriguez D., Müller M. N., Méndez-Vicente A. and Oschlies A. (2016) Phenotypic Variability in the Coccolithophore Emiliania huxleyi. PLoS One 11, e0157697.
Bollmann J. (2014) Technical Note: Weight approximation of coccoliths using a circular polarizer and interference colour derived retardation estimates (The CPR Method).
Biogeosciences 11, 1899–1910.
Bollmann J., Henderiks J. and Brabec B. (2002) Global calibration of Gephyrocapsa coccolith abundance in Holocene sediments for paleotemperature assessment.
Bollmann J., Klaas C. and Brand L. E. (2010) Morphological and Physiological Characteristics of Gephyrocapsa oceanica var. typica Kamptner 1943 in Culture Experiments: Evidence for Genotypic Variability. Protist 161, 78–90.
Borman A. H., Jong E. W., Huizinga M., Kok D. J., Westbroek P. and Bosch L. (1982) The Role in CaCO3 Crystallization of an Acid Ca2+-Binding Polysaccharide Associated with Coccoliths of Emiliania huxleyi. Eur. J. Biochem. 129, 179–183.
Borman A. H., Jong E. W., Thierry R., Westbroek P., Bosch L., Gruter M. and Kamerling J. P. (2007) Coccolith-associated polysaccharides from cells of Emiliania huxleyi (Haptophyceae). J. Phycol. 23, 118–123.
Brownlee C. & Taylor A. (2004) Calcification in coccolithophores: A cellular perspective. In
Coccolithophores Springer Berlin Heidelberg, Berlin, Heidelberg. pp. 31–49.
Brownlee C., Wheeler G. L. and Taylor A. R. (2016) Coccolithophore biomineralization: New questions, new answers. Semin. Cell Dev. Biol. 46, 11–16.
Doney S. C., Fabry V. J., Feely R. A. and Kleypas J. A. (2009) Ocean Acidification: The Other CO2 Problem. Ann. Rev. Mar. Sci. 1, 169–192.
Flynn K. J., Clark D. R. and Wheeler G. (2016) The role of coccolithophore calcification in bioengineering their environment. Proc. R. Soc. B 283, 20161099.
Foster G. L. (2008) Seawater pH, pCO2 and [CO2−3] variations in the Caribbean Sea over the last 130 kyr: A boron isotope and B/Ca study of planktic foraminifera. Earth Planet. Sci.
Lett. 271, 254–266.
Fuertes M. A., Flores J. A. and Sierro F. J. (2014) The use of circularly polarized light for biometry, identification and estimation of mass of coccoliths. Mar. Micropaleontol. 113, 44–55.
Giuffre A. J., Hamm L. M., Han N., Yoreo J. J. De, Dove P. M. and De Yoreo J. J. (2013) Polysaccharide chemistry regulates kinetics of calcite nucleation through competition of interfacial energies. Proc. Natl. Acad. Sci. U. S. A. 110, 9261–9266.
Henriksen K., Stipp S. L. S., Young J. R. and Marsh M. E. (2004) Biological control on calcite crystallization: AFM investigation of coccolith polysaccharide function. Am.
Mineral. 89, 1709–1716.
Hermoso M. (2015) Control of ambient pH on growth and stable isotopes in phytoplanktonic calcifying algae. Paleoceanography 30, PA002844.
Hermoso M., Candelier Y., Browning T. J. and Minoletti F. (2015) Environmental control of the isotopic composition of subfossil coccolith calcite: Are laboratory culture data transferable to the natural environment? GeoResJ 7, 35–42.
Hermoso M., Minoletti F., Aloisi G., Bonifacie M., McClelland H. L. O., Labourdette N., Renforth P., Chaduteau C. and Rickaby R. E. M. (2016) An explanation for the 18O excess in Noelaerhabdaceae coccolith calcite. Geochim. Cosmochim. Acta 189, 132–142. Hoppe C. J. M., Langer G. and Rost B. (2011) Emiliania huxleyi shows identical responses to
elevated pCO2 in TA and DIC manipulations. J. Exp. Mar. Bio. Ecol. 406, 54–62.
Iglesias-Rodriguez M. D., Halloran P. R., Rickaby R. E. M., Hall I. R., Colmenero-Hidalgo E., Gittins J. R., Green D. R. H., Tyrrell T., Gibbs S. J., von Dassow P., Rehm E., Armbrust E. V. and Boessenkool K. P. (2008) Phytoplankton calcification in a high-CO2 world. Science 320, 336–340.
Keller M. D., Selvin R. C., Claus W. and Guillard R. R. L. (1987) Media for the culture of oceanic ultraphytoplankton. J. Phycol. 23, 633–638.
Koch C. & Young J. R. (2007) A simple weighing and dilution technique for determining absolute abundances of coccoliths from sediment samples. J. Nannoplankt. Res. 29, 67– 69.
Langer G., Probert I. and Ziveri P. (2011) The morphological response of Emiliania huxleyi to seawater carbonate chemistry changes : an inter-strain comparison. J. Nannoplankt.
Res. 32, 29–34.
Lee R. B. Y., Mavridou D. A. I., Papadakos G., McClelland H. L. O. and Rickaby R. E. M. (2016) The uronic acid content of coccolith-associated polysaccharides provides insight into coccolithogenesis and past climate. Nat. Commun. 7, 13144.
Linge Johnsen S. & Bollmann J. (2017) Interactive comment on “An empirical method for absolute calibration of coccolith thickness” by Saúl González-Lemos et al.
Biogeosciences Discuss., C1–C10, doi.org/10.5194/bg-2017-249-SC3
Marañón E. (2014) Cell Size as a Key Determinant of Phytoplankton Metabolism and Community Structure. Ann. Rev. Mar. Sci. 7, 241-264.
Marañón E., Balch W. M., Cermeño P., González N., Sobrino C., Fernández A., Huete-Ortega M., López-Sandoval D. C., Delgado M., Estrada M., Álvarez M., Fernández-Guallart E. and Pelejero C. (2016) Coccolithophore calcification is independent of carbonate chemistry in the tropical ocean. Limnol. Oceanogr. 61, 1345–1357.
McClelland H. L. O., Barbarin N., Beaufort L., Hermoso M., Ferretti P., Greaves M. and Rickaby R. E. M. (2016) Calcification response of a key phytoplankton family to millennial-scale environmental change. Sci. Rep. 6, 34263.
Müller M. N., Trull T. W. and Hallegraeff G. M. (2017) Independence of nutrient limitation and carbon dioxide impacts on the Southern Ocean coccolithophore Emiliania huxleyi.
ISME J. 11, 1777-1787.
Payne V. E., Rickaby R. E. M., Benning L. G. and Shaw S. (2008) Calcite crystal growth orientation: implications for trace metal uptake into coccoliths. Mineral. Mag. 72, 269– 272.
Rickaby R. E. M., Henderiks J. and Young J. N. (2010) Perturbing phytoplankton: response and isotopic fractionation with changing carbonate chemistry in two coccolithophore species. Clim. Past 6, 771–785.
Rickaby R. E. M., Hermoso M., Lee R. B. Y., Rae B. D., Heureux A. M. C., Balestreri C., Chakravarti L., Schroeder D. and Brownlee C. (2016) Environmental carbonate chemistry selects for phenotype of recently isolated strains of Emiliania huxleyi. Deep.
Res. Part II 127, 28–40.
Ridgwell A. (2005) A Mid Mesozoic Revolution in the regulation of ocean chemistry. Mar.
Geol. 217, 339–357.
Riebesell U., Bach L. T., Bellerby R., Monsalve J. R. B., Boxhammer T., Czerny J., Larsen A., Ludwig A. and Schulz K. (2016) Competitive fitness of a predominant pelagic calcifier impaired by ocean acidification. Nat. Geosci. 10, 19–23.
Riebesell U., Zondervan I., Rost B., Tortell P. D., Zeebe R. E. and Morel F. M. M. (2000) No Title. Nature 407, 364–367.
Schindelin J., Arganda-Carreras I., Frise E., Kaynig V., Longair M., Pietzsch T., Preibisch S., Rueden C., Saalfeld S., Schmid B., Tinevez J.-Y., White D. J., Hartenstein V., Eliceiri K., Tomancak P. and Cardona A. (2012) Fiji: an open-source platform for biological-image analysis. Nat. Methods 9, 676–682.
Sett S., Bach L. T., Schulz K. G., Koch-Klavsen S., Lebrato M. and Riebesell U. (2014) Temperature Modulates Coccolithophorid Sensitivity of Growth, Photosynthesis and Calcification to Increasing Seawater pCO2. PLoS One 9, e88308.
Sigman D. M. & Boyle E. A. (2000) Glacial/interglacial variations in atmospheric carbon dioxide. Nature 407, 859–869.
Smith H. E. K., Tyrrell T., Charalampopoulou A., Dumousseaud C., Legge O. J., Birchenough S., Pettit L. R., Garley R., Hartman S. E., Hartman M. C., Sagoo N., Daniels C. J., Achterberg E. P. and Hydes D. J. (2012) Predominance of heavily calcified coccolithophores at low CaCO3 saturation during winter in the Bay of Biscay. Proc.
Suffrian K., Schulz K. G., Gutowska M. A., Riebesell U. and Bleich M. (2011) Cellular pH measurements in Emiliania huxleyi reveal pronounced membrane proton permeability.
New Phytol. 190, 595–608.
Taylor A. R., Brownlee C. and Wheeler G. (2017) Coccolithophore Cell Biology: Chalking Up Progress. Ann. Rev. Mar. Sci. 9, 283–310.
Taylor A. R., Chrachri A., Wheeler G., Goddard H. and Brownlee C. (2011) A voltage-gated H+ channel underlying pH homeostasis in calcifying coccolithophores. PLoS Biol. 9, e1001085.
Westbroek P., de Jong E. W., van der Wal P., Borman A. H., de Vrind J. P. M., Kok D., de Bruijn W. C. and Parker S. B. (1984) Mechanism of calcification in the marine alga
Emiliania huxleyi [and Discussion]. Philos. Trans. R. Soc. B Biol. Sci. 304, 435–444.
Westbroek P., Young J. R., Linschooten K., Westbroeck P., Young J. R. and Linschooten K. (1989) Coccolith production (biomineralization) in the marine alga Emiliania huxleyi. J.
Protozool. 36, 368–373.
Young J. R., Didymus J. M., Brown P. R., Prins B. and Mann S. (1992) Crystal assembly and phylogenetic evolution in heterococcoliths. Nature 356, 516–518.
Young J. R., Poulton A. J. and Tyrrell T. (2014) Morphology of Emiliania huxleyi coccoliths on the northwestern European shelf – is there an influence of carbonate chemistry?
Biogeosciences 11, 4771–4782.
Supplementary Information