HAL Id: hal-00002802
https://hal.archives-ouvertes.fr/hal-00002802
Submitted on 8 Sep 2004
HAL is a multi-disciplinary open access
archive for the deposit and dissemination of
sci-entific research documents, whether they are
pub-lished or not. The documents may come from
teaching and research institutions in France or
abroad, or from public or private research centers.
L’archive ouverte pluridisciplinaire HAL, est
destinée au dépôt et à la diffusion de documents
scientifiques de niveau recherche, publiés ou non,
émanant des établissements d’enseignement et de
recherche français ou étrangers, des laboratoires
publics ou privés.
HCN and HCO+ emission in the disk of M31
N. Brouillet, Sébastien Muller, Fabrice Herpin, J. Braine, T. Jacq
To cite this version:
N. Brouillet, Sébastien Muller, Fabrice Herpin, J. Braine, T. Jacq. HCN and HCO+ emission in
the disk of M31. Astronomy and Astrophysics - A&A, EDP Sciences, 2005, 429, pp.153-159.
�hal-00002802�
ccsd-00002802, version 1 - 8 Sep 2004
(DOI: will be inserted by hand later)
HCN and HCO
+
emission in the disk of M 31
N. Brouillet
1, S. Muller
2,3
, F. Herpin
1, J. Braine
1, and T. Jacq
11 Observatoire de Bordeaux, Universit´e Bordeaux 1- CNRS, B.P. 89, F-33270 Floirac, France.
e-mail: [email protected]
2 IRAM, 300 rue de la Piscine, F-38406 Saint-Martin d’H`eres, France.
3 Institute of Astronomy and Astrophysics, Academia Sinica. P.O. Box 23-141, Taipei 106, Taiwan.
e-mail: [email protected]
Received 19 September 2003 / Accepted 3 September 2004
Abstract.We report observations made with the IRAM 30 m radiotelescope in the HCN(1–0) and HCO+(1–
0) lines towards a sample of molecular complexes (GMCs) in the disk of the Andromeda galaxy (M 31). The targets were identified bright CO GMCs selected from the IRAM 30 m CO survey with various morphologies and environments. The clouds vary in galactocentric distances from 2.4 to 15.5 kpc. The HCN and HCO+ emission
is easily detected in almost all observed positions, with line widths generally similar to the CO ones and there is a good correlation between the two dense gas tracers. The HCO+ emission is slightly stronger than the HCN, in
particular towards GMCs with a strong star formation activity. However the HCO+emission is weaker than the HCN towards a quiescent cloud in the inner part of M 31, which could be due to a lower abundance of HCO+. We
derive IHCN/ICOratios between 0.008 and 0.03 and IHCO+/ICOratios between less than 0.003 and 0.04. We study
the radial distribution of the dense gas in the disk of M 31. Unlike our Galaxy the HCO+/CO ratio is lower in
the center of M 31 than in the arms, which can be explained by both a lower abundance of HCO+ and different
conditions of excitation. Furthermore the HCN/CO and HCO+/CO ratios appear to be higher in the inner spiral arm and weaker in the outer arm.
Key words.ISM: clouds – ISM: molecules – Galaxies: individual: M 31 – Galaxies: ISM
1. Introduction
The molecular gas in galactic centers has been investi-gated through multi-molecule studies (e.g. Henkel et al. 1991) but most of our knowledge about the molecular gas in the disks of external galaxies until now is only based on CO observations. In our Galaxy a few key molecules are used to obtain complementary information on the physi-cal and chemiphysi-cal state of the insterstellar medium and its radial distribution. HCN and HCO+are among these key
molecules because their rotational line emission is rather strong and, due to their large dipolar moment (µ = 2.98 and 4.48 Debye respectively) but similar frequencies, they are excited in physical conditions different from those of CO (µ = 0.1 Debye). In particular, the critical density to collisionally excite the 1–0 transitions of HCN and HCO+
is much higher (n ∼ 105−6 cm−3) than that required for
the CO(1–0) transition (n ∼ 103 cm−3). Both molecules
are linear and have similar properties except the fact that HCO+ being an ion is expected to have a different
chem-ical behaviour. Because stars condense out of the densest
Send offprint requests to: Nathalie Brouillet, e-mail: [email protected]
material, the dense gas tracers (e.g. HCN, HCO+) may
provide the best link with star formation. In IR-luminous galaxies, HCN is found to be much better correlated with the star formation rate than the CO (Solomon et al. 1992). One can wonder if a similar relationship exists within disks when the dense gas tracers are observed.
With the much improved sensitivity of millimeter ra-diotelescopes, it is now possible to observe the HCN and HCO+ emissions towards external galaxies. Numerous
studies have been made towards galactic nuclei (e.g. Brouillet & Schilke 1993; Chin et al. 1997; Curran et al. 2000; Helfer & Blitz 1997a; H¨uttemeister et al. 1995; Nguyen-Q-Rieu et al. 1992; Paglione et al. 1997; Seaquist & Frayer 2000) but studies of galactic disks are very few. Braine et al. (1997) observed a few positions in the HCN line along the major axis of NGC 4414. HCN emission is detected in the spiral arms, out to 3.5 kpc, but not in the interarms of M 51 (Kuno et al. 1995; Kohno et al. 1996). Sorai et al. (2002) recently observed HCN along the ma-jor axes of six nearby CO bright galaxies, but out to 1kpc only. Our goal is to extend our knowledge of the dense gas further out in galactic disks.
2 N. Brouillet et al.: HCN and HCO+ emission in the disk of M 31
We have observed the HCN and HCO+ emission in
the disk of the closest large spiral galaxy, M 31. The re-cent high-resolution CO(1–0) survey made with the IRAM 30 meter radiotelescope (Gu´elin et al. 2000, Nieten et al. in prep.) allowed identification of the Giant Molecular Clouds (GMCs) in M 31 (spatial resolution of 23′′, i.e.
∼ 90 pc) and mapped the distribution of these GMCs in the disk of the galaxy. In addition, detailed CO(1–0) and CO(2–1) observations have been performed with the IRAM Plateau de Bure Interferometer (PdBI) on a sample of GMCs with various morphologies in different environ-ments and located at galactic radii between 5 and 18 kpc (Neininger 2000, Muller 2003). These GMCs, which have similar CO emission on the 90 pc scale, reveal very differ-ent structures with the higher resolution of the PdBI (∼ 4 pc). We have selected a few GMCs from the IRAM 30 m survey in order to detect HCN and HCO+ emission.
In this paper we present the results of our observa-tions and we compare the ratios between the 3 species HCN, HCO+ and CO measured in the molecular
com-plexes with different physical properties and at different galactocentric distances. We study the fraction of dense molecular gas (Sect. 4) and the radial distribution of the dense gas (Sect. 5) in the disk of M 31, compared to our Galaxy and other galaxies.
2. Observations
The adopted parameters for M 31 are: center posi-tion α1950 = 00h40m00 .s3, δ1950 = 41◦00′03′′ (α2000 =
00h42m44 .s32, δ
2000= 41◦16′08 .′′5); an inclination with
re-spect to the plane of the sky of 77 .◦5; a distance of 780 kpc
(Stanek & Garnavich 1998).
HCN(1–0) and HCO+(1–0) line observations at
88.6 GHz and 89.2 GHz were carried out towards M 31 with the IRAM 30 m radiotelescope in April, May and October 2002 and in June 2004. The half power beamwidth was 27 .′′5, corresponding to a spatial
resolu-tion of 104 pc at the distance of M 31. The pointing was regularly checked on nearby quasars and the absolute cor-rection was ≤ 5′′. In order to obtain flat baselines, we
used a wobbler switching procedure with a reference po-sition 4′ offset from the source in azimuth. The CO(2–1)
line was observed simultaneously to check that there was no emission at the same velocity in the reference position. We used two SIS receivers in parallel when observing each line separately. The system temperatures ranged from 80 to 150 K. The temperatures were scaled in main beam temperatures with values of the beam efficiency and the forward efficiency at these frequencies of 0.77 and 0.95 re-spectively. Two 1 MHz filterbanks and an autocorrelator gave velocity resolutions of 3.4 and 1.1 km s−1
respec-tively.
3. Results
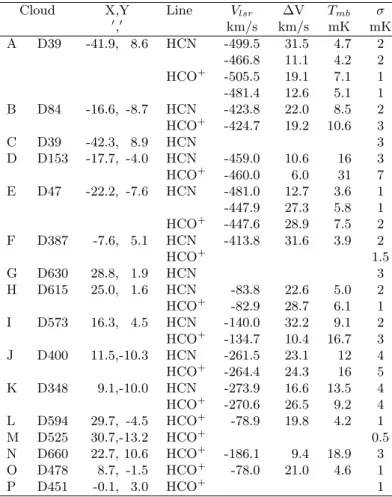
We have observed 16 GMCs (noted from A to P) located in the spiral arms of M 31. Figure 1 shows the position of
Table 1. Column 1 is the name (letter) of the observed position followed, in column 2, by Hodge’s number for the corresponding dark clouds (Hodge 1980). In column 3, X and Y are the offsets from the center along, respectively, the major and minor axes of M 31. Column 4 indicates the observed lines. Columns 5 to 7 are the spectral parameters derived from a gaussian fit of the HCN and HCO+
spec-tra: line velocity, half power line width and main beam antenna temperature. Column 8 is the rms of the spectra. The conversion factor from Kelvin (main beam scale) to Jansky for the 30 m radiotelescope at these frequencies is 4.7 Jy/K.
Cloud X,Y Line Vlsr ∆V Tmb σ
′,′ km/s km/s mK mK A D39 -41.9, 8.6 HCN -499.5 31.5 4.7 2 -466.8 11.1 4.2 2 HCO+ -505.5 19.1 7.1 1 -481.4 12.6 5.1 1 B D84 -16.6, -8.7 HCN -423.8 22.0 8.5 2 HCO+ -424.7 19.2 10.6 3 C D39 -42.3, 8.9 HCN 3 D D153 -17.7, -4.0 HCN -459.0 10.6 16 3 HCO+ -460.0 6.0 31 7 E D47 -22.2, -7.6 HCN -481.0 12.7 3.6 1 -447.9 27.3 5.8 1 HCO+ -447.6 28.9 7.5 2 F D387 -7.6, 5.1 HCN -413.8 31.6 3.9 2 HCO+ 1.5 G D630 28.8, 1.9 HCN 3 H D615 25.0, 1.6 HCN -83.8 22.6 5.0 2 HCO+ -82.9 28.7 6.1 1 I D573 16.3, 4.5 HCN -140.0 32.2 9.1 2 HCO+ -134.7 10.4 16.7 3 J D400 11.5,-10.3 HCN -261.5 23.1 12 4 HCO+ -264.4 24.3 16 5 K D348 9.1,-10.0 HCN -273.9 16.6 13.5 4 HCO+ -270.6 26.5 9.2 4 L D594 29.7, -4.5 HCO+ -78.9 19.8 4.2 1 M D525 30.7,-13.2 HCO+ 0.5 N D660 22.7, 10.6 HCO+ -186.1 9.4 18.9 3 O D478 8.7, -1.5 HCO+ -78.0 21.0 4.6 1 P D451 -0.1, 3.0 HCO+ 1
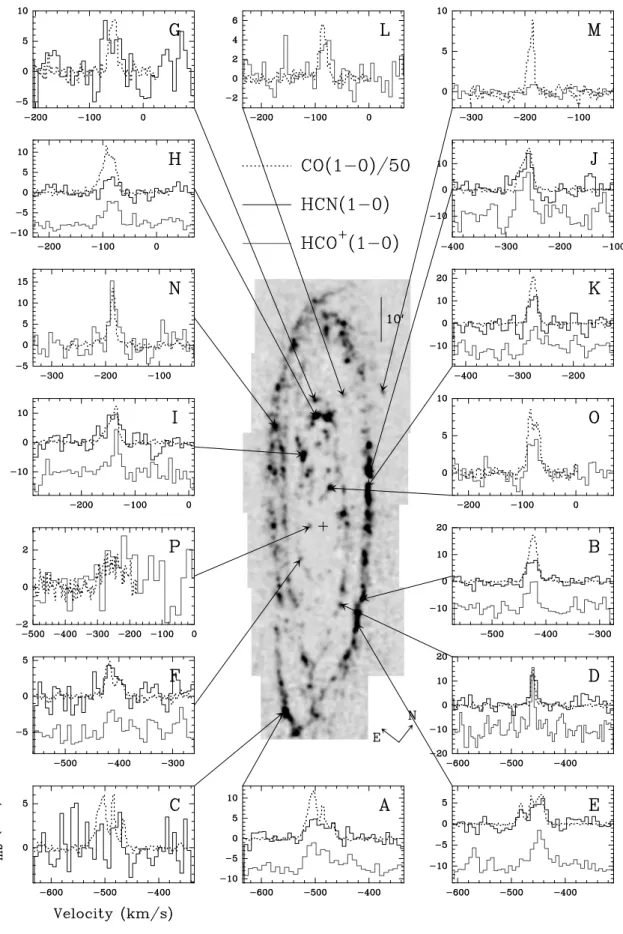
the observed GMCs in the galaxy as well as the HCN(1–0) and HCO+(1–0) spectra displayed with the corresponding
CO(1–0) spectra. The HCN and HCO+ line parameters
derived from the observations are indicated in Table 1, and the HCN and HCO+ integrated intensities in Table
2. Four positions only (C, G, M and P ) are not detected; 11 positions were observed in HCN, 9 of them are de-tected; 14 positions were observed in HCO+, 11 of them
are detected. The non detected positions may only be due to a low signal-to-noise ratio in the spectra (positions G, M, P are at the limit of detection).
The sample of the observed regions consists of GMCs located in the inner spiral arm (R∼ 5 − 7 kpc): D, F, G, H, I, and in the outer spiral arm (R∼ 9 − 13 kpc): A, B,
Fig. 1. The map is the CO(1–0) integrated intensity observed with the 30 m telescope and smoothed to a resolution of 45′′ (Nieten et al. in prep.). The arrows indicate the observed positions in the galaxy. The HCN(1–0), HCO+(1–0)
and CO(1–0) spectra are displayed; the HCO+ spectra are shifted in intensities for a better comparison when the
HCN spectra are present. The CO(1–0) spectra are convolved to the same spatial resolution as the HCN and HCO+
4 N. Brouillet et al.: HCN and HCO+ emission in the disk of M 31
C, E, J, K, N; one GMC (L) is in the interarm and one GMC (M) is located in the outer disk at a large radius (15.5 kpc); two GMCs are near the center: P at 3.1 kpc and O (detected first by Allen & Lequeux 1993) at 2.4 kpc. The sample covers different environments: isolated clouds (D, L), quiescent cloud (F), GMCs with signs of recent star formation like large HII regions (A, E, H, I, J, K, N). The GMCs display different structures as revealed by the single dish CO observations (narrow lines, multiple profiles) and by the interferometric CO observations for those observed with the PdBI (compact structures, several clumps, filaments). Our observations show that HCN and HCO+ emission is easily detected in the GMCs in the
inner and the outer spiral arms as well as in different kinds of molecular complexes; it is detected in the center and in the interarm where the CO emission is weak and it is marginally detected at a large radius.
Taking into account the noise, the line widths are very similar in HCN, HCO+ and CO and the line profiles of
the HCN and HCO+ emissions as well. This implies that
they trace gas from the same physical regions. On the ob-served scale, the line widths do not trace the gravitational potential of the galaxy but the dynamics of the clouds. The similarity of line widths for the different molecules reflects the same velocity dispersion for the different emis-sion regions within the beam. One possible explanation is a fractal scheme where dense or moderately dense con-densations are widespread in the complex. Helfer & Blitz (1997b) also find the same line widths and line shapes for the HCN and CS features of their Milky Way plane survey, when compared to the corresponding CO emis-sion. However, Pirogov (1999), in his sample of bright FIR sources, find that the HCN and HCO+ line widths
are close to each other but lower than those of CO. For the 8 GMCs detected in both HCN and HCO+,
the HCO+ integrated emission is slightly stronger than
the HCN emission, with an average of IHCO+ ∼1.2 IHCN.
Studies in our Galaxy and external galaxies show that the overall HCN, HCO+ and CO emission is generally similar
but with different line ratios and the IHCO+/IHCN ratio
seems to vary from galaxy to galaxy. It is slightly lower than 1 in our Galaxy where Pirogov (1999) find a mean value of 0.6±0.4, the ratio being a bit higher when data for dark clouds, small globules and cirrus cores are added to the bright FIR sources. He finds a strong correlation be-tween the integrated intensities of HCN, HCO+, CS and
NH3, four molecules considered as high density tracers.
Turner & Thaddeus (1977) also observe a good correlation between HCN and HCO+ brightnesses towards Galactic
giant molecular clouds, the two species having quite sim-ilar distributions; they find that the line widths are often different but their observations are on a scale smaller than the GMCs. The HCN and HCO+ integrated lines have
also about the same strengths in NGC 4945 (ratio of 0.93, Henkel et al. 1990) and in NGC 253 (ratio of 0.9, Nguyen-Q-Rieu et al. 1989). However the IHCO+/IHCNratio varies
from 2 to less than 0.25 in the sample of 15 galaxies ob-served by Nguyen-Q-Rieu et al. (1992), the highest ratio
corresponding to M 82. A five point map in M 82 (Nguyen-Q-Rieu et al. 1989) shows that the ratio is 2 in the center and decreases down to 1.4 30′′ further on. In fact, when
observing the center of M 82 on the molecular cloud scale (2′′, i.e. 30 pc), the variations range from 0.75 to 3
de-pending on the molecular clouds (Schilke & Brouillet, un-published). Such a high ratio (from 1.3 to more than 3.6) is also found by Chin et al. (1997) towards HII regions in the Magellanic Clouds. A high ratio is consistent with a brighter HCO+emission due to the intense ionization flux
from supernovae and young stars, with a large extent of the HCO+ emission region and HCN coming from dense
cloud cores.
HCN and HCO+ are both linear molecules
contain-ing one atom of hydrogen and two ”metals”. Their dipole moments are quite similar, the frequencies of the transi-tions are almost identical, HCN and HCO+ are excited
collisionally by H2 (Seaquist & Frayer (2000) show that
no other mechanism is needed for the excitation of HCO+
in the clouds of M 82), and if the abundances are esti-mated to be similar, it is not surprising that globally the HCN and HCO+ line intensities are on the same order
on the observed GMCs’ scale. However variations in the IHCO+/IHCNratio exist from galaxies to galaxies and from
GMCs to GMCs. These variations may be due to vari-ations in density. For example, simple LVG calculvari-ations show that HCO+ emission is thermalized at lower density
than HCN, thus densities of 105 cm−3 and column
densi-ties of roughly 1015cm−2 may be sufficient to thermalize
HCO+, i.e. maximize the HCO+intensities, but are quite
yet low for HCN. Observations of higher excitation lines are needed now to estimate the densities and the effect of their variations on the line ratios.
The variations in the HCO+/HCN intensity ratio may
also be due to variations in the abundance ratio due to differences in the ambiant radiation field. Unlike HCN, the abundance of HCO+ varies with the cosmic-ray flux
(the ionization of H2 produces H+3 which reacts with CO
to form HCO+). This can explain the difference observed
between galaxies (Nguyen-Q-Rieu et al. 1992). M 31 is a very quiet galaxy compared to M 82 and we do not ex-pect line ratios as high as in M 82. However the radiation field varies within the galaxy. Among the 9 GMCs ob-served in both HCN and HCO+, 8 GMCs are detected in
both lines. Seven are associated with large HII regions: positions A, B, E, H, I, J, K, most of them are near OB associations (Magnier et al. 1993) and we can suppose that the high star formation activity produces a strong ionization flux which can enhance the HCO+ abundance.
The IHCO+/IHCN ratio is similar for these regions, from
1.1 to 1.5, except for position I where the ratio is appar-ently lower (but only one strong component is detected in HCO+ and it is not clear if the difference for the second
component is real or just due to the signal to noise ra-tio). The eighth GMC (D) is more isolated and presents a narrower line profile but an HII region is also located at the edge of the cloud and the HCO+/HCN intensity ratio
lines is F with IHCO+/IHCN∼ 0.54. F is located in the in-<
ner spiral arm, in the inner part of M 31 where the star formation activity is weak; there is no HII region associ-ated with F and the low ratio may be due to a difference of abundance. Anyway it is difficult to conclude as only one GMC of the sample of GMCs observed in both lines presents a clear different environment.
4. Dense gas
From the HCN, HCO+and CO(1–0) observations in M 31
and other studies in our Galaxy and external galaxies, it appears that the HCN and HCO+integrated emissions are
weakly correlated with the CO integrated emission on the same scale. This implies a difference of dense gas content, or a difference of excitation or different HCN and HCO+
abundances.
The ratio of HCN to CO integrated intensities is often used as a density probe. Helfer & Blitz (1997b) concludes that the IHCN/ICOratio could indeed be a qualitative and
even a reasonable quantitative measure of pressure. We define the 2 following ratios χN = 100×IHCN/ICO and
χO+ = 100×IHCO+/ICO. The values of χN and χO+ we
derive for the GMCs in M 31 are indicated in Table 2. The ratio χNvaries from galaxy to galaxy. The
numer-ous studies towards galactic centers lead to quite consis-tent values : 8 in our Galaxy (Jackson et al. 1996), 8.4 in NGC 4945 (Henkel et al. 1990), 11 in NGC 6946 (Helfer & Blitz 1997a), 2.9 for M 82 and 6.9 for NGC 253 (Nguyen-Q-Rieu et al. 1989), and from 8.6 to 60 in Seyfert galaxies (Kohno et al. 1999). But due to the beam size and the distance to the galaxy, the linear scale is often different and the value of the ratio is completely different depend-ing on the spatial resolution (see e.g. Jackson et al. 1996). It is thus difficult to compare the different values and it is essential to identify the clouds to make real comparisons. In the disk of our Galaxy, an average value of χN =
2.6 ± 0.8 is found over size scales of 200 pc and χN =
1.4 ± 2.0 over nearby individual GMCs on size scales of about 40 pc (Helfer & Blitz 1997b). For the high-mass star forming regions observed by Pirogov (1999), the correla-tion between CO and HCN integrated intensities is lower than between the high density tracers intensities, with a mean value of χN= 9.8 ± 8.2.
The inner regions of a few external galaxies have been observed. Downes et al. (1992) mapped the center of IC 342 and measured a ratio χN of ∼14 in the center and
≤7 in the beginning of the spiral arm. Kuno et al. (1995) detected a few positions in the arms of M 51 out to a radius of 3.5 kpc. They found a ratio of 1.1-1.9, much smaller than the value in the center of M 51 (χN=8.6).
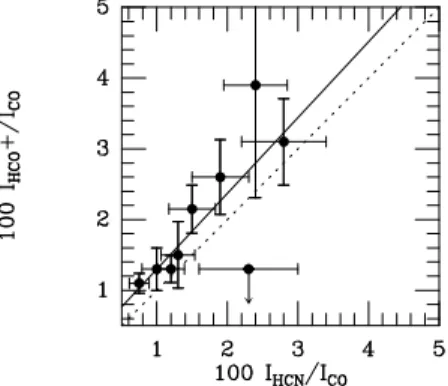
Our observations present for the first time HCN and HCO+ detections so far out in a galactic disk, except
our Galaxy. The galactocentric distances of the observed GMCs range from 2.4 to 15.5 kpc (see Table 2). We find mean values χN = 1.7 ± 0.5 and χO+ = 2.0 ± 0.7. These
values, derived on a size scale of 100 pc, are comparable to the one derived by Helfer & Blitz (1997b) in the Galactic
Fig. 2.χO+as a function of χN. The dotted line represents
IHCO+/ICO = IHCN/ICO and the solid line a least-square
linear fit to the data (χO+ = 1.07χN+0.23) without taking
into account position F (upper limit).
disk. Fig. 2 represents χO+as a function of χN. The upper
limit under the IHCO+/ICO= IHCN/ICO line corresponds
to the quiescent GMC F (cf. end of Sect. 3). If we consider only the GMCs with a star formation activity, there is a good correlation between the two dense gas tracers with a slope of regression line of ∼ 1.1 and IHCO+/ICOis slightly
higher than IHCN/ICO. We can note that position I follows
here the same trend as the other GMCs, as the HCN and HCO+line intensities are divided by the CO line intensity
of the component corresponding in velocity.
5. Radial distribution of the dense gas
A strong trend in the ratio of HCN to CO emission is present between the nucleus and the disk of a galaxy but is uncertain within the disk. For example, the decrease of the IHCN/ICO and IHCO+/ICO ratios between the center
and the disk is observed in the inner regions of M 51 and NGC 253 (Sorai et al. 2002; Rieu et al. 1989). Likewise, in our Galaxy, IHCN/ICO is about 0.08 averaged over the
central 600 pc and it is 0.026 in average over size scales of 200 pc between R=3.5 and 7 kpc, and 0.014 over size scales of 40 pc in the solar neighboorhood GMCs (Helfer & Blitz 1997b). A modest trend with the radius within the plane of our Galaxy may also be found in the ratio of HCO+ to CO emission. The HCO+ emission peaks at
R=4-5 kpc which corresponds to the Galactic molecular ring, but the ratio HCO+/CO is almost constant (between
∼0.01 and ∼ 0.025), within the error bars, from 3 to 9 kpc with a slight decrease at high radius (Liszt 1995).
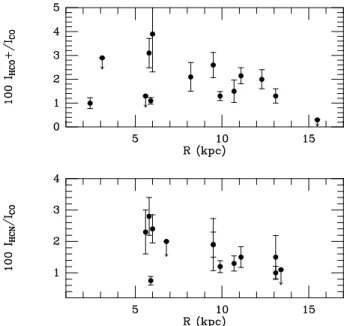
Our data allows to investigate the distribution of the dense gas in the disk of a galaxy, on a scale even larger than for our Galaxy. We have plotted the χNand χO+
ra-tios as a function of the galactocentric radius R (Fig. 3). On the χN(R) plot, we find a slight trend similar as the
one found in our Galaxy, the ratios decreasing with the radius. Position H (R = 5.9 kpc, χN= 0.75) is outside
this tendency, but there seems to be a CO component in the spectrum which is not detected in HCN. As the ratios are calculated for components at the same velocity, IHCN
ra-6 N. Brouillet et al.: HCN and HCO+ emission in the disk of M 31
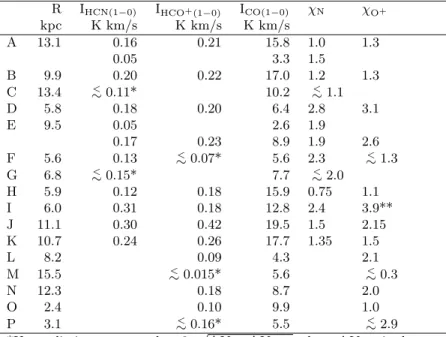
Table 2. The name of the observed positions and the galactocentric distances are indicated in columns 1 and 2 respectively. Columns 3, 4, 5 display the integrated intensities of HCN(1–0), HCO+(1–0) and CO(1–0) emission,
respectively. Column 6 gives χN= 100×IHCN/ICO, and column 7 χO+= 100×IHCO+/ICO.
R IHCN(1−0) IHCO+(1−0) ICO(1−0) χN χO+ kpc K km/s K km/s K km/s A 13.1 0.16 0.21 15.8 1.0 1.3 0.05 3.3 1.5 B 9.9 0.20 0.22 17.0 1.2 1.3 C 13.4 < ∼ 0.11* 10.2 < ∼ 1.1 D 5.8 0.18 0.20 6.4 2.8 3.1 E 9.5 0.05 2.6 1.9 0.17 0.23 8.9 1.9 2.6 F 5.6 0.13 < ∼ 0.07* 5.6 2.3 < ∼ 1.3 G 6.8 < ∼ 0.15* 7.7 < ∼ 2.0 H 5.9 0.12 0.18 15.9 0.75 1.1 I 6.0 0.31 0.18 12.8 2.4 3.9** J 11.1 0.30 0.42 19.5 1.5 2.15 K 10.7 0.24 0.26 17.7 1.35 1.5 L 8.2 0.09 4.3 2.1 M 15.5 < ∼ 0.015* 5.6 < ∼ 0.3 N 12.3 0.18 8.7 2.0 O 2.4 0.10 9.9 1.0 P 3.1 < ∼ 0.16* 5.5 < ∼ 2.9 *Upper limits correspond to 3σ√∆Vline∆Vchanwhere ∆Vlineis the
CO(1–0) velocity width and ∆Vchanis the velocity resolution.
**Ratio of the components corresponding to the same velocity interval.
tio could be a bit higher. On the χO+(R) plot, we can
find a similar trend as for χN except for positions O (R
= 2.4 kpc), F (R = 5.6 kpc) and H(R = 5.9 kpc). The lower value of χO+ for F may be due to a lower HCO+
abundance, and it could also be the case for position O but we have not the HCN observations to compare with. Loinard & Allen (1998) confirmed the results of Allen & Lequeux (1993) that D478 (position O) is a large, mas-sive, extremely cold molecular cloud. It is likely the case for the other dark clouds in the inner disk of M 31 where very little massive star formation is occurring, whereas the bright complexes in the arms of M 31 are comparable in sizes and temperatures to Galactic GMCs. It is then pos-sible that the HCO+/HCN abundance ratio is lower in the
center than in the arms where the GMCs are submitted to intense fluxes of UV photons. However even the χN ratio
may not increase towards the center, as measured in our Galaxy and other galaxies; we expect a higher ratio in the nucleus due to the higher densities and kinetic tempera-tures, but no molecular concentrations comparable to the Galactic ones are present near the center of M 31 (Gu´elin et al. 2000) and the conditions of excitation appear to be very different. HCN observations would be needed to investigate the excitation of the dense gas in the center.
Concerning the values of χNand χO+ for the GMCs in
the arms, we do not expect that the decrease with galacto-centric distance is due to the general abundance gradient observed in spiral galaxies; the line integrated intensities do not drop with the radius but the line integrated inten-sities normalized by the CO inteninten-sities seem to decrease
with R, and CO, HCN and HCO+ all contain the same
number of ”rare” atoms. The observed trend, if real (tak-ing into account the uncertainties and position H which does not follow the tendency), would then be due to vari-ations of excitation.
We can note that the GMC in the interarm (L at R = 8.2 kpc) presents a value of χO+ comparable to the values
in the arms. Although the GMC is isolated, the abundance of HCO+ does not seem to be weak. We can consider that
the chemistry was influenced by the conditions present while the cloud was in the arm; the abundances of the different species evolve during a period of about 106years,
then the chemistry remains stable as long as there is no perturbation, which is the case if the GMC goes out of the spiral arm and does not form any stars.
6. Conclusion
The HCN and HCO+ emission is easily detected in our
sample of GMCs spread over the disk of M 31 with a wide radial range (2.4-15.5 kpc) and with different structures and environments. The line widths and the line profiles are generally very similar in HCN, HCO+and CO. A velocity
component is sometimes not detected in HCN or HCO+,
which may be due to the poor signal-to-noise ratio of the data.
The IHCO+/IHCNratio of ∼ 1.2 observed in the disk of
M 31 is a bit higher than the one derived for most galaxies, including our Galaxy (ratio less than or equal to 1), but it is well below the values found in M 82 and towards the
Fig. 3.Radial distributions of χNand χO+ in the disk of
M 31.
HII regions in the Magellanic Clouds where the radiation fields are stronger. However our sample of positions ob-served in both lines, consists mainly of GMCs associated with large HII regions and OB associations. The only po-sition, situated in the inner part of M 31 and without any sign of star formation activity, is detected in HCN and marginally detected in HCO+ with a line ratio <
∼ 0.54. The IHCO+/IHCN ratio seems to be constant, within the
uncertainties, for the GMCs in the arms with star forma-tion activity, and the low ratio measured towards the qui-escent cloud could be due to a lower abundance of HCO+.
The χN= 100×IHCN/ICOratio ranges from 0.75 to 2.8
and the χO+ = 100×IHCO+/ICO ratio from less than 0.3
and 3.9. They are comparable to the values found in the Galactic disk and smaller than the values usually mea-sured towards the center of galaxies. We find low values of χO+ in the center of M 31 compared to our Galaxy or
galaxies like M 51 and NGC 253, which can be due to a lower abundance of HCO+ as the ionization field is weak
in the inner part of M 31. But the conditions of excitation are also supposed to be different as there are no massive and warm GMCs in the nucleus as in the other galaxies. When investigating the variation with the galactic radius in the M 31 disk , we find that the χNand χO+ ratios are
higher in the inner arm than in the outer arm. This weak trend, if real, is not supposed to come from the abundance gradient but from excitation effects.
Acknowledgements. We wish to thank Nikolaus Neininger for discussions and help while starting the project. We also thank the IRAM staff in Granada for their help during the observa-tions.
References
Allen, R.J., & Lequeux, J. 1993, ApJ, 410, L15
Braine, J., Brouillet, N., Baudry, A. 1997, A&A, 318, 19
Brouillet, N., & Schilke, P. 1993, A&A, 277, 381
Chin, Y.-N., Henkel, C., Whiteoak, J.B. et al. 1997, A&A, 317, 548
Curran, S.J., Aalto, S., Booth, R.S. 2000, A&AS, 141, 193 Downes, D., Radford, S.J.E., Guilloteau, S., et al. 1992, A&A,
262, 424
Gu´elin, M. , Nieten, C., Neininger, N. et al. 2000, The inter-stellar medium in M31 and M33, proceedings 232, ed. E. M. Berkhuijsen, R. Beck, and R. A. M. Walterbos. Shaker, Aachen, 15
Helfer, T.T., & Blitz, L. 1997a, ApJ, 478, 162 Helfer, T.T., & Blitz, L. 1997b, ApJ, 478, 233
Henkel, C., Whiteoak, J.B., Nyman, L.-˚A., Harju, J. 1990, A&A, 230, L5
Henkel, C., Baan, W.A., Mauersberger, R. 1991, A&AR, 3, 47 Hodge, P.W. 1980, Atlas of the Andromeda Galaxy (Univ. of
Washington Press)
H¨uttemeister, S., Henkel, C., Mauersberger, et al. 1995, A&A, 295, 571
Jackson, J.M., Heyer, M.H., Paglione, T.A.D., Bolatto, A.D. 1996, ApJ, 456, L91
Kohno, K., Kawabe, R., Tosaki, T., Okumura, S.K. 1996, ApJ, 461, L29
Kohno, K., Kawabe, R., Vila-Vilar´o, B. 1999, The Physics and Chemistry of the Interstellar Medium,in 3rd Cologne-Zermatt Symposium, ed. V. Ossenkopf, J. Stutzki, G. Winnewisser, 34
Kuno, N., Nakai, N., Handa, T., Sofue, Y. 1995, PASJ, 47, 745 Liszt, H.S. 1995, ApJ, 442, 163
Loinard, L., & Allen, R.J. 1998, ApJ, 499, 227
Magnier, A.E., Battinelli, P., Lewin, W.H.G. et al. 1993, A&A, 278, 36
Muller, S. 2003, Thesis
Neininger, N. 2000, The interstellar medium in M31 and M33, proceedings 232, ed. E. M. Berkhuijsen, R. Beck, and R. A. M. Walterbos. Shaker, Aachen, 25
Nguyen-Q-Rieu, Nakai, N., Jackson, J.M. 1989, A&A, 220, 57 Nguyen-Q-Rieu, Jackson, J.M., Henkel, C., Truong-Bach,
Mauersberger, R. 1992, ApJ, 399, 521
Paglione, T.A.D., Jackson, J.M., Ishizuki, S. 1997, ApJ, 484, 656
Pirogov, L. 1999, A&A, 348, 600
Seaquist, E.R., & Frayer, D.T. 2000, ApJ, 540, 765
Solomon, P., Downes, D., Radford, S.J.E. 1992, ApJ, 387, L55 Sorai, K., Nakai, N., Kuno, N., Nishiyama, K. 2002, PASJ, 54,
179
Stanek, K.Z., & Garnavich, P.M. 1998, ApJ, 503, L131 Turner, B.E., & Thaddeus, P. 1977, ApJ, 211, 755