HAL Id: hal-00295676
https://hal.archives-ouvertes.fr/hal-00295676
Submitted on 17 Jun 2005
HAL is a multi-disciplinary open access
archive for the deposit and dissemination of
sci-entific research documents, whether they are
pub-lished or not. The documents may come from
teaching and research institutions in France or
abroad, or from public or private research centers.
L’archive ouverte pluridisciplinaire HAL, est
destinée au dépôt et à la diffusion de documents
scientifiques de niveau recherche, publiés ou non,
émanant des établissements d’enseignement et de
recherche français ou étrangers, des laboratoires
publics ou privés.
aerosols in the lowermost troposphere over the
Amazonian tropical rainforest
R. Krejci, J. Ström, M. de Reus, J. Williams, H. Fischer, M. O. Andreae,
H.-C. Hansson
To cite this version:
R. Krejci, J. Ström, M. de Reus, J. Williams, H. Fischer, et al.. Spatial and temporal distribution of
at-mospheric aerosols in the lowermost troposphere over the Amazonian tropical rainforest. Atat-mospheric
Chemistry and Physics, European Geosciences Union, 2005, 5 (6), pp.1527-1543. �hal-00295676�
www.atmos-chem-phys.org/acp/5/1527/ SRef-ID: 1680-7324/acp/2005-5-1527 European Geosciences Union
Chemistry
and Physics
Spatial and temporal distribution of atmospheric aerosols in the
lowermost troposphere over the Amazonian tropical rainforest
R. Krejci1,2, J. Str¨om2, M. de Reus2,3, J. Williams3, H. Fischer3, M. O. Andreae3, and H.-C. Hansson21Department of Meteorology, Stockholm University, S 106 91 Stockholm, Sweden
2ITM – Air Pollution Laboratory, Stockholm University, 106 91 Stockholm, Sweden
3Max Planck Institute for Chemistry, P. O. Box 3060, 55020 Mainz, Germany
Received: 12 April 2004 – Published in Atmos. Chem. Phys. Discuss.: 25 June 2004 Revised: 2 May 2005 – Accepted: 26 May 2005 – Published: 17 June 2005
Abstract. We present measurements of aerosol physico-chemical properties below 5 km altitude over the tropical rain forest and the marine boundary layer (MBL) obtained dur-ing the LBA-CLAIRE 1998 project. The MBL aerosol size distribution some 50–100 km of the coast of French Guyana and Suriname showed a bi-modal shape typical of aged and cloud processed aerosol. The average particle number
den-sity in the MBL was 383 cm−3. The daytime mixed layer
height over the rain forest for undisturbed conditions was estimated to be between 1200–1500 m. During the morn-ing hours the height of the mixed layer increased by 144–
180 m h−1. The median daytime aerosol number density in
the mixed layer increased from 450 cm−3in the morning to
almost 800 cm−3in the late afternoon. The evolution of the aerosol size distribution in the daytime mixed layer over the rain forest showed two distinct patterns. Between dawn and midday, the Aitken mode particle concentrations increased, whereas later during the day, a sharp increase of the accumu-lation mode aerosol number densities was observed, resulting in a doubling of the morning accumulation mode concentra-tions from 150 cm−3to 300 cm−3. Potential sources of the Aitken mode particles are discussed here including the rapid growth of ultrafine aerosol particles formed aloft and subse-quently entrained into the mixed layer, as well as the con-tribution of emissions from the tropical vegetation to Aitken mode number densities. The observed increase of the accu-mulation mode aerosol number densities is attributed to the combined effect of: the direct emissions of primary biogenic particles from the rain forest and aerosol in-cloud process-ing by shallow convective clouds. Based on the similari-ties among the number densisimilari-ties, the size distributions and the composition of the aerosol in the MBL and the noctur-nal residual layer we propose that the air originating in the Correspondence to: R. Krejci
MBL is transported above the nocturnal mixed layer up to 300–400 km inland over the rain forest by night without sig-nificant processing.
1 Introduction
The first airborne measurement campaign within the Co-operative Large Scale Biosphere-Atmosphere Regional Ex-periment in Amazonia (LBA-CLAIRE-98) project is a con-tinuation of a series of experiments designed to investigate and improve our understanding of the processes controlling the properties of the tropical troposphere. The experiment was designed to study changes in the tropospheric composi-tion resulting from interaccomposi-tions of the inflowing marine air with tropical vegetation under relatively undisturbed, non-precipitating conditions.
Aerosols influence climate directly by absorbing and scat-tering incoming solar radiation, and indirectly by acting as cloud condensation nuclei (CCN), and thereby affecting the cloud microphysical and optical properties, as well as the precipitation rate and lifetime of clouds (Charlson et al., 1992). Elevated concentrations of trace gases and aerosols associated with biomass burning and land use changes in the tropics have attracted increased scientific attention over the last decades. In the 1980s the influence of carbon monoxide and other trace gases emitted to the atmosphere from biomass burning were recognized to have a significant effect on the at-mosphere on a global scale (Andreae et al., 1988; Crutzen et al., 1985).
The planetary Boundary Layer (PBL) over the Amazon Basin has been studied earlier during several major cam-paigns. The Amazon Boundary Layer Experiment (ABLE 2A) took place in Brazil during the early-to-middle dry sea-son in 1985 (Harriss et al., 1988). The wet seasea-son boundary
layer properties were investigated later during the subsequent ABLE 2B project in 1987 (Harriss et al., 1990). The Smoke, Clouds, and Radiation – Brazil (SCAR-B) study focused ex-clusively on biomass burning, to study climatic and cloud formation effects associated with emissions of smoke aerosol and gaseous combustion products (Kaufman et al., 1998; Reid and Hobbs, 1998). Several studies, within the LBA project (http://lba.cptec.inpe.br/) investigated the dynamics of the planetary boundary layer over Amazonia (Betts et al., 2002) and the energy and water cycles of atmosphere-biosphere interactions (Andreae et al., 2002; Malhi et al., 2002; Vourlitis et al., 2002). Most recently, a detailed study (SMOCC: Smoke Aerosols, Clouds, Rainfall and Climate) was performed to elucidate the interactions between aerosols, cloud microphysics and precipitation over Amazonia (An-dreae et al., 2004). Similar projects, dealing with the influ-ence of biomass burning on the composition of the PBL, have been carried out over the rain forest in central Africa (Delmas et al., 1999; Lacaux et al., 1995).
Until recently, most attention had been focused on the pro-cesses associated with biomass burning (Crutzen and An-dreae, 1990; Ward et al., 1992). These processes are, how-ever, dominant only during 3–4 months long dry season (Mc-Gregor and Nieuwolt, 1998). During the wet season, when biomass burning is suppressed by intensive precipitation, the fluxes of aerosols and trace gases from the rainforest to the atmosphere are assumed to be controlled by natural pro-cesses as pointed out by Artaxo et al. (1990); Browell et al. (1990); Graham et al. (2003a); Gregory et al. (1986); Guyon et al. (2003). Measurements of the trace elements content in aerosols using PIXE (Proton Induced X-ray Emis-sion) together with factor analysis identified only two types of particles present in the boundary layer air during condi-tions undisturbed by biomass burning: soil dust and biogenic particles released from the rain forest. The later group dom-inated the aerosol mass of the fine fraction aerosol (Artaxo and Hansson, 1995). Similar observations showing that or-ganic matter represents a dominant fraction of natural Ama-zonian aerosol mass were reported from the LBA-CLAIRE 2001 campaign at Balbina, about 100 km north of Manaus, Brazil (Graham et al., 2003a; Graham et al., 2003b).
This study will present observed changes of aerosol physico-chemical properties during advection from the At-lantic Ocean over the tropical rain forest during the short dry season when neither biomass burning nor intensive precip-itation have a strong influence. In a semilagrangian study, we will focus on the variation of the aerosol number densi-ties and size distributions as a function of time of day and attempt to relate these variations to a local meteorology and aerosol sources from the tropical vegetation.
2 Experimental
Measurement flights were made out off Zanderij Interna-tional Airport (5◦270N, 55◦110W), 50 km south of Para-maribo, Suriname. Trace gas and aerosol measurements were obtained in-situ from instrumentation mounted onboard the Cessna Citation II twinjet aircraft operated by the Technical University of Delft, The Netherlands. The cruising air speed at low altitude was typically around 100 m s−1and the flight duration 3 to 4 h.
Aerosols were sampled using two different inlets, one fac-ing forward and one facfac-ing backward. The forward facfac-ing, near isokinetic inlet, allows sampling of particles smaller than approximately 4 µm in aerodynamic diameter. The up-per cut-off is based on the impaction loss calculations in a T-division dividing the sample air towards different sen-sors inside the aircraft. The rearward-facing inlet was used to collect aerosols with an aerodynamic diameter smaller than 1 µm (Schr¨oder and Str¨om, 1997). Both inlets work
satisfactorily inside clouds consisting of ice crystals. In
warm clouds composed of liquid droplets, however, sampling via both inlets and especially the rearward-facing inlet, suf-fers from droplet shattering. Situations where this occurred can be identified unambiguously and have been removed. Notes taken by the onboard operator confirm these periods of abrupt spikes in apparent particle number densities as cloud penetrations, which also coincide with observed high relative humidity (RH close to 100%).
Total aerosol number densities were measured using two different Condensation Particle Counters (CPC) Thermo Systems Inc. models TSI 3010 and TSI 3760 connected to the rearward-facing inlet. The TSI 3010 particle counter was modified by increasing the temperature difference between saturator and condenser tube, which leads to a 50%
count-ing efficiency (Dp50)at 0.006 µm as determined from the
laboratory calibration using ammonium sulfate aerosol. The standard TSI 3760 particle counter had a 50% counting effi-ciency at 0.018 µm. Here N6and N18stand for the integral
number densities of particles larger than 0.006 and 0.018 µm, respectively. The data is stored at 10 Hz and later reduced to 1 Hz averages. The difference between both particle coun-ters denoted as N6−18, is a good indicator of the presence of
ultra-fine condensation nuclei (UCN).
The forward facing inlet was used to sample accumula-tion mode particles that were sized and counted by an Op-tical Particle Counter (OPC) PMS-PCASP. This instrument nominally classifies the particles in the size range between 0.1 and 3.5 µm in diameter into 32 size bins based on their light scattering properties. However, due to noise in the first two channels, the lowest size was shifted to 0.12 µm and the number of bins decreased to 30. The integral number density of the particles larger than 0.12 µm observed by the OPC is
denoted as N120. Data from the OPC were recorded at 1 Hz.
A custom built Differential Mobility Analyzer (DMA) (Knutson and Whitby, 1975) was used to investigate the
aerosol size distribution between 0.02 and 0.126 µm. This system employs a closed loop sheath air circulation described by (Jokinen and Makela, 1997). The sample aerosol passed
an85Kr radioactive source to yield charge equilibrium
be-fore entering a Hauke-type DMA. The sample flow was 1 L min−1 and the sheath airflow was 5 L min−1. Aerosol particles were counted using the standard TSI 3010 CPC. The DMA system, operated in a stepwise mode, provided one size distribution every minute based on ten observed mo-bility intervals. Combined data from the DMA, the OPC and the CPCs yields a composite aerosol size distribution be-tween 0.006 and 3.5 µm diameter. Only those observations obtained out-of-cloud and during constant pressure flight lev-els are included in the analysis of the aerosol size distri-butions. The consistency of the size distribution measure-ments was checked by comparing the integral number of particles derived from the DMA and OPC measurements to the N18 number densities. Ideally the ratio of the two
mea-surements (N18/(NDMA+NOPC)) should be close to unity or
larger. However, the incomplete overlap between the CPC and smallest bin derived from the DMA observations gen-erally result in a ratio larger than one. With an increasing fraction of small particles, particularly near the Dp50of the
CPC, this ratio also increases. For the measurements below 5 km altitude during the LBA-CLAIRE 98 campaign, the ra-tio generally varied from 0.96 to 1.6 with an average value of 1.19 (n=460, σ =0.27). Four size distributions (less then 2% of all size distributions) with a ratio larger than 2 were removed from data set.
Relative humidity was measured by a Vaisala HUMITTER 50 sensor connected to the sample line inside of the airplane. The manufacturer stated accuracy is ±5% of RH. Due to the higher temperature of the sample air inside the cabin relative to ambient conditions, RH measurements were restricted to altitude less than 5 km. The RH in the sample line inside the aircraft varied typically between 20 and 40%. Ground-based measurements of the aerosol hygroscopic growth factor in central Amazonia show unimodal behavior with low growth factors between 1.16 and 1.32 at 90% relative humidity in the 0.035 µm–0.265 µm size range (Zhou et al., 2002). Hence, we consider the size of the aerosol particles entering the in-strumentation to be close to the dry size.
Single particle analysis was performed using the Scanning Electron Microscope SEM-JEOL-840 (JEOL, Tokyo, Japan) equipped with Energy Dispersive Analysis of X-ray (EDAX) at the Institute of Working Life, Stockholm, Sweden. Ap-proximately 100 particles larger then 0.2 µm were analyzed per sample. A detail description of the sampling and analyt-ical procedures can be found in Krejci et al. (2004).
Beside observations of aerosol properties, several trace gases were measured onboard of the aircraft. In this study we will use measurements of carbon monoxide, made with a Tunable Diode Laser Absorption Spectrometer (TDLAS) by the Max-Planck Institute for Chemistry, Mainz, Germany (Williams et al., 2001). The calibration accuracy was 2.8%
during the LBA-CLAIRE 98 campaign and the measurement precision was ±2%. The instrument set up is described in detail by Wienhold et al. (1998).
Supporting data describing the ambient conditions during the measurement flights (static air temperature, ambient air pressure, wind speed, wind direction, air and ground speed) were recorded by the aircraft data acquisition system. Lati-tude, longitude and altitude data used in this study were ob-tained from a Global Positioning System (GPS) instrument.
Forecasts and analysis of flow fields based on ECMWF data were obtained from the Royal Netherlands Meteoro-logical Institute (KNMI) and the Suriname Meteorologi-cal Office. Air mass trajectories were Meteorologi-calculated using the HYSPLIT 4 (Hybrid Single-Particle Lagrangian Integrated Trajectory) model (http://www.arl.noaa.gov/ready/hysplit4. html) (Draxler and Hess, 1997; Draxler and Hess, 1998).
3 Results
Observations presented here are based on data collected dur-ing eight flights between 15 March and 29 March 1998, car-ried out in a planetary boundary layer over Suriname, French Guyana and the adjacent part of the Atlantic Ocean. Informa-tion about the maritime background aerosol properties was obtained during the flights north of Suriname and French Guyana coast on 15, 17, 21 and 29 March. Data obtained on 15, 17, 22, 25, 26 and 28 March are used to show the evolution of aerosol properties in the mixed layer over the tropical rain forest.
The lowest part of the atmosphere during the LBA-CLAIRE 98 campaign was controlled by semi-persistent NNE trade winds advecting air at typical wind speeds of 4– 6 m s−1from the Atlantic Ocean over the continent towards the Inter-Tropical Convergence Zone (ITCZ) (Fig. 1). The trade winds extended up to an altitude corresponding to the base of Trade Wind Inversion (TWI) at approximately 2.5 km altitude. During the LBA-CLAIRE 98 campaign the ITCZ was located south of Suriname at latitudes between 2◦S and 1◦N.
Prior to presenting the aerosol properties observed over the rain forest, observations from the marine boundary layer are shown to characterize the air masses entering the nent. Measurements of the aerosol properties over the conti-nent were performed over the same rain forest covered
re-gion at different times of the day. Combining both sets
of observations, assuming a stable trade winds flow regime (Fig. 1), allowed us to use a semilagrangian approach to study influence of local meteorology and tropical vegetation on aerosol physico-chemical properties in planetary bound-ary layer over the rain forest.
In addition to the integral aerosol number densities, we also present observations of aerosol size distributions. Char-acterization of the different modes used in text is based on lognormal fitting. Fitting was done manually using aerosol
30
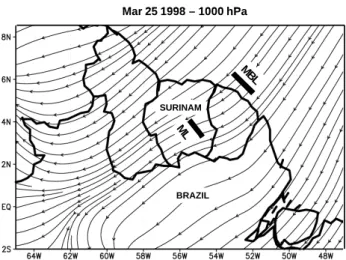
Figure 1. Flow field from ECMWF at 1000 hPa on 25 March 1998. The MBL rectangle denotes the location of the measurements in the marine boundary layer on 21 March. The ML rectangle shows the location of the measurements above the rainforest between 25 March and 28 March.
MBL ML Mar 25 1998 – 1000 hPa SURINAM BRAZIL MBL ML Mar 25 1998 – 1000 hPa SURINAM BRAZIL
Fig. 1. Flow field from ECMWF at 1000 hPa on 25 March 1998.
The MBL rectangle denotes the location of the measurements in the marine boundary layer on 21 March. The ML rectangle shows the location of the measurements above the rainforest between 25 March and 28 March.
number, surface and volume distributions. The fit was re-garded as satisfactory when the fitted size distribution agreed well with the observed features in all three moments. The subjective approach we used to describe the observations with modeled size distributions does not allow us to set an exact measure of uncertainty for the fitting parameters and the individual modes should be viewed as guide for the eye.
Aerosol number densities are recalculated to STP condi-tions (1013 hPa and 273.15 K) if not stated otherwise.
3.1 Marine boundary layer
During the flight on 21 March the aircraft flew in the marine boundary layer (MBL) north of French Guyana. The flight track in the MBL is marked with a black line in Fig. 1. The height of the mixed layer was estimated to be close to 600 m, using potential temperature profiles obtained during descent and ascent from the lowermost flight level. Observed aerosol number densities in the mixed layer were very stable during the 100 km long horizontal flight leg conducted at an altitude
of 200 m. The average N6 number density was 383 cm−3
(n=1044, σ =34). The accumulation mode aerosol N120
ac-counted for approximately 45% of the particles by number. Here we take the observations from 21 March as representa-tive for MBL conditions during the LBA-CLAIRE 98 cam-paign. The shape of the aerosol size distribution and mea-sured particle number densities from three other flights in the MBL on 15, 17 and 29 March are very similar (Fig. 2) in-dicating stable and persistent aerosol size distribution in the MBL within the measurement size range. The aerosol size distribution shows a bimodal shape with a pronounced min-imum at 0.08 µm, indicating the presence of aged aerosol modulated by cloud processing during transport (Hoppel et
31 0 100 200 300 400 500 600 0.01 0.1 1 10 Diameter (µm) dN/dlogDp (cm -3)
Figure 2. Median MBL aerosol size distribution (solid line) based on four flights: 15 March (8 size distributions), 17 March (6 size distributions), 21 March (17 size distributions) and 29 March (18 size distributions). The measurements were performed between 0.15 and 0.5 km altitude. The error bars indicate upper and lower quartiles. The median MBL aerosol size distribution from 21 March is plotted as a dashed line.
Fig. 2. Median MBL aerosol size distribution (solid line) based on
four flights: 15 March (8 size distributions), 17 March (6 size distri-butions), 21 March (17 size distributions) and 29 March (18 size dis-tributions). The measurements were performed between 0.15 and 0.5 km altitude. The error bars indicate upper and lower quartiles. The median MBL aerosol size distribution from 21 March is plotted as a dashed line.
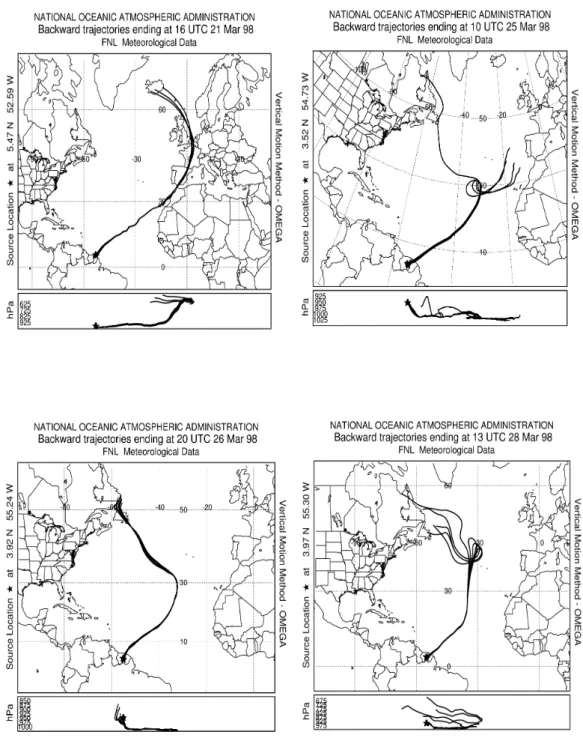
al., 1986). According to back trajectories (Fig. 3, upper left), the probed air mass was transported in the MBL for approx-imately one week. Before this period the air mass subsided over SW Europe so that we cannot exclude an influence of anthropogenic pollution more than a week prior to the mea-surements.
The fit parameters for the median MBL size distribution
are: Aitken mode N=155 cm−3, Dp=0.052 µm (mean mode
diameter) σ =1.52 (standard deviation of the mode) and
accu-mulation mode N=185 cm−3, Dp=0.145 µm σ =1.40. These
observations are in fair agreement with ship observations made along the transect through the Atlantic Ocean during the Aerosols99 project (Bates et al., 2001), which gave the following fit parameters for the marine aerosol size distribu-tion observed in the northern hemispheric subtropical region
N=160±42 cm−3, Dp=0.030±0.004 µm, σ =1.40±0.026 for
Aitken mode and N=58±23 cm−3, Dp=0.120±0.022 µm,
σ=1.59±0.012 for accumulation mode. Both measurements
were performed in an environment not directly influenced by air pollution sources and differences are within the range ex-pected from natural variability.
3.2 Planetary boundary layer over the rainforest
Three flights performed on 25, 26 and 28 March were de-signed to investigate diurnal and day-to-day variability of the aerosol physico-chemical properties in the boundary layer over the rainforest. The flight patterns for all three flights included vertical profiles through the lower troposphere and several passages at low altitude over the identical region of the rain forest between 3◦300–4◦120N and 54◦360–55◦180W (Fig. 1). The history of the investigated air masses was simi-lar for all three flights (Fig. 3). After a week of transport from northern mid-latitudes the air masses entered the continent
32
Figure 3. Ten-day back-trajectories indicating the origin and history of the air masses
investigated on 21 March, 25 March, 26 March and 28 March 1998.
Fig. 3. Ten-day back-trajectories indicating the origin and history of the air masses investigated on 21 March, 25 March, 26 March and 28
March 1998.
over the scarcely populated coast of French Guyana and then traveled approximately 300 km over the pristine rain forest before being intercepted by the aircraft.
Analysis of CO and CO2mixing ratios during the
LBA-CLAIRE 98 campaign indicate that the investigated air masses in the boundary layer were not significantly influ-enced by biomass burning (Williams et al., 2001). The ob-served mixed layer CO mixing ratios varied between 135 ppb and 153 ppb during the flights on 25, 26 and 28 March. Besides combustion, carbon monoxide is produced by
pho-tochemical reactions during the oxidation of hydrocarbons (e.g. isoprene). However, the day-to-day variability of CO mixing ratios during the LBA-CLAIRE 98 suggested com-parable contribution of CO production associated with rain forest emissions and advection of CO from long range trans-port across the Atlantic Ocean (Williams et al., 2001). Off the coast of South America, the CO mixing ratios usually varied between 110 and 120 ppb during the course of cam-paign, indicating somewhat polluted air.
33
0 500 1000 1500 2000 2500 3000 300 304 308 312 300 304 308 312 300 304 308 312 0 500 1000 1500 2000 2500 3000 300 304 308 31225 Mar 6:15 (LST) 28 Mar 9:13 (LST) 28 Mar 9:55 (LST) 28 Mar 11:00 (LST)
26 Mar 15:55 (LST) 26 Mar 16:34 (LST)
28 Mar 11:24 (LST) 26 Mar 18:06 (LST)
Altitude (m)
Θ (K)
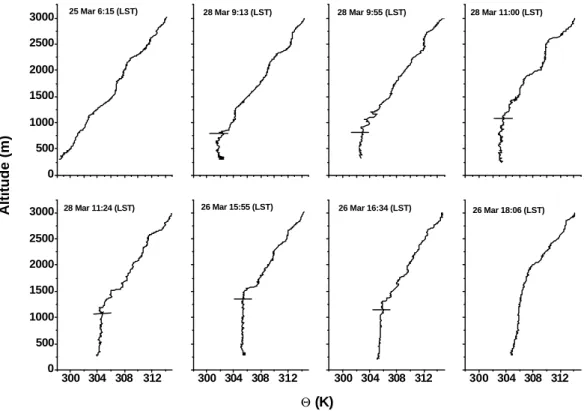
Figure 4. The potential temperature (
Θ
) vertical profiles. Short horizontal bars mark the top of
the mixed layer. Vertical axis shows altitude above ground.
Fig. 4. The potential temperature (2) vertical profiles. Short horizontal bars mark the top of the mixed layer. Vertical axis shows altitude
above ground.
3.2.1 Mixed layer height
The evolution of the mixed layer height over the rain forest within the observational domain (Fig. 1) is shown using the composite time series of vertical profiles of potential tem-perature (2) (Fig. 4). The nocturnal mixed layer inversion was not observed during the profile performed shortly before sunrise on 25 March at 6:00 Local Standard Time (LST). The lowest altitude flown was 250 m and the aircraft was still above the nocturnal inversion. Approximately 3 h af-ter sunrise at 9:13 LST on 28 March the mixed layer height was 800 m and subsequently grew under undisturbed
con-ditions at an average rate of 4–5 cm s−1 reaching 1170 m
at 11:00 LST. Undisturbed conditions correspond to a situ-ation where the vertical structure of the mixed layer is not perturbed significantly by convective precipitation. Our ob-servations agree with earlier measurements in central Ama-zonia, where average boundary layer growth rates were
es-timated to be of the order of 5 cm s−1 with maxima of
10 cm s−1 during the first two hours after sunrise (Martin
et al., 1988). The maximum mixed layer height of 1200– 1500 m was observed around noon and early afternoon. The fully developed daytime mixed layer collapsed rapidly when input of solar energy disappeared at sunset. The 2 verti-cal profile at 18:06 LST on 26 March already shows the ab-sence of an active daytime mixed layer. The shallow noctur-nal mixed layer was forming below the lowest measurement
altitude and the measurements were performed in a recently formed residual layer.
3.2.2 Aerosol vertical distribution.
The vertical profiles, which we used to demonstrate the di-urnal cycle of the mixed layer height, are also used here to investigate diurnal changes in the vertical distribution of aerosols within the first 5 km of the troposphere (Fig. 5).
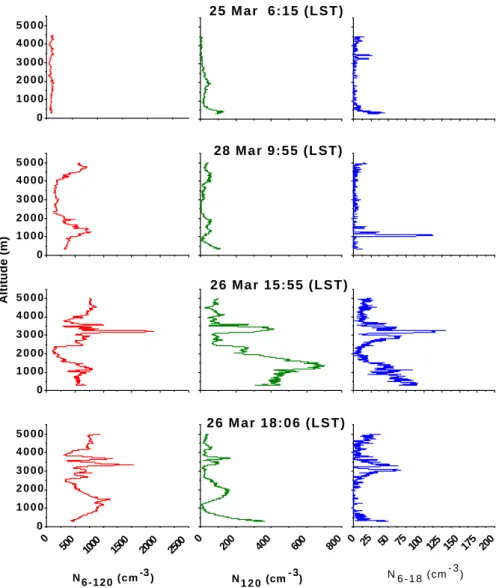
At 6:15 LST on 25 March the aerosol vertical distribu-tion showed a fairly homogenous structure and the integral
aerosol number density varied between 200 and 400 cm−3.
At the lowest altitudes we observed an enhancement of the
accumulation mode aerosol. The N120 number density of
about 100 cm−3below 400 m altitude is approximately 5–10
times higher than aloft. This profile was obtained approxi-mately 15 min after sunrise and the increase in the N120
num-ber density is most likely related to lofting of the nocturnal mixed layer into the growing daytime mixed layer.
Approximately 4 h after sunrise at 9:55 LST the peak in the N6−120 aerosol (particles between 0.006 µm and 0.12 µm)
vertical distribution followed the growth of the daytime
mixed layer. The N6 aerosol number concentration stayed
fairly constant close to 400 cm−3up to the top of mixed layer at 950 m altitude. Local enhancements in the aerosol concen-tration just above the top of the mixed layer were observed between 950 and 1500 m altitude. The accumulation mode
34 0 1 0 0 0 2 0 0 0 3 0 0 0 4 0 0 0 5 0 0 0 0 500 1000 1500 2000 2500 0 1 0 0 0 2 0 0 0 3 0 0 0 4 0 0 0 5 0 0 0 0 200 400 600 800 0 25 50 75100 125 150 175 200 0 1 0 0 0 2 0 0 0 3 0 0 0 4 0 0 0 5 0 0 0 0 1 0 0 0 2 0 0 0 3 0 0 0 4 0 0 0 5 0 0 0 N 6-120 (cm-3) N 120 (cm- 3) N 6-18 (cm - 3 ) 2 6 M a r 1 8 : 0 6 ( L S T ) Altitude (m) 2 6 M a r 1 5 : 5 5 ( L S T ) 28 Mar 9:55 (LST) 2 5 M a r 6 : 1 5 ( L S T )
Figure 5. Vertical profiles of the N6-120, N120 and N6-18 aerosol number densities over the identical
area of the rain forest during different parts of the day. The profiles cover the lower troposphere from 0.25 km to 5 km altitude.
Fig. 5. Vertical profiles of the N6−120, N120and N6−18aerosol number densities over the identical area of the rain forest during different
parts of the day. The profiles cover the lower troposphere from 0.25 km to 5 km altitude.
aerosol N120 remained low and comparable to the first
pro-file at 6:15 LST, hence the enhancement in integral aerosol number density is related to the increase of Aitken mode par-ticles. The ultrafine N6−18particles showed an enhancement
up to 110 cm−3close to the top of the mixed layer.
Late in the afternoon at 15:55 LST the aerosol vertical
dis-tribution showed a very different structure. Observed N6
aerosol number densities in the mixed layer, now reaching up to 1100 m, increased by factor of 1.5 for integral aerosol number density and by factor of 4 for the accumulation mode aerosol in comparison to the early morning profile. Now there is a pronounced maximum for N120particles in a
tran-sitional layer between 1100 m and 1600 m in addition to the earlier observed maximum for the Aitken mode aerosol. The cloud base was observed by the operators onboard of the air-craft to be between 1600 m and 1800 m altitude.
Elevated aerosol number densities related to the outflow from shallow convective clouds were often observed be-tween 3 and 4 km altitude during the late afternoon. Air-borne LIDAR observations over central Amazonia showed that the majority of the fair-weather cumulus clouds do not have enough buoyancy to penetrate the Trade Wind Inver-sion (TWI) at the top of the transition layer and therefore cloud outflow appears at similar altitudes over large areas of the rain forest (Browell et al., 1988). The TWI height during LBA-CLAIRE 98 was determined from temperature, rela-tive humidity and wind profile measurements and varied be-tween 3.2 km over the coastal region and 4.5 km altitude over the southern Suriname. Enhanced particle number densities were observed in 20 out of 24 vertical profiles over the rain forest at this altitude and were a common feature during the LBA-CLAIRE 98 campaign. However, enhancements of the accumulation mode aerosol in the shallow convective outflow
35 5000 4000 3000 2000 1000 0 Altitude (m) 104 103 102 101 100 N6, N6-18, N120 (cm-3) 4000 3000 2000 1000 0 2 3 4 5 6 0.1 2 3 4 5 6 1 2 dN/dlogDp(cm -3 ) Size (µm)
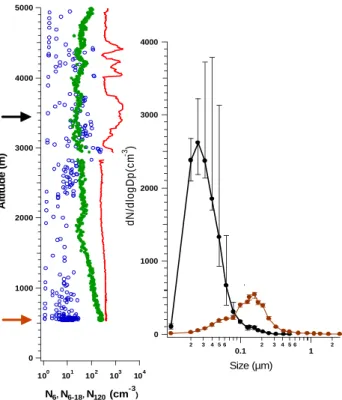
Figure 6. Vertical aerosol distributio n observed on 15 March at 15:50 LST over southern
Suriname based on 1 Hz data ( N6, ο N6-18, • N120). The median aerosol size distribution from
3.4 km altitude is made of 16 one minute size distributions collected between 14:51 and 15:06 LST. The aerosol size distribution at 0.6 km altitude is made of 19 size distributions collected between 15:29 and 15:47 LST. The error bars represent lower and upper quartiles. The arrows mark the altitude where the aerosol size distributions were measured.
Fig. 6. Vertical aerosol distribution observed on 15 March at 15:50 LST over southern Suriname based on 1 Hz data (– N6, o
N6−18, • N120). The median aerosol size distribution from 3.4 km
altitude is made of 16 one minute size distributions collected be-tween 14:51 and 15:06 LST. The aerosol size distribution at 0.6 km altitude is made of 19 size distributions collected between 15:29 and 15:47 LST. The error bars represent lower and upper quartiles. The arrows mark the altitude where the aerosol size distributions were measured.
were not measured regularly and the profile at 15:55 LST on 26 March is rather exceptional. The N6number density up to
1700 cm−3in the shallow convective outflow from a profile
performed at 15:55 LST exceeded the N6particle
concentra-tions in the mixed layer by a factor of 2–3, while the N120
number densities around 350 cm−3in the cloud outflow
re-gion are similar to those in the mixed layer. This suggests that the observed enhancement is the result of detrainment of mixed layer air and that little accumulation mode parti-cle loss occurred during in-cloud vertical transport. Usually when the outflow from shallow convection was present, only
slight enhancement in N120 aerosol or in some cases even
depletion of N120aerosol was observed, indicating different
removal efficiency for the accumulation mode aerosol during vertical in-cloud transport.
Shortly after sunset at 18:06 LST, in the absence of in-tensive convective mixing, the aerosol vertical distribution changed again adapting accordingly to the nocturnal
strat-ification. The outflow from decaying shallow convective
clouds was now observed above 3 km altitude.
Our aerosol instrumentation allowed measurements of the aerosol size distribution only during horizontal flight legs. Unfortunately, we did not perform any horizontal flight legs in the shallow convective outflow on 26 March. To show the aerosol size distribution in this region we therefore used data obtained during a flight on 15 March over southern Suri-name close to 2◦N and 56◦W. The vertical profile between 0.5 and 5 km altitude at 15:50 LST as well as the aerosol size distributions from 3.4 km and 0.6 km altitude are shown in Fig. 6. The aerosol did not exhibit pronounced vertical strat-ification in comparison to the 26 March observations. The operators onboard of the aircraft reported hazy conditions in the mixed layer and a dense fair-weather cumulus cloud cover. The measurements were performed over the upland region and local orographic forcing could have also modified the structure of the lowermost troposphere.
The mixed layer aerosol size distribution observed at 0.6 km altitude exhibited a maximum in the accumulation mode having similar shape as the afternoon mixed layer aerosol size distribution from 26 March (Fig. 7). In the re-gion of shallow convective outflow the accumulation mode particles are largely depleted, indicating that the majority of the particles from the mixed layer have been activated into cloud droplets and removed before the air was detrained from the clouds close to the TWI. The average N120concentration
was 49 cm−3 (n=790, σ =15). Ground based measurements
of aerosol activation showed that during typical background conditions over the rain forest the observed CCN/CN ratio was high, indicating that at 1.5% supersaturation the major-ity of the particles larger than 0.04 µm are activated into the cloud droplets (Roberts et al., 2001).
The aerosol size distribution observed at 3.4 km altitude in the region of shallow convective outflow was dominated
by Aitken mode particles. The mean N6number density of
2433 cm−3 (n=790, σ =871) was 4 times higher than in the
mixed layer and in the lowermost free troposphere, indicat-ing recent new particle formation. Similar observations in the vicinity of clouds were reported earlier for marine condi-tions (Clarke et al., 1998b; Hegg et al., 1990) as well as for the continental boundary layer clouds (Keil and Wendisch, 2001).
3.2.3 Mixed layer aerosol diurnal cycle
During three consecutive flights on 25, 26 and 28 March the aircraft performed several horizontal flight legs at 200– 300 m altitude over the same part of the rain forest to investi-gate changes in aerosol and trace gas distribution at different times of the day. In addition, measurements in the nocturnal residual layer were made shortly before sunrise on 25 March. The duration of the flight legs was between 6 and 34 min. At cruising air speed of 100 m s−1this represents distances be-tween 36 and 204 km.
The aerosol properties in the nocturnal residual layer ob-served on 25 March (5:38–5:58 LST) (Fig. 7) resembled
36
400 800 1200 400 800 1200 0,01 0,1 1 400 800 1200 0,01 0,1 1 25 Mar 5:38 - 5:58 300 m 25 Mar 7:16 - 7:22 200 m dN/dlogDp (cm -3 ) 28 Mar 9:18 - 9:52 300 m Size (µm ) 26 Mar 16:00 - 16:33 300 m 26 Mar 17:43 - 18:04 300 m 28 Mar 11:06 - 11:22 300 mFigure 7. Median aerosol size distributions observed during several low altitude flights between
21 March and 28 March 1998. The dotted line represents the MBL size distribution observed on
21 March. The remaining size distributions were obtained over the rainforest between 25 March
and 28 March. The altitude and time for each size distribution is given. The dots represent actual
measurements. The solid line indicates fitted size distribution.
Fig. 7. Median aerosol size distributions observed during several low altitude flights between 21 March and 28 March 1998. The dotted
line represents the MBL size distribution observed on 21 March. The remaining size distributions were obtained over the rainforest between 25 March and 28 March. The altitude and time for each size distribution is given. The dots represent actual measurements. The solid line indicates fitted size distribution.
closely the situation in the MBL in several aspects. The
mean N6 concentration of 365 cm−3 (n=1756, σ =52) was
similar to the MBL mean concentration of 383 cm−3. The
accumulation mode aerosol N120 represented 45% of the
aerosol by number in both, the nocturnal residual layer and the MBL. Therefore it is not surprising that the aerosol size distributions were also very similar in shape. The fit parameters for the median size distribution are
N=135 cm−3, Dp=0.042 µm, σ =1.57 for the Aitken mode
and N=165 cm−3, Dp=0.150 µm, σ =1.44 for the
accumula-tion mode. The origin of the air in the nocturnal residual layer is discussed later.
The aerosol properties in the daytime mixed layer over the rain forest showed two distinct patterns depending on
the time of the day. The first group of observations is
linked to the growing mixed layer lasting from sunrise until around noon. The second group of measurements represents a fully developed mixed layer during the afternoon and early evening. The integral aerosol number densities observed in the daytime mixed layer are summarized in Table 1.
The N6 aerosol number density increased constantly
throughout the day from below 500 cm−3 one hour after
sunrise up to almost 800 cm−3 at sunset. The
accumula-tion mode aerosol N120 exhibited a different trend. During
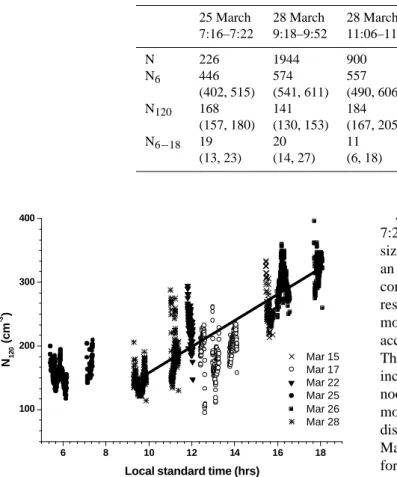
Table 1. Summary of the observed N6, N120and N6−18number densities (cm−3STP) in the mixed layer over the rainforest. N indicates
number of observations. Median values and lower and upper quartiles in parentheses are given for every parameter. The time is a local standard time (LST).
25 March 28 March 28 March 26 March 26 March
7:16–7:22 9:18–9:52 11:06–11:22 16:00–16:33 17:43–18:04 N 226 1944 900 1892 1188 N6 446 574 557 693 778 (402, 515) (541, 611) (490, 606) (608, 864) (614, 794) N120 168 141 184 298 317 (157, 180) (130, 153) (167, 205) (279, 318) (298, 334) N6−18 19 20 11 32 38 (13, 23) (14, 27) (6, 18) (23, 53) (26, 48) 37 6 8 10 12 14 16 18 100 200 300 400 N120 (cm -3 )
Local standard time (hrs)
Mar 15 Mar 17 Mar 22 Mar 25 Mar 26 Mar 28
Figure 8. Accumulation mode aerosol (N120) number densities observed between 15 March and
28 March during 6 flights in the mixed layer over the rainforest south of 4.5 oN. The symbols
represent 10 sec average aerosol number densities. The solid line indicates the linear regression discussed in section 3.2.3.
Fig. 8. Accumulation mode aerosol (N120)number densities ob-served between 15 March and 28 March during 6 flights in the mixed layer over the rainforest south of 4.5◦N. The symbols repre-sent 10 sec average aerosol number densities. The solid line indi-cates the linear regression discussed in Sect. 3.2.3.
constant at values between 150 and 200 cm−3, while in the
afternoon an increase by approximately 50% up to 300 cm−3
was observed. The ultrafine particles N6−18showed a trend
similar to the accumulation mode aerosol with lower parti-cle number densities close to 20 cm−3, during the morning,
followed by an increase to 30–40 cm−3in the afternoon.
The different trends described above become more evident when the aerosol size distributions from five horizontal flight legs are analysed. We have used median aerosol size distri-butions to highlight the diurnal changes (Fig. 7). In general, they show very similar shapes and peak positions within each horizontal flight leg, so that the median size distributions can be regarded as a good representation of the typical condi-tions. Single aerosol size distributions are obtained every minute, so that the number of size distributions during each flight leg range from 6 to 34, as indicated by the difference between start and stop times given in Fig. 7.
Approximately one hour after sunrise between 7:16 and 7:22 LST, when the mixed layer was growing, the aerosol size distribution had a pronounced bimodal shape, showing an increase in the number density of Aitken mode particles in comparison to the measurements performed in the nocturnal residual layer 2 h earlier. The fit parameters for the Aitken
mode are N=230 cm−3, Dp=0.044 µm, σ =1.60 and for the
accumulation mode N=200 cm−3, Dp=0.142 µm σ =1.49.
The number of particles in the Aitken mode continued to increase throughout the morning hours such that around noon the aerosol size distribution was dominated by Aitken mode particles. The modal parameters for the aerosol size distribution obtained between 11:08 and 11.28 LST on 28
March are following: N=310 cm−3, Dp=0.053 µm, σ =1.50
for the Aitken mode and N=220 cm−3, Dp=0.144 µm,
σ=1.42 for the accumulation mode. During the second
half of the day the shape of size distribution continued
to change, but in a different manner. The Aitken mode
remained relatively constant, while the number of parti-cles in the accumulation mode increased. The fit param-eters for aerosol size distribution observed shortly before the sunset on 26 March (17:43–18:04 LST) were as follows:
N=250 cm−3, Dp=0.051 µm, σ =1.62 for the Aitken mode
and N=420 cm−3, Dp=0.132 µm and σ =1.46 for the
accu-mulation mode.
Although the proportions between the Aitken and accu-mulation modes varied with time of day, the bi-modal shape of the aerosol size distributions was always preserved. A similar observation have been reported from ground-based measurements at Balbina in central Amazonia, where the bi-modal shape of the aerosol size distribution was observed in nearly 80% of the cases during March–April 1998 (Zhou et al., 2002).
To demonstrate that the observed evolution of the aerosol size distributions was not only a local feature, we combined all measurements from the mixed layer obtained during 6 flights between 15 and 28 March over the pristine rain forest
south of 4.5◦N. The 10 s mean N120 aerosol number
interpolation of increasing number densities between 10:00
and 18:00 LST we find that the number density of N120
in-creased by 20 particles cm−3h−1(n=1210, r2=0.75).
4 Discussion
4.1 Nocturnal residual layer over the rain forest
There is a striking similarity in shape of the size distribution and aerosol number densities between the MBL and the noc-turnal residual layer observed at 300 m (Fig. 7). This feature was also observed at 500 m altitude (not shown). Our obser-vations suggest that marine air can be transported more than 300–400 km over the rain forest during the night without sig-nificant influence from the sources on the ground.
A low-level jet was observed before sunrise between 300 m and 1800 m over the rain forest with the wind direction following the NNE trade winds. The wind velocity reached up to 15 m s−1, triple the average wind velocity observed at this altitude during the daytime. At altitudes where aerosol size distribution measurements from the residual layer before sunrise are available, the wind speed was in average 8 m s−1, which is almost identical to the observations made over the ocean. The distance the air had to travel between the coast and the area where we conducted the measurements over the rain forest was approximately 280 km.
The single particle analysis performed on samples from the nocturnal residual layer (1 sample), the MBL (3 samples) and the daytime mixed layer (7 samples) support this finding. Around 100 particles larger than 0.2 µm were analyzed per sample using SEM-EDX technique. In the fully developed daytime mixed layer 48–58% of the sub-micrometer parti-cles were classified to be of organic nature. In the MBL the fraction of such particles was between 11 and 25%, similar to the nocturnal fossil layer aerosol observations (22%). Sub-micrometer particles identified as sea salt or sea salt with sul-phur represented 5–11% of all particles in the daytime mixed layer. In the MBL, the fraction of these particles was 22– 36% similar to the nocturnal fossil layer observations (26%). The results of aerosol single particle analysis are discussed in detail in Krejci et al. (2004).
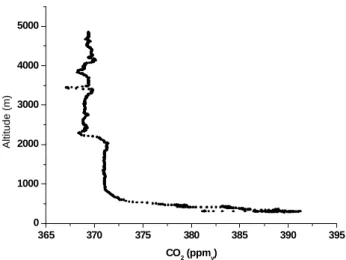
In Fig. 9, CO2 mixing ratios observed during a vertical
profile at 6:15 LST on 25 March is shown. The profile was obtained approximately 15 min after sunrise. The decaying
nocturnal mixed layer with enhanced CO2mixing ratios up
to 390 ppmv due to a rain forest respiration is clearly
visi-ble. Above the mixed layer a region with stable CO2mixing
ratios around 371 ppmv is found, extending to the base of
the trade wind inversion at 2300 m altitude. The mean CO2
mixing ratio 370.4 ppmv (n=1703, σ =0.5 ppm) observed in
the MBL during the CLAIRE campaign was very similar to the observations above the decaying nocturnal mixed layer.
The CO2 measurements support the hypothesis about
noc-turnal transport of the MBL inland over the rain forest. In
38 365 370 375 380 385 390 395 0 1000 2000 3000 4000 5000 Altitude (m) CO2 (ppmv)
Figure 9. Vertical profile of CO2 mixing ratios performed at 6:15 LST on 25 March.
Fig. 9. Vertical profile of CO2mixing ratios performed at 6:15 LST on 25 March.
case that air above the nocturnal mixed layer up to 2.3 km altitude would contain previous day continental mixed layer air, it will be depleted of CO2, compared to the MBL air, due
to photosynthesis depletion of CO2. On the other hand, if
the air would represent nocturnal mixed layer, the
concen-tration of CO2will be enhanced compared to MBL due to a
nighttime respiration of tropical vegetation (Williams et al., 2001).
Only a true “lagrangian” or “semi-lagrangian” approach in association with several nocturnal vertical profiles between the coast and deeper over the rain forest, including trace gas measurements, for example DMS, can confirm the hypoth-esis about nocturnal transport of the unperturbed MBL air over the rain forest. Such an experiment is also needed to better understand how far the MBL air can be transported unperturbed over the rain forest.
4.2 Aerosol size distribution evolution in the mixed layer
over the rain forest
The observed diurnal evolution of the aerosol size distribu-tion in the daytime mixed layer suggests a complex interplay of several processes that control the aerosol properties over the rain forest. During the conditions of a growing daytime mixed layer from the early morning until noon the number of Aitken mode particles increases, however, the accumulation mode aerosol number densities remained relatively constant.
4.2.1 Aitken mode aerosol and new particle formation
The shape of the aerosol size distribution between 0.006 and 3.5 µm as well as the derived aerosol surface from observed over the rain forest (6.1–6.5 µm2cm−3)during the morning on 28 March is similar to the MBL aerosol (6.6 µm2cm−3). The growth of the aerosol particles via coagulation and condensation is controlling the formation and evolution of
Aitken mode particles (Williams et al., 2002). In the tropical marine environment the Aitken mode aerosol number densi-ties are rather constant mostly due to transport from the free troposphere with subsiding air (Clarke et al., 1998b; Raes et al., 2000). This mechanism, however, cannot explain our observations over the rain forest. The rapid increase of the Aitken mode aerosol concentrations in the mixed layer by approximately 40% between 7:20 and 11:10 LST together with the fact that height of the mixed layer doubled during this time, requires another source of particles. One possible source of the new particles could be the occurrence of the new particle bursts similar to those reported from a boreal forest in Finland (Boy and Kulmala, 2002). Due to spatial and temporal limitations we cannot address this issue, but during the ground-based measurements in March–April 1998 at Balbina in central Brazil, no such events of new particle formation were reported (Zhou et al., 2002). The absence of new particle formation bursts over the Amazon rain forest, as well as over Amazonian pastures, was confirmed during subsequent campaigns (Rissler et al., 2004) (Erik Swietlicki, Lund University, Sweden personal communication). When the newly formed particles appeared at the site, they had al-ready grown to sizes larger than 0.02 µm indicating that the particles were not formed close to the ground, but most likely aloft. The low aerosol number densities in the smallest size bins observed during growing mixed layer conditions also suggest that the new particles were formed somewhere else.
The vertical profile from 6:15 LST (Fig. 7) showed an en-hancement of ultrafine N6−18 particles in a shallow layer at
altitude corresponding to the break up of the nocturnal in-version and formation of the daytime mixed layer. A similar
local maximum of N6−18particles up to 110 cm−3
accompa-nied by a broader peak of the N6−120aerosol was observed at
9:55 LST (Fig. 7) in a region where the subsiding air meets the top of growing mixed layer. Mixing of the two different air masses together with different temperature in this region can enhance new particle formation (Nilsson et al., 2001). However, with our instrumentation we can detect only par-ticles larger than 6 nm and it takes up to several hours for nanometer sized new particles to grow to detectable sizes. Clarke et al. (1998a) estimated the time required for parti-cles to grow from nanometer sized clusters to detectable size (3 nm) to be between 1 and 2 h under marine boundary layer conditions over the eastern Pacific. Similar values were re-ported for continental boundary layer over a boreal forest in Finland (Nilsson et al., 2001). The authors also suggested that the residual layer is the place where aerosol particles are formed via ternary H2O-H2SO4-NH3nucleation (Kulmala et
al., 2000). But their further growth to detectable sizes is hin-dered by low concentrations of condensable vapours. After entrainment into the mixed layer, where the supply of con-densable vapours is larger, the particles may grow rapidly to detectable sizes. Such a mechanism might explain the local
enhancement of N6−18and N6−120aerosol observed close to
the top of the mixed layer.
It is still not well understood, which condensable vapours will participate in formation and condensational growth of the aerosol over the rain forest. There is increasing evidence that volatile organic compounds play an important role,
be-sides SO2 and other inorganic gaseous precursors. Among
the most likely candidates are oxidation products of isoprene (Claeys et al., 2004), monoterpenes (sabinene, α-pinene, β-pinene, limonene) and their oxidation products (Jacobson et al., 2000; Kuhn et al., 2002; Seinfeld and Pankow, 2003). During the field measurements in Amazonia, monoterpene mixing ratios between 200–900 ppt were found (Kesselmeier et al., 2000), similar to observations from the boreal forest in Finland (Janson et al., 2001), where the authors found no evidence of monoterpenes participating in nucleation. However, the secondary products of monoterpenes oxidation contributed to the organic aerosol mass via condensation. Ground-based measurements in Brazil showed the unimodal hygroscopic behaviour of the Aitken mode particles with low growth factors around 1.17 at 90% RH. Assuming that the soluble part of the particle was ammonium bi-sulphate, the soluble fraction would amount to only 14–17% of the parti-cle (Zhou et al., 2002). The remaining fraction of the aerosol is largely composed of insoluble or partially water-soluble organics (Graham et al., 2003b), emphasising the importance of organic material in formation of the aerosol particles over the rain forest. Besides monoterpenes, other VOCs, for ex-ample sesquiterpenes, can also play important role in new particle formation due to their very fast oxidation with O3
and OH radical (Bonn and Moortgat, 2003; Dekermenjian et al., 1999; Shu and Atkinson, 1995). Sesquiterpenes have been detected in the atmosphere during flux measurements in central Amazonia, however, the source strength and fate of the sesquiterpenes over the rain forest are virtually unknown (P. Ciccioli, Institute of Chemical Methodology, Italy; per-sonal communication).
4.2.2 Accumulation mode temporal evolution over the
rain-forest
The rapid increase of the accumulation mode number den-sities during the afternoon (Fig. 6) cannot be explained ex-clusively by the growth of the Aitken mode via condensation and coagulation. Those processes are too slow or they would require unrealistically high concentrations of the gaseous precursors and aerosols.
It is generally acknowledged, that in the absence of large surface sources of accumulation mode aerosol, in-cloud pro-cessing of activated Aitken mode particles is a major source of these particles. Airborne transects over central Amazo-nia involving LIDAR measurements showed rapid intensi-fication of the shallow convection around noon and in the afternoon (Browell et al., 1988), at the same time when we observed a widespread increase of the accumulation mode aerosol concentrations.
The in-cloud processed particles can be transported back to the mixed layer either by precipitation and downdraft from the cumulus clouds or by large scale subsidence from higher altitudes in between clouds. The in-between cloud subsi-dence is unlikely to be important for several reasons. First, for majority of vertical profiles we observed depletion rather than enrichment of accumulation mode aerosol in the prox-imity of shallow convective outflow. Second, the major part of the cloud outflow region was observed close to the TWI at altitudes above 3000 m. However, even though the shal-low convection over the rain forest increases the mean subsi-dence velocity up to 60–100 m hr−1(Fitzjarrald, 1982; Mar-tin et al., 1988), it will take more then 10–20 h for accumu-lation mode particles to be transported from the region of shallow convective outflow to the mixed layer. Third, the N120aerosol number density in the afternoon mixed layer is
on average 6 times higher than in the subsiding air between clouds (Krejci et al., 2003) and therefore the result of the en-trainment of the subsiding air will rather be dilution and di-minishing of the accumulation mode aerosol concentrations. The increase of the accumulation mode number densities was observed to happen over a rather short time period of the order of several hours, much faster than indicated by modelling studies for MBL conditions where, the in-cloud processing was the major source of the accumulation mode aerosol (Raes et al., 2000). The second important aspect is the mass needed to produce the observed amount of accu-mulation mode particles. In general, sulfate is believed to be the main contributor to the particle mass during in-cloud processing. There are no large sources of sulfur-containing gaseous precursors over the rain forest and transport of the
marine DMS is believed to be the dominant source of SO2
over the rain forest (Andreae et al., 1990; Crutzen et al., 2000). The single particle analysis did not show enrichment of S-rich particles >0.2 µm during the afternoon hours in the mixed layer over the rain forest (Krejci et al., 2004). As men-tioned earlier, the observed concentrations of organic gases, such as monoterpenes (Kesselmeier et al., 2000), which can significantly contribute to the aerosol mass via condensation were not exceptionally high. Unless there were other, so far undiscovered species contributing significantly to the aerosol mass during the in-cloud processing, e.g. the fast reacting VOCs proposed by Kurpius and Goldstein (2003), a domi-nant source of accumulation mode particles during the after-noon was probably located at the surface. Here emissions of primary biogenic particles from the rain forest are the most likely candidate.
The magnitude of primary emissions of biogenic aerosols is difficult to estimate due to a paucity of available data. The single particle analysis of the samples from the MBL and from the mixed layer over the rainforest combined with the aerosol number densities derived from the aerosol size dis-tributions (Krejci et al., 2004), showed that the number den-sities of the organic particles larger than 0.2 µm increased
from 2–10 cm−3to 20–40 cm−3 in 7–12 h when the marine
air masses were transported inland and interacted with the rain forest. This can only explain a small fraction (10–25%) of the observed increase in the accumulation mode aerosol number densities. Extrapolation of the single particle anal-ysis to smaller sizes could lead to a misinterpretation, how-ever, since there is no evidence that the abundance of the dif-ferent types of particles should be difdif-ferent for various size ranges of accumulation mode aerosol. Assuming the same aerosol composition for the entire accumulation mode, the primary biogenic aerosol emissions may account for 50–85% of the observed increase in accumulation mode aerosol num-ber densities.
In addition to local aerosol sources, long-range transport of Saharan dust can also contribute to the accumulation mode aerosol over the Amazonian rain forest. We cannot fully exclude Saharan dust contribution to the observed vari-ability, but measurements over the Amazonia during LBA-CLAIRE 98 indicate, that such an influence was of minor importance with respect to the observed trends in the aerosol number densities discussed in this paper. The continuous ground-based measurements from Balbina in central Amazo-nia showed, that the aerosol light scattering below 10 Mm−1 represents background conditions and the influence of Sa-haran dust is considered to be low (Formenti et al., 2001). The same authors reported aerosol light scattering coefficient in the mixed layer over the rainforest on 25 March to be
around 10 Mm−1 STP and one day later on 26 March five
times lower around 2 Mm−1STP. Single particle analysis of
the mixed layer aerosol showed that the fraction of mineral
particles observed on 26 March when the N120number
den-sities were highest was not different from six other samples collected in the mixed layer over the rainforest (Krejci et al., 2004). These particles contributed roughly one percent to the accumulation mode aerosol number densities. Therefore the Saharan dust cannot explain the increase of the accumulation mode number densities presented here.
The cycle of the accumulation mode aerosol concentra-tions in the mixed layer agrees well with the moisture flux from the vegetation. The flux of moisture from the rain forest intensifies shortly before noon and the highest values are reached during the afternoon (Garstang and Fitzjarrald, 1999). One can speculate that the primary emissions of bio-genic particles can be linked to the same processes control-ling the evapotranspiration: stomatal activity and the dynam-ics of the canopy ventilation. A dedicated aerosol flux mea-surement experiment could shed some light on this proposed source.
5 Summary and Conclusions
In this study we presented airborne measurements of aerosol microphysical and chemical properties below the trade wind inversion over the tropical rain forest and from the marine
Suriname and the adjacent part of the Atlantic Ocean during the LBA-CLAIRE 98 project.
The MBL aerosol showed the typical bi-modal size dis-tribution with a “Hoppel minimum” at 0.08 µm characteris-tic of well aged and cloud processed aerosol. The average number density of the particles larger than 0.006 µm was
383 cm−3 and the accumulation mode aerosols >0.12 µm
represented 45–50% of the particles by number.
Using potential temperature profiles, the daytime mixed layer height over the rain forest during undisturbed condi-tions was estimated to be between 1200–1500 m. During morning hours the growth rate of the mixed layer was 144– 180 m h−1.
The aerosol properties in the nocturnal residual layer over the rain forest some 300 km from the coast exhibited strong similarities with aerosol properties found in the MBL. The analysis of the aerosol number densities, aerosol size distri-butions and aerosol composition suggest that the marine air masses can be transported intact 300–400 km inland during the night without significant modifications.
The median aerosol number density in the daytime mixed layer increased from early morning to early evening from 450 cm−3to almost 800 cm−3, respectively. The evolution of the aerosol size distribution in the daytime mixed layer showed two distinct patterns. During the period of the grow-ing mixed layer we observed an increase of the Aitken mode particle number densities. The formation of new particles in the border region between the growing mixed layer and remnant of the previous day residual layer, followed by rapid growth of the ultrafine aerosol in the mixed layer, are proba-bly responsible for the observed increase of the Aitken mode aerosol number densities in the conditions of growing mixed layer.
The accumulation mode aerosol showed a different trend. Before noon the N120(particles >0.12 µm) number densities
remained relatively stable close to 150 cm−3. Later during
the day a sharp increase in the N120 number densities was
observed, doubling the number densities up to 300 cm−3.
We attribute the observed increase in the accumulation mode aerosol number densities to the combined effect of two pro-cesses: (1) the direct emissions of the primary biogenic particles from the rainforest and (2) in-cloud processing of aerosol by the shallow convective clouds. The first process is dominating and accounts for approximately 50–85% of the observed increase of the accumulation mode number den-sities. We presented strong evidence that the rain forest is a major source of accumulation mode aerosols and that di-rectly emitted biogenic aerosol particles most likely control the accumulation mode number densities observed over the Amazonian rain forest during periods when biomass burning activity is low.
Future measurements should be focussed especially on the nocturnal lower troposphere, on an estimate of the direct aerosol emissions from rainforest and on the role of the shal-low convective clouds. This information is necessary to get
a better understanding of the processes controlling aerosol diurnal cycle over the tropical rain forest.
Acknowledgements. We would like to thank the crew and technicians of the Cessna Citation aircraft and the Suriname Meteorological Office for their support during the whole campaign, together with KNMI for the flow field calculations. This research is part of the project Large-Scale Biosphere/Atmosphere Experiment in Amazonia (LBA). The campaign has been performed within the international research school COACh (Collaboration on Oceanic, Atmospheric and Climate Change Studies) supported by the German and Dutch Ministries of BMBF and OC&W, respectively, and by the Max-Planck-Society. Special acknowledgement goes to L. B¨acklin and N. Walberg from Stockholm University for their technical assistance in payload construction. The Swedish Research Council (Vetenskapr˚adet), former Swedish Natural Science Council (NFR), financially supported Swedish group participation on the LBA – CLAIRE 98 project.
Edited by: L. Carpenter
References
Andreae, M. O., Artaxo, P., Brandao, C., Carswell, F. E.,Ciccioli, P., da Costa, A. L., Culf, A. E., Esteves, J. L., Gash, H. C., Grace, J., Kabat, P., Lelieveld, J., Malhi, Y., Manzi, A. O., Meixner, F. X., Nobre, A. D., Nobre, C., Ruivo, M. d. L. P., Silva-Dias, M. A., Stefani, P., Valentini, R., von Jouanne, J., and Waterloo, M. J.: Biogeochemical cycling of carbon, water, energy, trace gases, and aerosols in Amazonia: The LBA-EUSTACH experiments, J. Geophys. Res., 107 (D20), Ar. No. 8066, doi:10.1029/2001JD000524, 2002.
Andreae, M. O., Berresheim, H., Bingemer, H., Jacob, D. J., Lewis, B. L., Li, S. M., and Talbot, R. W.: The atmospheric sulfur cy-cle over the Amazon Basin. 2. Wet season, J. Geophys. Res., 95 (D10), 16 813–16 824, 1990.
Andreae, M. O., Browell, E. V., Garstang, M., Gregory, G. L., Har-riss, R. C., Hill, G. F., Jacob, D. J., Pereira, M. C., Sachse, G. W., Setzer, A. W., Dias, P. L. S., Talbot, R. W., Torres, A. L., and Wofsy, S. C.: Biomass-burning emissions and associated haze layers over Amazonia, J. Geophys. Res., 93 (D2), 1509–1527, 1988.
Andreae, M. O., Rosenfeld, D., Artaxo,P., Costa, A. A., Frank, G. P., Longo, K. M., and Silva-Dias, M. A. F.: Smoking rain clouds over the Amazon, Science, 303 (5662), 1337–1342, 2004. Artaxo, P. and Hansson, H. C.: Size distribution of biogenic aerosol
particles from the Amazon basin, Atmos. Environ., 29 (3), 393– 402, 1995.
Artaxo, P., Maenhaut, W., Storms, H., and Van Grieken, R.: Aerosol characteristics and sources for the Amazon Basin during the wet season, J. Geophys. Res., 95 (D10), 16 971–16 985, 1990. Bates, T. S., Quinn, P. K., Coffman, D. J., Johnson, J. E., Miller,
T. L., Covert, D. S., Wiedensohler, A., Leinert, S., Nowak, A., and Neususs, C.: Regional physical and chemical properties of the marine boundary layer aerosol across the Atlantic during Aerosol99: An overview, J. Geophys. Res., 106 (D18), 20 767– 20 782, 2001.
Betts, A. K., Fuentes, J. D., Garstang, M., and Ball, J. H.: Surface diurnal cycle and boundary layer structure over Rondonia during the rainy season, J. Geophys. Res., 107 (D20), Art. No. 8065, doi:10.1029/2001JD000356, 2002.
Bonn, B. and Moortgat, G. K.: Sesquiterpene ozonolysis: Ori-gin of atmospheric new particle formation from biogenic hy-drocarbons, Geophys. Res. Lett., 30 (11), Art. No. 1585, doi:10.1029/2003GL017000, 2003.
Boy, M. and Kulmala, M.: Nucleation events in the continental boundary layer: Influence of physical and meteorlogical param-eters, Atmos. Chem. Phys., 2, 1–16, 2002,
SRef-ID: 1680-7324/acp/2002-2-1.
Browell, E. V., Gregory, G. L., Harriss, R. C., and Kirchhoff, V. W. J. H.: Tropospheric ozone and aerosol distributions across the Amazon Basin, J. Geophys. Res., 93 (D2), 1431–1451, 1988. Browell, E. V., Gregory, G. L., Harriss, R. C, and Kirchhoff, V. W. J.
H.: Ozone and aerosol distributions over the Amazon Basin dur-ing the wet season, J. Geophys. Res., 95 (D10), 16 887–16 901, 1990.
Charlson, R. J., Schwartz, J. M., Hales, J. M., Cess, J. A., Coakley, J. A. J., Hansen, J. E., and Hofmann, D. J.: Climate forcing by anthropogenic aerosols, Science, 255, 423–430, 1992.
Claeys, M., Graham, B., Vas, G., Wang, W., Vermeylen, R., Pashyn-ska, V., Cafmeyer, J., Guyon, P., Andreae, M. O., Artaxo, P., and Maenhaut, W.: Formation of Secondary Organic Aerosols Through Photooxidation of Isoprene, Science, 303 (5661), 1173– 1176, 2004.
Clarke, A. D., Davis, D., Kapustin, V. N., Eisele, F., Chen, G., Paluch, I., Lenschow, D., Bandy, A. R., Thornton, D., Moore, K., Mauldin, L., Tanner, D. Litchy, M., Carroll, M. A., Collins, J., and Albercook, C.: Particle nucleation in the tropical bound-ary layer and its coupling to marine sulfur sources, Science, 282 (5386), 89–92, 1998a.
Clarke, A. D., Varner, J. L., Eisele, F., Mauldin, R. L., Tanner, D., and Litchy, M.: Particle production in the remote marine atmo-sphere: Cloud outflow and subsidence during ACE 1, J. Geo-phys. Res., 103 (D13), 16 397–16 409, 1998b.
Crutzen, P. J. and Andreae, M. O.: Biomass burning in the trop-ics: Impact on atmospheric chemistry and biogeochemical cy-cles, Science, 250, 16 769–16 778, 1990.
Crutzen, P. J., Delany, A. C., Greenberg, J., Haagenson, P., Heidt, L., Lueb, R., Pollock, W., Seiler, W., Wartburg, A., and Zimmer-man, P.: Tropospheric chemical composition measurements in Brazil during the dry season, J. Atmos. Chem., 2 (3), 233–256, 1985.
Crutzen, P. J., Williams, J., P¨oschl, U., Hoor, P., Fischer, H., Warneke, C., Holzinger, R., Hansel, A., Lindinger, W., Scheeren, B., and Lelieveld, J.: High spatial and temporal resolution mea-surements of primary organics and their oxidation products over the tropical forests of Surinam, Atmos. Environ., 34 (8), 1161– 1165, 2000.
Dekermenjian, M., Allen, D. T., Atkinson, R., and Arey, J.: FTIR analysis of aerosol formed in the ozone oxidation of sesquiter-penes, Aerosol Sci. Tech., 30 (4), 349–363, 1999.
Delmas, R. A., Druilhet, A., Cros, B., Durand, P., Delon, C., La-caux, J. P., Brustet, J. M., Serca, D., Affre, C., Guenther, A., Greenberg, J., Baugh, W., Harley, P., Klinger, L., Ginoux, P., Brasseur, G., Zimmerman, P. R., Gregoire, J. M., Janodet, E., Tournier, A., Perros, P., Marion, T., Gaudichet, A., Cachier, H.,
Ruellan, S., Masclet, P., Cautenet, S., Poulet, D., Biona, C.B., Nganga, D., Tathy, J. P., Minga, A., Loemba-Ndembi, J., and Ceccato, P.: Experiment for Regional Sources and Sinks of Oxi-dants (EXPRESSO): An overview, J. Geophys. Res., 104 (D23), 30 609–30 624, 1999.
Draxler, R. R. and Hess, G. D.: Description of the HYSPLIT 4 modeling system, pp. 24, NOAA, 1997.
Draxler, R. R. and Hess, G. D.: An overview of the HYSPLIT 4 modelling system for trajectories, dispersion and deposition, Aust. Met. Mag., 47, 295–308, 1998.
Fitzjarrald, D. R.: New applications of a simple mixed layer model, Bound. Layer Meteorol., 22, 431–453, 1982.
Formenti, P., Andreae, M. O., Lange, L., Roberts, G., Cafmeyer, J., Rajta, I., Maenhaut, W., Holben, B. N., Artaxo, P., and Lelieveld, J.: Saharan dust in Brazil and Suriname during the Large-Scale Biosphere-Atmosphere Experiment in Amazonia (LBA) – Coop-erative LBA Regional Experiment (CLAIRE) in March 1998, J. Geophys. Res., 106 (D14), 14 919–14 934, 2001.
Garstang, M. and Fitzjarrald, D. R.: Observations of surface to at-mosphere interactions in the tropics, 405 pp., Oxford University Press, New York, 1999.
Graham, B., Guyon, P., Maenhaut, W., Taylor, P. E., Ebert, M., Matthias-Maser, S., Mayol-Bracero, O. L., Godoi, R. H. M., Artaxo, P., Meixner, F. X., Moura, M. A. L., Rocha, C. H. E. D., Van Grieken, R., Glovsky, M. M., Flagan, R. C., and An-dreae, M. O.: Composition and diurnal variability of the natural Amazonian aerosol, J. Geophys. Res., 108 (D24), Art. No. 4765, doi:10.1029/2003JD004049, 2003a.
Graham, B., Guyon, P., Taylor, P. E., Artaxo, P., Maenhaut, W., Glovsky, M. M., Flagan, R. C., and Andreae, M. O.: Organic compounds present in the natural Amazonian aerosol: Character-ization by gas chromatography-mass spectrometry, J. Geophys. Res., 108 (D24), Art. No. 4766, doi:10.1029/2003JD003990, 2003b.
Gregory, G. L., Harriss, R. C., Talbot, R. W., Rasmussen, R. A., Garstang, M., Andreae, M. O., Hinton, R. R., Browell, E. V., Beck, S. M., Sebacher, E. I., Khalil, M. A. K., Ferek, R. J., and Harriss, S. V.: Air Chemistry over the Tropical Forest of Guyana, J. Geophys. Res., 91 (D8), 8603–8612, 1986.
Guyon, P., Graham, B., Beck, J., Boucher, O., Gerasopoulos, E., Mayol-Bracero, O. L., Roberts, G. C., Artaxo, P., and Andreae, M. O.: Physical properties and concentration of aerosol particles over the Amazon tropical forest during background and biomass burning conditions, Atmos. Chem. Phys., 3, 951–967, 2003,
SRef-ID: 1680-7324/acp/2003-3-951.
Harriss, R. C., Garstang, M., Wofsy, S. C., Beck, S. M., Bendura, R. J., Coelho, J. R. B., Drewry, J. W., Hoell Jr., J. M., Matson, P. A., McNeal, R. J., Molion, L. C. B., Navarro, R. L., Rabine, V., and Snell, R. L.: The Amazon Boundary Layer Experiment: Wet season 1987, J. Geophys. Res., 95 (D10), 16 721–16 736, 1990. Harriss, R. C., Wofsy, S. C., Garstang, M., Browell, E. V., Molion,
L. C. B., McNeal, R. J., Hoell Jr., J. M., Bendura, R. J., Beck, S. M., Navarro, R. L., Riley, J. T., and Snell, R. L.: The Amazon Boundary Layer Experiment (ABLE 2A): Dry season 1985, J. Geophys. Res., 93 (D2), 1351–1360, 1988.
Hegg, D. A., Radke, L. F., and Hobbs, P. V.: Particle production as-sociated with marine clouds, J. Geophys. Res., 95 (D9), 13 917– 13 926, 1990.

![[PDF] Cours Base de données J2EE pdf | Cours informatique](data:image/gif;base64,R0lGODlhAQABAIAAAP///wAAACH5BAEAAAAALAAAAAABAAEAAAICRAEAOw==)