r
; !f - , fElizabeth L. Williamson
June
1992
FLIGHT TRANSFORTATION LABORATORY
REPORT R 92-3
Airline Network
Seat Inventory Control:
Methodologies and
ARCHNES
Airline Network Seat Inventory Control:
Methodologies and Revenue Impacts
by
Elizabeth Louise Williamson
S.B. Massachusetts Institute of Technology (1986)
S.M. Massachusetts Institute of Technology (1988)
Submitted to the Department of Aeronautics and Astronautics in Partial Fulfillment of the
Requirements for the Degree of Doctor of Philosophy
in Flight Transportation and Operations Research at the
Massachusetts Institute of Technology June 1992
@
Massachusetts Institute of Technology 1992Signature of Author:
Department of Aeronautics and Astronautics May 11, 1992
Certified by
Assistant Professor of
Peter Belobaba Aeronautics and Astronautics
Thesis Supervisor
Certified by 7 sct - y
-Robert W. Simpson Professor of Aeronautics and Astronautics
,,9irector,
Flight Transportation Laboratory
Certified by
-Arnold Barnett Professor of the Sloan School of Management
Accepted by
Harold Y. Wachman Professor of Aeronautics and Astronautics Chairman, Departmental Graduate Committee
Airline Network Seat Inventory Control:
Methodologies and Revenue Impacts
by
Elizabeth Louise Williamson
Submitted to the Department of Aeronautics and Astronautics on May 11, 1992 in partial fulfillment of the requirements
for the Degree of Doctor of Philosophy in Flight Transportation and Operations Research
Abstract
In the airline industry, it is customary for carriers to offer a wide range of fares for any given seat in the same cabin on the same flight. In order to control the number of seats made available in each fare class, airlines practice what is called seat inventory control. Traditionally, airline seat inventory control has been the process of allocating seats among varies fare classes on a flight leg in order to maximize expected revenues. Reservations for travel on a flight leg are accepted based on the availability of a particular fare class on that flight leg. A passenger's ultimate destination, overall itinerary, or total revenue contribution to the airline is not taken into account. The typical route structure of a large airline, however, is built around a complex network of connecting flights. Maximizing revenues on individual flight legs is not the same as maximizing total network revenues. The objective of this dissertation is to address the seat inventory control problem at the network level, taking into account the interaction of flight legs and the flow of traffic across a network.
Beginning with the traditional network formulation of the seat inventory control prob-lem, practical approaches for actually controlling seat inventories at the origin-destination and fare class (ODF) level are first discussed. To avoid problems associated with forecast-ing ODF itinerary demand, network methods based on aggregated demand estimates are then presented. Taking the network seat inventory control problem one step closer to fit in with current reservations control capabilities, several leg-based heuristics are introduced. These heuristics take into account information about different ODF passenger demand and traffic flows while optimization and control of seat inventories remains at the flight leg level. In order to effectively measure the revenue potential of the different network seat inven-tory control methods introduced, an integrated optimization/booking process simulation was developed. Specific issues related to realistically modeling the booking process are discussed and the multi-period, computer-based, mathematical simulation described in de-tail. With the use of this integrated optimization/booking process simulation, the revenue impacts of the different network seat inventory control methodologies are then evaluated using real airline data for both a connecting hub network and multiple flight leg networks. Overall performance of each method is examined by comparing the revenue obtained with that of current leg-based control approaches and the maximum revenue potential given perfect information.
The performance of the different methods evaluated varies with both the network and the actual demand patterns, however, significant revenue impacts over current seat inven-tory control approaches can be obtained. One approach which consistently performs well
is a deterministic network approach in which ODF seat allocations are nested by shadow prices. Depending on the network structure, other leg-based OD control heuristics also perform well. The benefits of network seat inventory control are a function of the load factor across a network. Below an average load factor of about 85%, revenue impacts over effective leg-based control are non-existent. However, as the average load factor increases, revenue impacts on the order of 2-4% are obtainable.
Thesis Supervisor: Professor Peter Belobaba
Acknowledgements
I would like to thank my advisor, Professor Peter Belobaba, for all his support during my years as a graduate student at MIT. He has been there from start to finish, helping to develop the direction of this research project, providing guidance along the way, and proof-reading several versions of this manuscript.
I would also like to express my gratitude to both my readers, Professor Robert Simpson and Professor Arnold Barnett. They have both contributed a great deal to this research effort with their technical knowledge and helpful suggestions.
This research has been partially funded by Air Canada and Northwest Airlines. I would like to particularly acknowledge Yvan Corriveau, Jacques Cherrier, Steve Elkins, and Barry Freedman for technical discussions.
I am very grateful to Pat and Brian Dixon for their generosity and love ever since my first term as a freshman at MIT. Also thanks to Lori Martinez and her family for their friendship and encouragement.
Thanks to my friends: Tony Lee and Grace Zabat for discussions on their insight into the airline industry, Tom Svrcek for general amusement and Sharon Els for her special friendship. A special thanks to the entire MTL gang for all the good times, especially Joe Lutsky, Kathy Krisch, JP Mattia, Steve Decker, Shujaat Nadeem, Rod Hinman, Gee Rittenhouse, Curtis Tsai, Julie Tsai, Patrice Parris, Andrew Karanicolas, Fritz Herrmann, and Craig Keast.
Without my family I would not have made it this far. I sincerely thank them for their love and support throughout my life and for all the special times we have together.
Most importantly, I thank my husband, Jeffrey, for always being there. His love and support will always mean the most to me.
Contents
1 Introduction 13
1.1 Goal of Dissertation . . . . 21
1.2 Structure of Dissertation . . . . 25
2 Seat Inventory Control 28 2.1 The Seat Inventory Control Problem . . . . 28
2.2 Network Seat Inventory Control . . . . 40
3 Previous Work and Current Practices 47 3.1 Literature Review . . . . . .. . . . . . .. .. .. . 47
3.2 Current Practices in Seat Inventory Control . . . . 61
4 Approaches to Network Seat Inventory Control 67 4.1 Network Formulation and Notation . . . . . .. .. . .. 68
4.2 Use of Network Solutions for Control . . . . 73
4.2.1 Partitioned Approaches . . . . 74
4.2.2 Nested Heuristics . . . . 78
4.2.3 Network Bid Prices . . . . 88
4.3 Aggregated Demand Network Methods . . . . 93
4.4 Leg-Based Methodologies for OD Control . . . 101
4.4.1 Leg-Based Bid Price . . . 102
4.4.2 Combined Leg-Based Bid Price/Booking Limit Approach . . . 109
4.4.3 Virtual Nesting on the "Value Net of Opportunity Cost" . . . 112
4.4.4 Nested Leg-Based Itinerary Limit . . . 118
4.5 Sum m ary . . . 126
5 Modeling the Booking Process Through Simulation 128 5.1 Integrated Optimization/Booking Process Simulation . . . 130
5.2 M odeling Issues . . . 137
6 Analysis and Comparison of Network Seat Inventory Control Approaches 155 6.1 Detailed Analysis and Comparison of Revenue Impacts on Multiple Leg Flights . . . 156
6.1.1 Partitioned Network Methods . . . 163
6.1.2 Nested Network Heuristics . . . 166
6.1.3 Network Bid Prices . . . . . ... . 179
6.1.4 Leg-Based Methodologies for OD Control . . . 197
6.1.5 Summary Comparison of Multiple Flight Leg Revenue Impacts . . . 213
6.2 Comparison of Revenue Impacts on a Hub Network . . . 225
6.3 Summary ... ... 243
7 Conclusion 247
7.1. Summary of Research Findings . . . 247 7.2 Contributions . . . 249
7.3 Future Research Directions . . . 250
Bibliography 254
A Sensitivity Analysis 257
List of Figures
1.1 The Effects of Revenue Management on American Airlines' Profits 1.2 1.3 1.4 1.5 2.1 2.2 2.3 2.4 2.5 2.6 2.7 2.8 2.9 2.10 3.1 3.2
The Effects of Revenue Management on Delta Revenue Management Structural Diagram . . Variation in the "Best" Fare Available . . . .
Computer Reservations System . . . .
Air Lines' Profits .
Revenue Maximization for One Fare Class Revenue Potential for Four Fare Classes Over Allocation of Deeply Discount Seats Under Allocation of Discount Seats . . . .
Advanced Booking Profile . . . . Point-to-Point Network . . . .
Hub-and-Spoke Network . . . . Simple Multi-Leg Example . . . . Nested Fare Class Structure . . . . Partitioned Fare Class Structure . . . . .
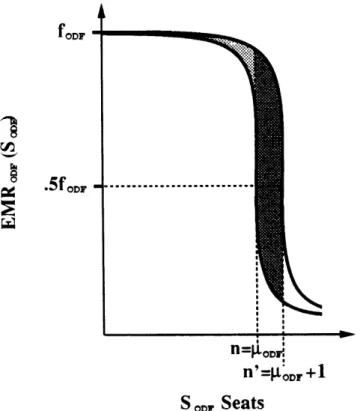
Expected Marginal Revenue Curve of an Individual Slope of an Expected Revenue Function . . . .
Fare Class
4.1 Linear Three Leg Example . . . . 4.2 Estimate of the Probabilistic Shadow Price . . . . 4.3 EMR Curve Based on a Small Standard Deviation . . . . 4.4 Small Hub Network . . . . 4.5 Expected Marginal Revenue Curve for a Flight Leg . . . . 4.6 Virtual Nesting on Fare Value . . . . 4.7 Virtual Nesting on the "Value Net of Opportunity Cost" . . . .. 4.8 Expected Marginal Revenue Curve for Flight Leg A-B . . . . 4.9 Expected Marginal Revenue Curve for Flight Leg B-C . . . . 4.10 Total Expected Marginal Revenue Curve . . . . ...
4.11 Prorated Expected Marginal Revenue Curve for Itinerary BC . . . .
4.12 Total Prorated Expected Marginal Revenue Curve for Itinerary AC . Multiple Leg Network . . . . Small Hub-and-Spoke Network . . . . Time Line of the Booking Process . . . . Integrated Optimization/Booking Process Simulation . . . . Normal Distribution . . . . Gamma Distribution . . . . Truncated Normal Distribution . . . . Poisson Distribution . . . . .... . . . .. .. .. .. .. .. Integrated Multi-Period Booking Profile . . . .
6.1 Multi-Leg Flight 31 . . . .. . . 5.1 5.2 5.3 5.4 5.5 5.6 5.7 5.8 5.9 74 87 89 94 103 113 115 120 121 122 124 125 131 132 133 136 142 143 144 145 150 157 . . . . . . . . . . . . . . . . . . . . . . . . . . . . . . . . . . . . . . . .
6.2 6.3 6.4 6.5 6.6 6.7 6.8 6.9 6.10 6.11 6.12 6.13 6.14 6.15 6.16 6.17 6.18 6.19 6.20 6.21 6.22 6.23 6.24 6.25 6.26 6.27 6.28 6.29 6.30 6.31 6.32 6.33 6.34 6.35 6.36 6.37 6.38 6.39 6.40 6.41 6.42 6.43 6.44 6.45 6.46 6.47 6.48 6.49 6.50 6.51 6.52
A.1 Distributional Assumption Comparison for the NDSP Approach . .5
M ulti-Leg Flight 32.... . . . 158
M ulti-Leg Flight 2[ . . . 159
M ulti-Leg Flight 41 . . . 160
Revenue Comparison between EMSR and OBL . . . 162
Partitioned Network Methods for Flight 21 . . . 163
Partitioned Network Methods for Flight 32 . . . 165
Network Methods Nested by Fare Class for Flight 31 . . . 167
Network Methods Nested by Fares for Flight 31 . . . 168
Network Methods Nested by Shadow Prices for Flight 31 . . . 169
Nested Deterministic Methods for Flight 32 . . . 171
Nested Probabilistic Methods for Flight 32 . . . 172
Network Methods Nested by Shadow Prices for Flight 21 . . . 176
Comparison of Seat Protections for Two Fare Class Example . . . 177
Deterministic Bid Price Approach for Flight 31 . . . 180
Probabilistic Bid Price Approach for Flight 31 . . . 182
Network Bid Price and Nested by Shadow Price Approaches for Flight 21 . 183 Example of a Deterministic Bid Price Versus a Probabilistic Bid Price . . . 185
Network Bid Price Values for Leg B-C of Flight 21 . . . 187
Network Bid Price Values for Leg A-B of Flight 31 . . . 188
Network Bid Price Values for Leg B-C of Flight 31 . . . 189
Network Bid Price Values for Leg C-D of Flight 32 . . . 190
Deterministic Network Revenue Impacts as a Function of Revisions . . . 194
Prorated Leg-Based. Bid Price Approach for Flight 31 . . . 198
Prorated Leg-Based. Bid Price Approach for Flight 32 . . . 199
Network and Leg-Based Bid Price Approaches for Flight 32 . . . 200
Example of a Distinct Versus Nested Bid Price . . . 202
Bid Price Values for Leg A-B of Flight 32 . . . 203
Bid Price Values for Leg B-C of Flight 32 . . . 204
Bid Price Values for Leg C-D of Flight 32 . . . 205
Prorated Leg-Based Bid Price/Booking Limit Approach for Flight 31 . . . . 207
Prorated Virtual Nesting on the "Value Net of Opportunity Cost" Approach for Flight 31 . . . 209
Prorated Nested Leg-Based Itinerary Limit Approach for Flight 31 . . . 210
Prorated Leg-Based OD Control Methodologies for Flight 32 . . . 211
Prorated Leg-Based Methodologies for OD Control on Flight 41 . . . 212
Summary Comparison of the Revenue Impacts for Flight 31 . . . 215
Summary Comparison of the Revenue Impacts for Flight 32 . . . 216
Summary Comparison of the Revenue Impacts for Flight 21 . . . 217
Summary Comparison of the Revenue Impacts for Flight 41 . . . 218
Summary Comparison of the Revenue Impacts for a Two Leg Flight . . . . 221
Two Leg Flight . . . 222
Leg-Based OD Control Methodologies for the Two Leg Flight . . . 223
Network Approaches for the Two Leg Flight . . . 224
Hub-and-Spoke Network . . . 226
Deterministic Network Approaches for the Hub Network . . . 227
Aggregated Network Approaches for the Hub Network . . . 230
Aggregated Nested Deterministic by Shadow Prices Approaches . . . 232
Leg-Based OD Control Approaches for the Hub Network . . . 235
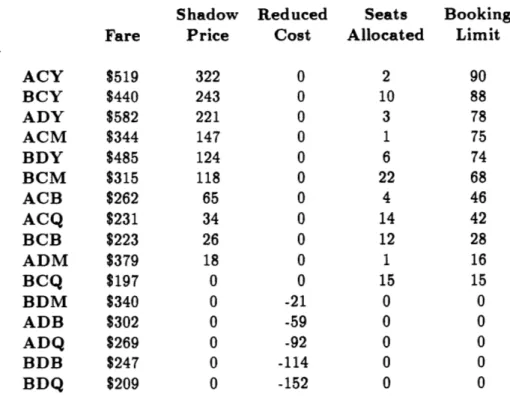
ACY Booking Limit versus Y Class Protection . . . 238
ACM Booking Limit versus M Class Protection . . . 240
Summary Comparison of the Revenue Impacts for the Hub Network . . . . 242
Summary of Revenue Potentials . . . 246
A.2 Distributional Assumption Comparison for the DBID Approach . . . 259
A.3 Distributional Assumption Comparison for the LBID/BL Approach . . . . 260
A.4 Distributional Assumption Comparison for the VNOC Approach ..-. .. . 261
A.5 Distributional Assumption Comparison for the NLBIL Approach . . . 262
A.6 Comparison Between a Poisson, a Normal, and a Gamma Distribution . . 263
A.7 Network Methods Under the Modified Simulation . . . 264
A.8 Network Methods Under the Original Simulation . . . 265
A.9 Leg-Based OD Control Methods Under the Modified Simulation . . . 266
List of Tables
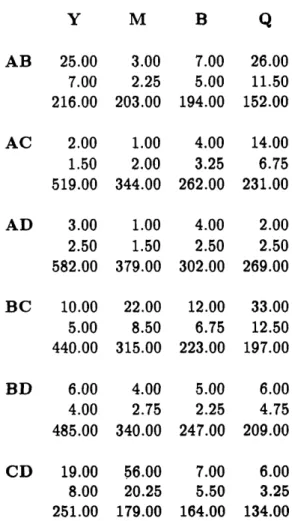
4.1 Linear Three Leg Demand and Fare Data . . . . 75
4.2 Deterministic Network Seat Allocations . . . . 76
4.3 Probabilistic Network Seat Allocations . . . . 77
4.4 Nested Deterministic by Fare Class . . . . 80
4.5 Nested Deterministic by Fares . . . . 82
4.6 Nested Deterministic by Shadow Prices . . . . 85
4.7 Nested Probabilistic by Shadow Prices . . . . 90
4.8 Bid Price Example . . . . 91
4.9 Mean Demand and Fare Data for Small Hub Network . . . . 94
4.10 Aggregated Mean Demand Forecasts . . . . 96
4.11 Demands and Fares for Expanded Hub Network Example . . . . 99
4.12 Aggregated Demand Constraints . . . 100
4.13 Prorated EMR Bid Prices . . . 108
4.14 OD Itinerary Cut-off Values . . . 108
4.15 Prorated Leg-Based Bid Price Booking Status . . . 109
4.16 Prorated Fare Class Booking Limits ... . . . .. . . . . .. . .. .. .. 111
4.17 Combined Prorated Leg-Based Bid Price/Booking Limit Availability . . . . 111
4.18 "Value Net of Opportunity Cost" for Flight Leg B-C . . . 116
4.19 Virtual Nesting Booking Limits . . . 118
5.1 Multiple Leg Network OD's and Their "Paths" . . . 131
5.2 Small Hub-and-Spoke OD's and Their "Paths" . . . 132
5.3 ODF Data for a Two Leg Connecting Network . . . 138
5.4 Mean Bookings from an Independent Simulation of each Flight Leg . . . 139
5.5 Partitioned ODF Booking Limits . . . 152
5.6 Nested ODF Booking Limits . . . 152
6.1 Breakdown of Demand Across Flight 31 . . . 157
6.2 Breakdown of Demand Across Flight 32 . . . 158
6.3 Breakdown of Demand Across Flight 21 . . . 159
6.4 Breakdown of Demand Across Flight 41 . . . 160
6.5 Partitioned Deterministic Booking Limits . . . 173
6.6 Partitioned Probabilistic Booking Limits . . . 174
Glossary
Bid Price: In a network optimization approach, a bid price is the shadow price of a
particular capacity constraint. A bid price represents the marginal value of the last seat on a given flight leg. (Pages 90 and 102)
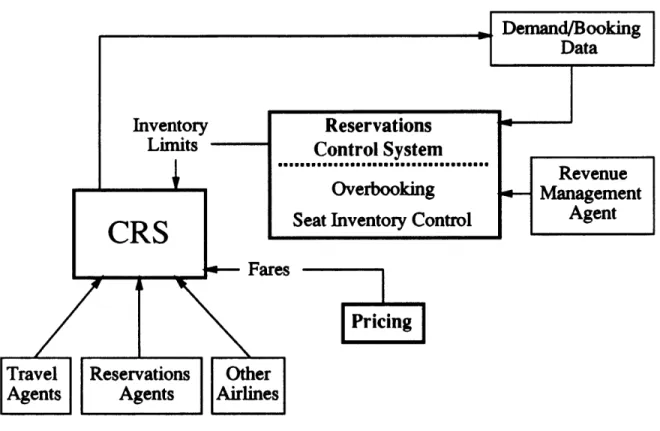
Computer Reservations System (CRS): The CRS is where transactions between an airline and a potential passenger take place. It is the system on which seat availabili-ties for different fare classes and origin-destination itineraries are stored and displayed and all sale and cancellation activity occurs. (Page 22, Figure 1.5)
Demand Factor: The ratio between demand and capacity.
Leg-Based Optimization: The process of maximizing revenue on a single flight leg in-dependent of all other flight legs in a network.
Network-Based Optimization: The process of maximizing revenue by taking into ac-count the traffic flows over a defined network of interrelated flight legs.
Nested Inventory Structure: An inventory structure in which each inventory (whether it be a fare class inventory, a virtual inventory, or an origin-destination and fare class inventory) is nested, allowing for higher revenue, more-desirable requests to have access to seats allocated to lower revenue, less-desirable demand. The philosophy behind a nested inventory structure is to never reject a higher valued passenger when seats originally allocated to lower valued passengers remain available. (Page 43, Figure 2.9)
Network Seat Inventory Control: The process of managing overall network traffic, al-locating seats and limiting sales by origin-destination itinerary as well as fare class. It addresses both the fare class mix and the itinerary control components of seat inventory control and encompasses origin-destination control, segment control, and point-of-sale control. (Page 40)
ODF Itinerary: An origin-destination and fare class routing over a given set of flight legs
(path) at a specified departure time on a given airline.
Origin-Destination Control: The process of allocating seats and determining booking limits for each specific origin-destination and fare class within a network of flights.
(Page 40)
Overbooking: The practice of accepting reservations in excess of capacity in order to minimize empty seats on a flight due to cancellations and no-shows.
Partitioned/Distinct Inventory Structure: An inventory structure in which seats al-located to an inventory bucket are available solely for demand associated with that inventory bucket while any seats not sold go empty. (Page 43, Figure 2.10)
Point-of-Sale Control: The practice of differentiating between the actual location in which a seat is sold in order to take advantage of differences in net revenues due to commission rates, preferred currencies, etc. (Page 41)
Pricing: The process of determining the number and type of fares to be offered in each origin-destination market. (Page 17)
Reduced Cost: The cost to a network of increasing the nonnegativity constraint by one.
A reduced cost is the shadow price of a nonnegativity constraint [1]. (Page 84)
Reservations Control: The process of determining how much of each fare product to sell. It encompasses both overbooking and seat inventory control. (Page 19)
Revenue Management: Commonly known as yield management. The process of deter-mining how many seats to sell at what prices. It is made up of both pricing and reservations control. (Page 15, Figure 1.3)
Seamless Availability/Direct Access: The capability of having requests for a given airline made directly through the reservations system of the airline on a real time basis rather than through the computer reservations systems of other airlines on the basis of predetermined booking limits.
Seat Inventory Control: The practice of allocating seats among various fare levels in an effort to maximize the expected revenue of future scheduled flights. This is done by protecting seats for more desirable, higher revenue passengers while making otherwise empty seats available to less desirable, lower revenue passengers. (Page 19, Chapter 2) Segment Control: The control of different fare class and on-flight itineraries on a mul-tiple leg flight. The origin or destination of passengers outside the given multi-leg flight is not taken into consideration. A differentiation is only made between local and through itineraries on a flight. (Page 41)
Shadow Price: The incremental network revenue that would be realized if a given con-straint was increased by one unit, all else being held constant [1]. (Page 83)
Virtual Inventory Class: A "hidden" inventory class which is used to forecast, optimize, and/or control groups of ODF itineraries on each flight leg. Virtual inventory classes are not formally recognized classes in which service is offered by an airline. Each virtual class exists only within the seat inventory system itself and is not apparent to the users of a computer reservations system. (Page 65)
BL C DBID DD DP
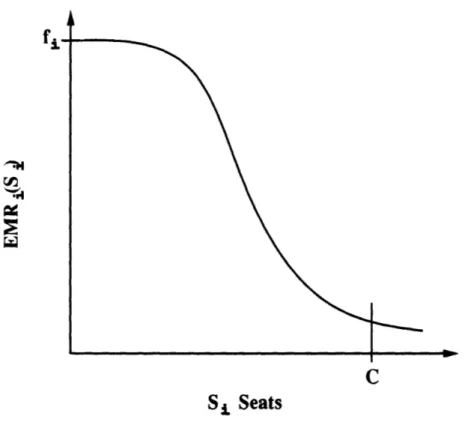
EMR(Si)
EMSR LBID LBID/BL NDF NDFC NDSP NLBIL NPF NPFC NPSP OBL ODF PBIDPi(Si).
UPPER VNOCNotation
Booking Limit.Capacity of a flight leg. Deterministic Bid Price. Distinct Deterministic. Distinct Probabilistic.
The expected marginal revenue of potentially selling the Sith seat which is simply the probability of selling the Sith seat times the revenue obtained from selling the seat, i.e.
fi
-1Pi(Si).Expected Marginal Seat Revenue heuristic developed by Belobaba
[21.
Leg-Based Bid Price.Combined Leg-Based Bid Price/Booking Limit. Nested Deterministic by Fares.
Nested Deterministic by Fare Class. Nested Deterministic by Shadow Prices. Nested Leg-Based Itinerary Limit. Nested Probabilistic by Fares. Nested Probabilistic by Fare Class. Nested Probabilistic by Shadow Prices.
Optimal Booking Limit approach developed by Curry [3]. Origin-destination and fare class.
Probabilistic Bid Price.
The probability of potentially selling Si seats, or the probability of having
Si
or more requests, ri, i.e. Pi~ri > Si).Upper Bound in revenues, or the maximum revenue potential. Virtual Nesting on the "Value Net of Opportunity Cost".
Chapter 1
Introduction
In the airline industry today, it is customary for carriers to offer a wide range of fares for any given seat in the same cabin on the same aircraft. On a nonstop flight from Boston to Orlando in April of 1992, it was possible to find a passenger traveling on a discounted round trip ticket for as low as $278.00, while in the very next seat a passenger could have paid the full coach fare of $1022.00, round trip. Such occurrences have become commonplace since deregulation of the U.S. airline industry.
Prior to deregulation in 1978, the fare structure of the airline industry was relatively simple and static. Airline fares were established collectively, according to an industry average cost, and were determined by a mileage-based structure imposed by the Civil Aeronautics Board (CAB). Carriers that operated at lower than average costs were not permitted to offer lower fares. The CAB also governed each carrier's route structure, permitting only a few carriers to serve an individual market, further limiting competition among carriers.
With the Airline Deregulation Act came the freedom to alter fares at will. The pricing strategies of the entire industry changed dramatically, and airline fares became dynamic and complex. Carriers found rewards in stimulating demand by offering seats, which would otherwise go empty, to passengers at lower fares. By imposing ticketing and travel
restric-13
tions on the low fares, diversion of passengers willing to pay higher fares was limited.
While restrictions on the purchase and use of low fare tickets limited the diversion of high fare passengers, airlines were soon faced with another problem. The seats sold to low fare passengers were not necessarily seats which would otherwise be empty. Besides the restrictions on the low fare tickets, capacity controls, or limits, on the number of available seats were needed. It was important to anticipate the number of seats which would not be filled by high fare passengers on a flight leg. These seats could then be made available for low fare passengers early in the booking process, leaving an adequate number of seats for full fare passengers booking closer to departure.
The complexity of airline fares was further compounded by significant changes in the route structures of carriers throughout the industry after deregulation. Without market entry regulations, new low-cost carriers entered major markets, aggressively offering low fares to capture market share. At the same time, smaller regional carriers, who had been limited to feeder-type route structures by the CAB, expanded into high density markets, offering low fares on their multi-stop and connecting flights to compete with the long haul, nonstop flights of trunk carriers.
In order for established airlines to compete with the lower fares being offered by the regional carriers and new entrants, they decided to offer a limited number of seats at these fares. Thus, by offering seats at low fares, established carriers were able to attract discount passengers and maintain a competitive image. At the same time, however, by limiting the number of low fare seats available, these high cost carriers could still retain their regular passengers and cover direct operating costs on a flight. This made the capacity control problem even more complex. Rather than simply determining the number of seats that would otherwise remain empty, the airlines had to provide seats for a range of different low fare passengers, as well as higher fare passengers.
For airlines to operate profitably in this complex and dynamic pricing environment brought on by deregulation, a totally new capability was developed. This capability has become known as yield management, or more appropriately, revenue management. Revenue management is the process of determining how many seats to sell at what prices and, thus, is comprised of both pricing and reservations control. By defining different fare products through the application of restrictions, and then effectively managing the mix of passengers carried, airlines have the potential to increase their total revenues.
Although cost savings are important in the airline industry, major new cost reductions are limited and not always easily attainable. Costs can be contained through improvements in labor productivity, the fuel efficiency of aircraft, and the maintenance capabilities of equipment. The industry as a whole, however, operates at a very high fixed cost. Labor costs make up 25-40% of an airline's operating costs, and fuel prices comprise 15-20% [4, 5]. While the fixed cost of running an airline is high, the marginal cost of carrying an additional passenger is very low. Therefore, the incremental revenue obtained through proper revenue management leads directly to greater profits.
It has been claimed that revenue management can increase an airline's annual revenues 4-5% per year [6, 7]. With operating revenues of major U.S. carriers in 1990 ranging from $1 to $10 billion [8], 4-5% is quite significant. At the same time, virtually all of the incremental revenue provided by revenue management falls to the bottom line. This additional revenue quite often accounts for most, if not all, of an airline's profits. For example, American Airlines (AA) has estimated that revenue management, i.e. overbooking and seat inventory control, has yielded benefits of approximately $1.4 billion over the last three years. In the same three year period, net profits were $892 million [9]. Shown in Figure 1.1 is AA's actual net income over the period 1986 to 1990 compared with the income level if American's estimated 5% in benefits due to revenue management are not included [10]. Similar effects of a hypothetical increase due to revenue management on profits, when compared to doing
600
500
400
300
200-100
--100 - - -0
-200
o
-300
-400
--
-500--600 - Net Income-- - Net Income Minus 5% Revenues
-700
1986
1987
1988
1989
1990
Year
Figure 1.1: The net income of American Airlines over the period 1986 to 1990 compared to the income level without the 5% increase in operating revenues due to revenue manage-ment [11].
500-
400-300
ca200
0 100 -,-.
-100
-200-Net Income
-300 4- -4 Net income Minus 4% Revenues
A -4.. Net Income Minus 5% Revenues
-400
1
1
1
1
1
1986
1987
1988
1989
1990
Year
Figure 1.2: Delta Air Line's net income from 1986 to 1990 compared to the net income level minus the estimated 4% or 5% increase in operating revenues due to revenue
man-agement [12].
no overbooking or seat inventory control at all, can also be seen for Delta Air Lines in Figure 1.2.
Revenue management involves maximizing total revenues through pricing and reser-vations inventory control (Figure 1.3). Pricing is the process of determining the number and type of fares to be offered in each market, or more precisely, setting the price and corresponding restrictions of the different fare products offered. Not only do fares vary from market to market, but each market is stratified by a number of fare levels, ranging from full fare to deeply discounted fares. Typically, there can be as many as 10 different coach cabin fare levels, or classes, in a single market, each differentiated from the next by a number of fare restrictions. These restrictions exploit known differences in the travel pat-terns of time-sensitive versus price-sensitive travelers, i.e. business versus leisure. Common
Overbooking
Figure 1.3: Structural diagram of revenue management.
restrictions are advance purchase requirements, cancellation penalties, non-refundability, particular day-of-week travel, round trip purchase, and the Saturday night minimum stay requirement.
Although pricing is an important component of revenue management and has a direct impact on revenue, no airline can influence its own revenue through pricing alone. Fares and restrictions are often determined by what other carriers offer in similar markets. However, an individual airline does have complete control over the reservations control component of revenue management. Within a given pricing structure, airlines can manage total revenues on a departure by departure basis through the use of reservations control. Thus, managing the mix of fares, and not the actual fares themselves, is often the most important and effective part of revenue management.
The purpose of reservations control is to determine how much of each fare product to sell. This is done through overbooking and seat inventory control (Figure 1.3). Overbook-ing is the process of acceptOverbook-ing more reservations than the number of seats on an aircraft in order to compensate for losses due to cancellations. Seat inventory control , on the other hand, is the process of determining the right mix of seats available at different fares on a flight leg in order to maximize revenue. By limiting sales to various passengers and preserving seats for higher revenue, more profitable passengers, revenues can be increased. At the same time, offering otherwise empty seats to passengers at discount fares can also increase revenues.
Effects of such control of seat inventories is evident in the difference of the minimum fare available on flights at different times of the day and different days of the week. For example, on a Friday afternoon flight in a business market it is almost impossible to get a deeply discounted fare due to high full fare demand. However, in the same market in the middle of the day on Wednesday when demand is much lower, yet capacity is essentially the same due to scheduling and routing of aircraft, airlines offer a large percentage of the
1200
1100
1000
-900
800
700
cci
600
500
400
300
200
100
0-Mon
Tues
Wed
Thurs
Fri
Sat
Sun
Figure 1.4: The lowest fare available throughout a week in a business market with five flights a day.
seats at discount fares [13]. Figure 1.4 shows an example of the controls placed on fares by an airline by tracing the price of the lowest, or "best", fare available throughout a week in a market with five flights a day
[10].
Pricing and reservations control are both part of the marketing process, along with scheduling. In theory, this three phase marketing process should be considered simultane-ously. However, the size of such a problem is enormous, with each individual component a difficult problem in itself. Therefore, the process is currently dealt with sequentially, with reservations control being the final step of the process. Given a fixed flight schedule and pricing structure, reservations control techniques are used in an effort to fill the seats on each flight departure in the most profitable manner.
1.1
Goal of Dissertation
In 1989, the average domestic load factor for the major U.S. carriers was 62.7%. With almost 4.7 million domestic departures averaging 158 seats per departure [14], there were over 276 million empty seats being flown. At the same time, 10-20% [15] of these flight departures were fully booked and closed to further reservations. By managing seat inven-tories and making decisions to accept, reject, or redirect passenger requests, demand can be better balanced and revenues increased.
While there has been much talk on the subject of revenue management and reservations control throughout the airline industry over the last five years, only a few airlines have actually implemented "sophisticated" systems which use automated mathematical decision making techniques. As a whole, airlines have recognized that there are benefits to be had in using statistical tools and mathematical analysis in controlling reservations, and most airlines today have invested in some sort of revenue management system. However, the typical system is simply a huge database and reporting system which retrieves, summarizes and analyzes historical reservations and traffic data.
While revenue management systems were initially developed to be database manage-ment and decision support tools, the more advanced systems are evolving into automated optimization systems. Such systems use historical reservations data, along with informa-tion on actual bookings, to forecast future demand. These demand estimates are then used as inputs, along with pricing and fare information, in to the reservations control system to determine both booking levels and space allocations. That is, the limit of total bookings
by flight, i.e. overbooking, and the individual booking limits for different fare classes and
itineraries, i.e. seat inventory control.
The reservations control systems today, even the more sophisticated ones, generally break the revenue management issues down into a number of relatively small problems in
which bookings are controlled on the flight leg level. Network impacts on traffic flows, such as through and connecting traffic, are usually not considered. Demand, on the other hand, is origin-destination specific and often different from the particular origin and destination of individual flight legs. With rapid changes in fares, the globalization of route structures, and the increasing role of both large and mini hubs, there is a need for better revenue management and reservations control systems which account for the interaction between flight legs in a network [16].
While the need exists for new and improved reservations control systems which permit network control, there are currently many barriers to effective use of such systems. At the individual airline level, data collection and information quality is not always very good, and demand information, for the most part, is not collected and stored at the itinerary level, a necessity in order to manage network flows. At the same time, the basic architecture of most computer reservations systems used today was designed 20-30 years ago when the market environment of the airline industry was much simpler. An airline's computer reservations system (CRS) is where information on the seat availability for different fare classes and itineraries is stored and displayed. It is where all sale and cancellation activity occurs. The actual tactical and strategic seat availability decisions are made through the reservations control system. The computer reservations system simply takes the fare and inventory limit information from pricing and reservations control and makes it available to the reservations agents, travel agents, and other airlines (Figure 1.5).
Existing computer reservations systems allow for control of seat inventories at the fare class and flight leg level, rather than by origin-destination. The number of fare classes available through the computer reservations systems is also limited, not allowing all airlines to control bookings as effectively as they would like. The primary obstacle for reservations control is the dependence of all airlines on computer reservations systems and sales outlets for ticket distribution. No airline is able to completely control its own sales. Therefore
Inventory
Limits
Fares
Figure 1.5: Relationship between the computer reservations system (CRS) and pricing and reservations control.
Reservations
Control System
Overbooking
Seat Inventory Control
the methods and techniques employed by individual airlines in controlling inventories is not only determined by the capabilities of a carrier's own reservations systems, but by the computer reservations systems of other airlines as well.
These constraints are slowly disappearing. Computing power and data storage capabil-ities are expanding and becoming less expensive, allowing airlines to collect more detailed and accurate data. Improvements are also being made in the sophistication of optimization methodologies and algorithms. With continuing analytical and technical progress, it will be possible to approach the airline reservations control problem in ways that would have been completely infeasible a few years ago. Most important are the changes and advances which will be made to the computer reservations systems and the eventual introduction of "seamless availability", or direct access. Instead of being constrained by the character-istics and capabilities of other airlines' computer reservations systems, under the concept of seamless availability, requests will be made directly to individual airlines on a real time basis, allowing the airlines to evaluate each request within their own reservations control system.
The objective of this dissertation is to address the problem of reservations control at the network level. The major issues associated with network reservations control are: the availability of data at the itinerary fare class level, demand forecasting at this level, an airline's own system for controlling inventories, the mathematical optimization tools necessary for controlling seats at the network level, and the computer reservations systems. The focus of this research is on the optimization of seat inventories. Different approaches will be introduced and examined, considering a variety of optimization algorithms, as well as control methodologies, i.e. the actual application of the outputs of mathematical models to limit bookings. Together, the combinations of optimization and control techniques will be compared and evaluated on the basis of how they influence an airline's ability to increase revenue through network control.
Once an optimization and control strategy at the network level has been determined, the other issues of reservations control must also be addressed. While the problem of forecasting demand at the itinerary and fare class level has not been solved as of yet, the collection and storage of network demand data is currently possible with a large amount of resources dedicated to the process. By simply investing enough money, an airline can update its own reservations control system, inventory structure, and computer reservations system. Finally, with seamless availability, the computer reservations interdependence problem can be solved.
The intent of this dissertation is to present a comparison of reservations control tech-niques. A number of factors, such as cancellations, no-shows, the potential for the upgrad-ing of passengers to a higher fare class then originally requested, and the recapture rates of rejected demand on other flights, are not considered in order to isolate the effects of discount and itinerary controls. For further simplification, misconnects (passengers who miss a flight leg out of a hub due to a late or canceled inbound flight) and standbys are also ignored. Such factors must be considered when developing a new reservations control system, but by not including them in this analysis it will be possible to identify more clearly the differences between the actual optimization and control techniques themselves. Although ignoring these factors is restrictive, a solution to the simplified problem can lead to improved sub-optimal approaches for the more realistic problem. By first reducing the complexity of the problem, it may be possible to determine basic insights into the nature of a good solution. Other factors can then be addressed and incorporated.
1.2
Structure of Dissertation
The remainder of this dissertation is divided into six chapters. Chapter Two serves as a formal introduction into seat inventory control, pointing out the specifics of airline operations and practices which contributed to shaping the seat inventory control problem.
The second section of the chapter defines the concept of network seat inventory control and introduces the reservations control functions which it encompasses. The characteristics and complexities of the problem are then defined and discussed, identifying practical issues and constraints which must be considered when solving the problem.
Chapter Three is an overview of previous work, summarizing the two basic approaches taken thus far when addressing the seat inventory control problem, approaches using marginal seat revenues and those using mathematical programming. After reviewing the literature, some of the current practices and approaches used by the airlines to control seat inventories will be described, showing the range of sophistication used in reservations control systems throughout the industry and the need for better and more effective seat inventory control approaches.
With the objective of this dissertation being to develop practical optimization and con-trol methodologies for airline network seat inventory concon-trol, Chapter Four begins by in-troducing basic notation and reviewing the traditional network formulation of the problem. Using the solutions obtained from these mathematical optimizations, practical approaches to controlling seat inventories are discussed. In an effort to avoid problems associated with forecasting at the fully disaggregated origin-destination and fare class level, network methods which use aggregated demand estimates are then presented. Finally, focusing on optimization and control at the flight leg level, simpler leg-based heuristics are described, which incorporate information about the interaction between flights on a network and distinguish between different passenger itineraries.
One of the major interests in the development of new seat inventory control method-ologies is the potential for increased revenues. An effective way of estimating the expected revenue generated from different methodologies is through simulation. In Chapter Five, a dynamic and integrated optimization/booking process simulation is described which was designed and implemented to compare revenue impacts from different seat inventory control
approaches. Specific issues involved in realistically modeling and simulating the booking process of an airline are then detailed.
Chapter Six presents an analysis and comparison of simulation results. The revenue impacts due to different optimization strategies and control methodologies are evaluated using real airline data from both a connecting hub network and multiple flight leg networks. Different factors, such as protection levels and seat allocations, are examined, and the robustness of the seat inventory control methodologies is investigated through variations in the forecasting accuracy, frequency of revisions, and demand distribution assumptions. The overall performance of different approaches are examined by comparing the revenue obtained with that of a common leg-based seat inventory control methodology, as well as the maximum revenue possible if decisions were made based on perfect information.
Chapter Seven concludes this dissertation, summarizing the research findings and con-tributions of this work. Discussion will focus on practical issues associated with the im-plementation of different seat inventory control methodologies. Finally, future research directions stemming from the work presented in this dissertation are outlined.
Chapter 2
Seat Inventory Control
2.1
The Seat Inventory Control Problem
The primary component of reservations control is seat inventory control (Figure 1.3). Traditionally, airline seat inventory control has been the practice of allocating seats to different fare classes in an effort to maximize the expected revenue of future scheduled flights. This is done by protecting seats for higher fare passengers, while at the same time making empty seats available to lower fare passengers. By offering seats at discounted fares, an airline can capture extra passengers who otherwise would not travel, in turn providing additional revenue. Too many seats at lower fares could cause a diversion of potential high fare passengers to available lower fares and may displace some higher fare passengers altogether, lowering total revenues.
The concept of controlling seat inventories by fare category started when airlines found that total revenues could be increased through the practice of differential pricing, i.e. charging different customers different prices for a product. Economically, if only one price, or fare, is offered in a market, that fare would be determined in an attempt to maximize revenue. Therefore, under a simplified demand curve, such as that in Figure 2.1, a trade-off would be made between the demand, i.e. the number of passengers, and the fare until revenues were maximized. In this case, 50 seats would be sold at a fare of $250 for a
$500
$250
..---Average Cost Curve
Demand Curve
50 62 100
Seats
Figure 2.1: Given the assumed demand curve, revenues are maximized for a single fare structure by setting the fare at $250, selling 50 seats, and generating $12,500. However, based on the average total cost curve given for the flight, it would be necessary to sell 62
seats at $250 in order to cover total operating costs.
$500-$400
a Revenue
$300
$200 -.---.
Average Cost Curves
$100
Demand Curve
20
40
60
80
100
Seats
Figure 2.2: By using a differential pricing strategy with four fare levels, total revenues are increased to $20,000 from 80 passengers (20 x $400 + 20 x $300 + 20 x $200 + 20 x $100) and costs are easily covered.
maximum revenue of $12,500.
In practice, there is often not a single fare level at which the revenues generated will cover total operating costs. Figure 2.1 shows an example of an average total cost curve which may be associated with a given flight departure. The closest the demand curve comes to the cost curve is at a fare of $250, where the total cost is $15,500. This would require a demand of 62 passengers, instead of the 50 passengers obtained at a single fare of $250. Under the same demand assumption, if an airline offered seats at four different fare levels, $400, $300, $200, and $100, the airline could attract 80 passengers and generate $20,000 in revenue, as shown in Figure 2.2, assuming diversion of demand willing to pay higher fares does not exist. In this case, not only are revenues increased, but the total cost of carrying 80 passengers is easily covered by this differential pricing strategy. Thus,
through a multiple fare structure, airlines are able to refine their pricing so as to cover total costs and maximize revenue.
Although airlines are practicing a form of price discrimination, they are not directly discriminating in price between different passengers for the same product. The differential in price offered by airlines is usually based on differences in "fare products", each of which is uniquely defined by restrictions on their purchase and use for air travel. By recognizing the differences in price elasticities among customers, airlines have been able to segregate market demand into several different product groups. For example, discount fare passengers, who want the lowest fare possible, must be willing to make travel plans in advance, be flexible enough to shift their travel to certain days of the week and times of the day, stay over Saturday night, and are not allowed to change or cancel their travel without penalty. On the other hand, full fare passengers can make last minute plans at peak times, have no restrictions as to when and where they travel, and can change or cancel their plans at any time for no charge. Thus, these restrictions differentiate the quality of service that passengers are buying and justify, to some degree, a difference in price.
In order to obtain the benefits of price discrimination, the relative fare levels and respective restrictions offered in each market must be managed effectively. In addition, the number of seats offered at each fare must then be fine-tuned to capture the most profitable mix from the available passenger demand. For example, looking again at the simple demand assumption used above, if twice as many deeply discounted seats are offered, i.e. 40 seats at $100, with 20 seats still offered at $200, 20 seats at $300, and 20 seats at $400, diversion of demand willing to pay higher fares would result and revenues would only total $14,000, no longer covering the costs of $16,000, (Figure 2.3). On the other hand, if discount seats are limited excessively, the resulting revenue would again be inadequate to cover costs. In Figure 2.4, only $14,000 is realized in revenues when 10 seats, instead of 20, are made available at each of the three discount fares, amounting in a total demand of 50 passengers,
$500 $400 -.- --- , 7 Revenue a- $300 $200
-.---:Demand Curve
$100 20 40 60 80 100Seats
Figure 2.3: By overallocating the deeply discounted seats and allowing as many as 40 seats to be booked at $100, diversion of higher fare demand results. Seats are sold at the $300, $200 and $100 fare levels, rather than at the $400, $300, and $200 fare levels, resulting in significantly lower total revenue.
$500
$400
7 Revenue
2
$300
----$200
--.
Demand Curve
$100
'
--20
40
60
80
100
Seats
Figure 2.4: By under allocating the number of seats to each of the discount fares and allowing only 10 passengers to book seats at the $300, $200, and $100 fare levels, revenues again drop, costs are not covered, and seats go empty.
while total cost is $15,500 [17].
A seat on any particular flight departure is an extremely perishable commodity. Once
the doors close on a plane, the value of any unsold seats is lost forever. With nearly 40% of the airline industry's product perishing, selling a seat to an additional passenger for any price above the marginal cost is advantageous (assuming no diversion from other fares), and the marginal cost of carrying the additional passenger in an otherwise empty seat is very low. Thus, as long as the lowest fares are greater than the marginal cost of carrying the extra passengers, these passengers will be contributing to the fixed costs of operating the flight and to profits. Not only do airlines benefit from carrying low fare passengers, but high fare passengers may benefit as well. With the extra revenue from the additional low fare passengers, airlines may actually be able to reduce the cost of a full fare ticket. Even
if this is does not occur, the extra revenue can at least be used towards improvements in service, frequency and equipment, which benefits full fare passengers and their desire for last minute seat availability.
Adjustments to seat inventory allocations can both increase load factors, by filling otherwise empty seats, and increase net yields, by better allocating capacity to higher fare traffic. It can also give an airline the opportunity to participate in competitive discount fare initiatives in order to maintain market presence. The challenge behind seat inventory control is to maximize revenue by best deciding how and when to make trade-offs between the cost of an empty seat, and the loss of a discount fare, and the cost of turning away a full fare passenger, resulting in a loss of revenue equal to the difference between the full and discount fares.
The need for seat inventory control stems from the basic problem that airline supply does not equal demand. In air transportation, supply and demand seldom match exactly. On the one hand, demand for future flights is probabilistic and cannot be forecasted pre-cisely. However, the problem results, to a greater extent, from the actual scheduling of aircraft. Because of the route structure of an airline, the relatively fixed number and size of aircraft, scheduling constraints, and the lack of balance in passenger demands over a network, it is not always possible to schedule exactly the right aircraft for each departure. Therefore, when there is either excess demand or excess capacity, a closer match between supply and demand can be achieved through the use of seat inventory control techniques. The greater the problem of matching the supply of aircraft seats to the demand of different routes, the greater the benefits of effective seat inventory control.
The major difficulty of the seat inventory control problem is the fact that the reser-vations for discounted fares by leisure travelers have a tendency of being made before full fare, business oriented demand materializes. This occurs both because of the nature of the customers for the respective fares and the early booking restrictions placed on the discount
75 . . . , Deeply Discounted
50-U) 4) 25 -Discounted-Full Fare 00
60
50
40
30
20
10
0
Days Prior to Departure
Figure 2.5: The build up of bookings differs with the type of fare being purchased. Deeply discounted tickets are purchased early in the booking process, while full fare demand ma-terializes in the last few days before departure.
fares. If high fare passengers booked before lower fare passengers, the seat inventory control problem would be trivial. Airlines would simply fill seats with the highest fare passengers as they came in until there was no further demand or aircraft capacity was reached. This is not the case, however. Figure 2.5 gives an example of a booking profile, showing actual bookings by groups of fare classes versus the number of days prior to departure. The build up of bookings over time differs with the type of fare being purchased. Thus, seat inven-tory control is, in essence, the practice of trying to save
just
the right amount of seats for late-booking, high revenue passengers.The seat inventory control problem can be approached from a variety of perspectives. Seat inventories can be controlled over individual flight legs, over the entire network of a carrier, or over separate subsets of the network. Most airline reservations systems currently
Figure 2.6: Point-to-Point network where each distinct origin and destination is served by a non-stop flight leg.
maintain seats inventories and manage seat availability by fare class. Using such methods, efforts are made to maximize revenue on each individual flight leg. Therefore, reservations for travel on a flight leg are accepted based on the availability of a particular fare class on that flight leg. A passenger's ultimate destination, overall itinerary, or total revenue contribution to the airline is not taken into account.
If the route structure of an airline served each distinct origin and destination market with isolated, non-stop, point-to-point flights, as in Figure 2.6, a flight leg approach to seat inventory control would be all that was necessary. However, the typical major airline route structure is a complex network built around one or more connecting hubs, as shown in Figure 2.7. Instead of aircraft flying between each individual city pair the airline serves, flights from a number of cities converge at one time at a hub, exchange connecting
passen-Figure 2.7: Hub-and-Spoke network where each individual market is served by way of a connection through the hub.
Figure 2.8: A simple multi-leg example with three possible itineraries and one fare class. AB: $100, AC: $150, and BC: $100.
gers, and then depart to a number of other cities. Using such a route structure, an airline can efficiently provide service to many different markets, while minimizing the resources needed to do so.
In a connecting hub environment, maximizing flight leg revenues is not necessarily the same as maximizing total network revenues. This can be illustrated with the following simplified example. Consider a one stop flight from city A to city B to city C. In this example there are two flight legs, A-B and B-C, and there are three possible itineraries, AB, BC, and AC. For a given fare class, the fares for the two short haul itineraries, AB and BC, are each $100. For the long haul AC itinerary, the fare is $150, (Figure 2.8). Under a leg-based inventory structure, a seat on the flight leg A-B could be reserved by either an AB passenger or an AC passenger. Thus, it is possible for flight leg A-B to be filled entirely by AB passengers at $100 each, denying any seats to the higher revenue AC passengers. If demand for local travel from city B to city C is low, seats could go unsold on the B-C flight leg, and a reduced total revenue for the two flight legs combined would result.
In the same example, it could also be possible for all the seats on the A-B flight leg to be booked by AC passengers at the higher revenue of $150. However, if short haul demand is high for both the A-B flight leg and the B-C flight leg, total revenues would have been increased by selling the seats on the A-B flight leg to AB passengers. With high local demand on the B-C flight leg, total revenue for a seat from city A to city B and from