Publisher’s version / Version de l'éditeur:
Vous avez des questions? Nous pouvons vous aider. Pour communiquer directement avec un auteur, consultez la première page de la revue dans laquelle son article a été publié afin de trouver ses coordonnées. Si vous Questions? Contact the NRC Publications Archive team at
[email protected]. If you wish to email the authors directly, please see the first page of the publication for their contact information.
https://publications-cnrc.canada.ca/fra/droits
L’accès à ce site Web et l’utilisation de son contenu sont assujettis aux conditions présentées dans le site LISEZ CES CONDITIONS ATTENTIVEMENT AVANT D’UTILISER CE SITE WEB.
New Horizons in Green Civil Engineering (NHICE-02), 2020-08-26
READ THESE TERMS AND CONDITIONS CAREFULLY BEFORE USING THIS WEBSITE. https://nrc-publications.canada.ca/eng/copyright
NRC Publications Archive Record / Notice des Archives des publications du CNRC :
https://nrc-publications.canada.ca/eng/view/object/?id=0d09936b-a849-4937-9f6c-eaf6a09142ea
https://publications-cnrc.canada.ca/fra/voir/objet/?id=0d09936b-a849-4937-9f6c-eaf6a09142ea
Archives des publications du CNRC
This publication could be one of several versions: author’s original, accepted manuscript or the publisher’s version. / La version de cette publication peut être l’une des suivantes : la version prépublication de l’auteur, la version acceptée du manuscrit ou la version de l’éditeur.
Access and use of this website and the material on it are subject to the Terms and Conditions set forth at
Development of assessment criteria for overheating risk analysis in
buildings
Development of assessment criteria for overheating risk analysis in buildings
A. Laouadi
*, M. Bartko, M.A. Lacasse
Construction Research Centre, National Research Council Canada 1200 Montréal Road, Ottawa, ON K1A 0R6
* Corresponding author: Tel (613) 990 6868, email: [email protected] Abstract:
Overheating in buildings arising from global warming and extreme heat events (EHEs) is a growing health concern in urban areas of many countries. Overheating is the condition of the indoor environment that results in thermal discomfort or heat-related health stress to building occupants. Overheating is found in naturally ventilated buildings, buildings with limited cooling capacity or intermittent use of air conditioning, and buildings that experience extended periods of power outages or HVAC failure. Despite the extensive studies on this topic, there is a lack of a standard approach to analyse the overheating risk. This paper develops a framework to analyse the risk of overheating in buildings from the perspective of comfort and health of occupants through the use of building simulation. The framework includes four steps: (1) Generation of reference climate data for the historical period and future projections to extract various types of EHEs; (2) Development of heat stress metric to quantity the effect of heat on the comfort and health of occupants; (3) Generation of reference summer weather years for building simulation; and (4) Development of assessment criteria for overheating risk.
Keywords:
Extreme Heat Events, Overheating, assessment criterion, buildings, climate change. 1. Introduction
Overheating in buildings arising from climate change and extreme heat events (EHEs) is a growing health concern in many countries [1-4]. Overheating is the condition of the indoor environment that results in thermal discomfort or heat-related health stress to building occupants. Overheating is found in naturally ventilated buildings, buildings with limited cooling capacity or intermittent use of air conditioning, and buildings that experience extended periods of power outages or HVAC failure. In those buildings, the indoor conditions are consequences of the outdoor conditions, but they may be altered by building constructions and occupant behavior (e.g. opening windows). Continuous exposure to high temperatures over several days strains the human physiological system and may lead to health issues (such as heat cramps, exhaustion, and stroke) or death, particularly for vulnerable people such as the elderly, the sick and children. Indeed, epidemiological studies have found that the excess mortality data during EHEs are higher than any other natural hazard such as floods and storms [3,5,6]. To reduce the risk of overheating, buildings should be designed and operated to be resilient under such extreme climatic conditions. Current design and retrofit of buildings use reference (average or typical) weather years to conduct whole building energy simulations. These reference years may not, however, be suitable to assess the risk of overheating and therefore new reference summer weather years (RSWY), selected from multi-year climate data with various types of EHEs, need to be developed. Development of such reference years requires the use of proper metrics to rank and select representative years having periods of EHEs. Furthermore, the metrics should take into account not only the climate variables, but also the human subjects
that are exposed to such EHEs to permit the evaluation of their thermal comfort and heat-related health stress. The Chartered Institution for Building Services Engineers (CIBSE) developed the Design Summer Year (DSY) as the third hottest summer within a 21 year climate data set based on the daily average dry bulb temperature from April to September [7]. Due to the limitations of DSY in predicting known local EHEs, CIBSE [8] has later adopted three types of probabilistic design summer years (moderately warm: pDSY-1, intense: pDSY-2, long and intense: pDSY-3) developed by Eames [4] based on the Weighted Cooling Degree Hours method and the adaptive thermal comfort threshold temperature. Liu et al. [9] used the heat stress metric of the physiological equivalent temperature (PET) to develop probabilistic hot summer years (pHSY) as alternatives to pDSY. As for overheating definition and assessment, there is no universal or agreed-upon methodology [10]. The current definitions are mostly based on the threshold temperatures of the static or adaptive thermal comfort for healthy people [11, 12]. Vulnerable people who would suffer the most from excessive heat are therefore not explicitly addressed.
The goal of this paper is to develop a framework to analyze overheating risk in buildings through the use of building simulation. The specific objectives include the development of: (1) reference summer weather data years; (2) a physiological metric to quantify the effect of heat on thermal comfort and health of human subjects, and to discern outdoor and indoor heat events; and (3) criteria to assess overheating risk. 2. Approach
The proposed framework consists of the following four steps:
1. Generation of reference climate data for the historical period and future projections to extract various types of EHEs;
2. Development of a heat stress metric to evaluate the effect of heat on thermal comfort and health of human subjects;
3. Generation of reference summer weather years (RSWY) to be used for building simulation in selected Canadian cities; and
4. Development of assessment criteria for overheating risk.
3. Reference climate data
Climate data are needed to conduct building simulation. The reference climate data for the historical period and future climate projections (seven scenarios) were collected from the climatic databases of Environment and Climate Change Canada [13]. A methodology was developed to bias-correct the weather variables and produce hourly weather files for selected 11 Canadian cities. More details may be found in Gaur et al. [14]. For the historical period, the most recent data were collected for the period 1986-2016. For each city domain, the weather data were obtained from the associated weather stations and then averaged to produce a single weather file for the selected city. Any missing observational data were filled-in using bias-corrected data from the Climate Forecast System Reanalysis (CFSR) database [15]. For the future climate projections, the simulated climatic database using the CanRCM4 Large Ensemble model with regional corrections were used to extract climatic projections for each city spanning the period 1950 – 2100. The simulated climate data for the historical period 1950-2016 was used to derive bias correction factors for the future years. A set of 15 (parametrizing various cloud physics) simulations comprising of bias-corrected hourly weather data were produced for each city and each future climate change scenario.
4. Metric for heat events
Heat events are time and location dependent. People exposed to such events will undergo heat stresses resulting in thermal discomfort (e.g., sweating) and potential health issues (i.e., dehydration, heat cramps, etc.). Such heat events may also be fatal, particularly for vulnerable people such as the elderly, the sick and children. There exist many heat stress indices for healthy young adults with various degrees of complexity and limitations [16]. A list of suitable indices was compiled from literature and compared against some screening criteria. More details may be found in Laouadi et al. [17]. The standard effective temperature (SET) was selected for this purpose. SET is defined as the temperature of an imaginary indoor environment at 50% relative humidity and mean radiant temperature (MRT) equal to the air temperature, in which an imaginary subject wearing clothing standardized for the activity level has the same heat stress and strain as in the actual environment [18]. SET is calculated using the transient two-node bioheat model of Gagge et al. [19]. The SET bioheat model was modified to suite the transient nature of heat events and subject activities
during day and night times. These modifications included fine tuning of some input parameters, accounting for the solar radiation in the MRT definition, incorporation of thermoregulatory controls of a sleeping person, and incorporation of the time limit of exposure algorithms of ISO [19].
The SET index was used to define instantaneous heat events. A heat event is declared when the instantaneous SET value exceeds a threshold value (SETc). Threshold values are established for outdoor
and indoor exposures during daytime when subjects are active and nighttime when subjects are sleeping. Similarly, thresholds for vulnerable subjects may be defined. In this paper, a threshold value corresponding to the initiation of sweating (or slightly warm sensation) of SETc = 30°C is chosen for r indoor exposure during
daytime and SETc =26°C for sleeping subjects during
nighttime. For vulnerable subjects, the threshold SETc
was fixed to 26°C for both day and night time exposures. For outdoor exposure, the thresholds of SET are provided in [22]. For acclimatized subjects, 1.2°C is added to the threshold value. Outdoor heat waves are declared when the cumulative SETH quantity is non zero over at least one or more consecutive days. SETH (°C*hour) is expressed as:
∑
∑
∙
1
Where t (hours) is the exposure time. The time is counted from the sleeping time to the sleeping time of the following day to account for the effect of sleep disturbance on the physiological response of subjects during daytime exposure. Heat waves are characterized by three features: Duration (number of consecutive days with SETH > SETHmin = 4), severity
(SETH) and intensity (severity/duration/24; in °C). 5. Generation of RSWY
RSWYs are extracted from a 31 year period of climate data (historic or future) to capture all types of heat waves [22]. The summer period was fixed from May to September for Canadian locations (it may be different for other international locations). The methodology to develop such weather data includes the following steps:
1. Heat waves for each year of the 31 period are identified and sorted by maximum duration, intensity, and severity. The maximum values are assigned to each year.
2. The return period of heat waves is fixed to 15.5 years, which corresponds to the second extreme year out 31 years.
3. The cumulative frequency distribution of the maximum values of duration, intensity and severity are plotted and fitted with suitable distribution functions. The extreme years are then chosen, if their calculated return periods are close to the fixed value of 15.5 years. In most cases, the extreme years are those ranked second by their heat wave maximum values for duration, intensity or severity. If the first ranked years have the same frequency values or are very close, the year with
the highest severity value is chosen to represent the second extreme year as the first extreme year is not known in this case. Similarly, if the second ranked extreme years have the same frequency values, the one with the highest severity value is chosen.
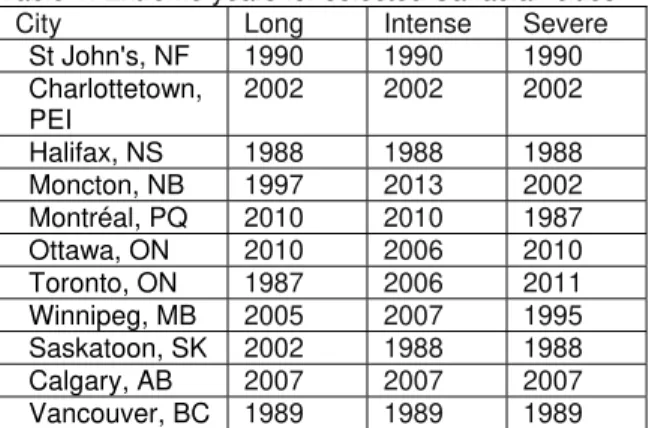
Three types of RSWY (with long, intense and severe heat waves) are thus established to assess the overheating risk in indoor spaces using building simulation. Table 1 lists the extreme years for selected Canadian cities as obtained by the proposed method. Table 1. Extreme years for selected Canadian cities
City Long Intense Severe
St John's, NF 1990 1990 1990 Charlottetown, PEI 2002 2002 2002 Halifax, NS 1988 1988 1988 Moncton, NB 1997 2013 2002 Montréal, PQ 2010 2010 1987 Ottawa, ON 2010 2006 2010 Toronto, ON 1987 2006 2011 Winnipeg, MB 2005 2007 1995 Saskatoon, SK 2002 1988 1988 Calgary, AB 2007 2007 2007 Vancouver, BC 1989 1989 1989
Figures 1 and 2 compare the hourly SET values during the heat wave periods as obtained by the proposed NRC and CIBSE methods for outdoor and indoor exposures in Ottawa (Ontario), respectively. The CIBSE method [8] uses temperature and the Weighted Cooling Degree Hours (WCDH) method, which is a quadratic sum of the operative temperature deviation from the upper temperature of the adaptive thermal comfort. The proposed method yields the extreme year with long heat waves of 2010 (July 5 to 11), and CIBSE method yields the year of 2012 (Jul. 11 to 17). The indoor SET were calculated for an archetype single detached house without air conditioning. Typical old (1980) constructions and air leakage data were assigned to the house model. Windows are double glazed, distributed over the four facades of the house and equipped with internal Venetian blinds which remain open (slats are horizontal) during the summer period. The house is made of four thermal zones: basement, first floor, second floor (bedrooms) and attic space. The SET values in equation (1) were assigned those calculated for the first floor during daytime (7:00 AM to 22:00 PM) and the second floor for nighttime. In terms of SET, the proposed method yields extreme years that are more extreme than the CIBSE method. In terms of temperature (not shown here), the CIBSE method may yield comparable or higher maximum daytime temperatures, but lower nighttime temperatures than the proposed method. The CIBSE method may therefore lead to the under-estimation of the heat-related health effects, particularly in warm/hot and humid areas.
Figure 1. Comparing the outdoor SET of extreme years with long heat waves as obtained by NRC and CIBSE methods for Ottawa
Figure 2. Comparing the indoor SET of extreme years with long heat waves as obtained by NRC and CIBSE methods for Ottawa
6. Assessment criterion for overheating
An indoor overheating event is similar to outdoor heat events, and is thus defined as it relates to the subject under its exposure but not to the fixed space domain which may be unoccupied over certain time periods (e.g., bedrooms are occupied at nighttime versus living rooms occupied during daytime; office or school spaces are occupied only during working hours; patient rooms are occupied 24 hours; etc.). Equation (1) is therefore used as a metric to assess the severity of overheating. The instantaneous value of SET in equation (1) takes on the values calculated for the occupied spaces only during daytime or nighttime with respective SET thresholds. In a typical warm or hot year, there may be more than one heat wave occurring in the summer period, and as a result more overheating events with different severities may occur indoors. To declare that a space is overheated, the severity metric SETH (equation 1) for any overheating event during the summer period should exceed a threshold value (SETHc). This threshold value is calculated based on
the total water loss by sweating (dehydration) of subjects exposed to the overheating events.
15 20 25 30 35 40 0 24 48 72 96 120 144 168 SET ( C) Time (hr.) NRC‐Long: 2010 CIBSE‐Long: 2012 20 25 30 35 40 0 24 48 72 96 120 144 168 SET( C) Time (hr.) NRC‐Long:2010 CIBSE‐Long:2012
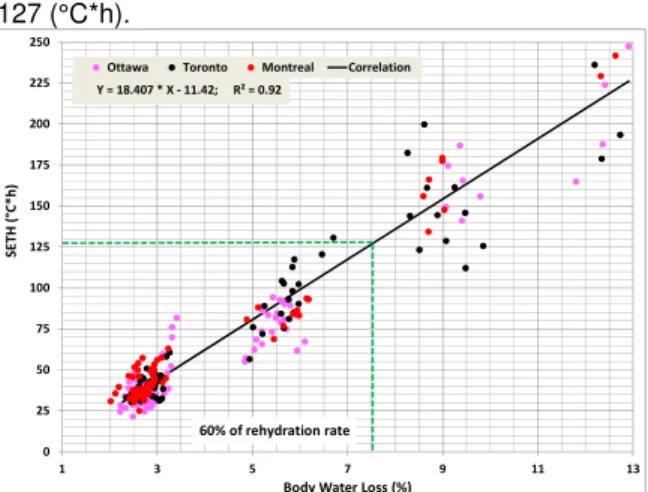
Dehydration was the leading cause of mortality followed by heatstroke during the 2003 heat wave in France [21]. ISO [20] recommends the maximum allowable dehydration rate of 3% of body weight for healthy people, and indicates that higher dehydration rates are associated with increased heart rates and reduced sensitivity to sweating due to reduced plasma volume of blood. However, for the vulnerable subjects, the maximum dehydration rate should be lower due to age-related changes in their physiology (kidney function, thirst perception, lower body water content. The dehydration rate may be relaxed if subjects rehydrate themselves. The proposed method assumes the rehydration rate of 60% of ISO [20]. The overheating is calculated for the three types of extreme summer years.
Figure 3 shows the severity of overheating (SETH) versus the body water loss for healthy adult subjects under indoor exposure in residential buildings. Based on the body water loss criteria as mentioned before, overheating is declared when the SETH is greater than 127 (°C*h).
Figure 3. Severity of overheating versus body water loss for healthy subjects
7. Conclusions and outlook
A framework was developed to analyse the risk of overheating in buildings from the perspective of comfort and health of occupants. The framework included four steps: (1) generation of reference climate data to extract various types of extreme heat events at given locations; (2) development of a heat stress metric to evaluate the effect of heat on the comfort and health of human subjects; (3) generation RSWY for 11 Canadian cities; and (4) development of assessment criteria for overheating risk.
The reference historical climate data and future projections were taken from the most recent climate databases from ECCC [13]. The climate data were bias-corrected to produce hourly weather files for 11 Canadian cities.
The SET bioheat model was selected and modified to account for the transient nature of heat events and daily activity levels of subjects, and the physiological response of sleeping person. The transient SET index was used to assess outdoor or indoor heat events based on a set of threshold values for active and
sleeping subjects. The severity index (SETH) which is the product of the SET deviation from the threshold value and the exposure time of heat events was used to generate RSWY in 11 Canadian cities. The overheating risk is declared when the SETH exceeds a threshold value of 127 (°C*h), which limits the critical dehydration of subjects during the heat wave periods. Acknowledgements
This work was carried out by the National Research Council of Canada with funding from Infrastructure Canada in support of the Pan Canadian Framework on Clean Growth and Climate Change. The authors are very thankful for the support.
References
[1] CIBSE. 2005. TM36-2005. London, UK. [2] HC. 2011. Extreme Heat Events Guidelines.
Health Canada, Ottawa.
[3] Saman et al. 2013. National Climate Change Adaptation Research Facility, Gold Coast. PP. 242.
[4] Eames, M.E. 2016. Building Services
Engineering Research and Technology. 37: 503-522.
[5] Kenny et al. 2018. Temperature. 1‑26. [6] Berko et al. 2014. Natl Health Stat Report.
(76):1-15.
[7] Levermore, G.J., Parkinson, J.B., 2006. Building Services Engineering Research and Technology, 27(4), pp.311–325
[8] CIBSE. 2014. TM49-2014: Design Summer Years for London. London, UK.
[9] Liu et al. 2016. Build. and Env. 105: 56-68. [10] Anderson et al. 2013. Perspectives in Public
Health; 133(3):158‑164.
[11] CIBSE. 2015. Guide A. London, UK.
[12] Mohamed H. M.H., Hensen J.L.M. Proc. Build. Sim. 7-9 Dec. 2015, Hyderabad, India (pp. 1-8). [13] ECCC. 2018. Environment and Climate Change
Canada. http://climate.weather.gc.ca/. [14] Gaur et al. 2019. Data, 4, 72.
[15] Saha et al. 2010. Research Data Archive at the National Center for Atmospheric Research, Computational and Information Systems Laboratory.
[16] Walls et al. 2015. Proc. of the 49th Int. Conf. of Arch. Sc. Ass. The Univ. of Melbourne, Australia. [17] Laouadi et al. 2019. Development of Framework
for Overheating Risk Analysis. Report: CRBCPI-Y3-R8. NRC. Ottawa.
[18] ASHRAE. 2017. ANSI/ASHRAE standard 55-2017. Atlanta, GA.
[19] Gagge et al. 1986. AHSRAE Transactions 92: 709-731.
[20] ISO. 2004. ISO 7933:2004. Geneva, Switzerland. [21] Fouillet et al. 2006. Int. Arch. Occup. Environ.
Health. 80(1):16-24.
[22] A. Laouadi, A. Gaur, M. A. Lacasse, M. Bartko & M. Armstrong (2020) Development of reference summer weather years for analysis of
overheating risk in buildings, JBPS, 13:3, 301-319. 0 25 50 75 100 125 150 175 200 225 250 1 3 5 7 9 11 13 SETH (°C*h) Body Water Loss (%)
Ottawa Toronto Montreal Correlation
60% of rehydration rate