HAL Id: cea-00307390
https://hal-cea.archives-ouvertes.fr/cea-00307390
Submitted on 29 Jul 2008
HAL is a multi-disciplinary open access
archive for the deposit and dissemination of
sci-entific research documents, whether they are
pub-lished or not. The documents may come from
teaching and research institutions in France or
abroad, or from public or private research centers.
L’archive ouverte pluridisciplinaire HAL, est
destinée au dépôt et à la diffusion de documents
scientifiques de niveau recherche, publiés ou non,
émanant des établissements d’enseignement et de
recherche français ou étrangers, des laboratoires
publics ou privés.
Pseudorabies virus and porcine epithelial cells during
infection.
Laurence Flori, Claire Rogel-Gaillard, Marielle Cochet, Gaetan Lemonnier,
Karine Hugot, Patrick Chardon, Stéphane Robin, François Lefèvre
To cite this version:
Laurence Flori, Claire Rogel-Gaillard, Marielle Cochet, Gaetan Lemonnier, Karine Hugot, et al..
Tran-scriptomic analysis of the dialogue between Pseudorabies virus and porcine epithelial cells during
infec-tion.. BMC Genomics, BioMed Central, 2008, 9, pp.123. �10.1186/1471-2164-9-123�. �cea-00307390�
Open Access
Research article
Transcriptomic analysis of the dialogue between Pseudorabies virus
and porcine epithelial cells during infection
Laurence Flori*
1, Claire Rogel-Gaillard
1, Marielle Cochet
2,
Gaetan Lemonnier
1, Karine Hugot
1, Patrick Chardon
1, Stéphane Robin
3and
François Lefèvre
2Address: 1INRA, DGA, UMR 314, Laboratoire de Radiobiologie et d'Etude du Génome, Jouy-en-Josas, F-78350 France; CEA, DSV, IRCM, SREIT, Laboratoire de Radiobiologie et d'Etude du Génome, Jouy-en-Josas, F-78350, France, 2INRA, DSA, UR892, Unité de Virologie et Immunologie Moléculaires, Jouy-en-Josas, F-78350, France and 3AgroParisTech-ENGREF-INRA, UMR 518, Unité de Mathématiques et Informatique Appliquées, Paris F-75005, France
Email: Laurence Flori* - [email protected]; Claire Rogel-Gaillard - [email protected];
Marielle Cochet - [email protected]; Gaetan Lemonnier - [email protected]; Karine Hugot - [email protected]; Patrick Chardon - [email protected]; Stéphane Robin - [email protected]; François Lefèvre - [email protected]
* Corresponding author
Abstract
Background: Transcriptomic approaches are relevant for studying virus-host cell dialogues to better understand
the physiopathology of infection and the immune response at the cellular level. Pseudorabies virus (PrV), a porcine Alphaherpesvirus, is a good model for such studies in pig. Since PrV displays a strong tropism for mucous epithelial cells, we developed a kinetics study of PrV infection in the porcine PK15 epithelial cell line. To identify as completely as possible, viral and cellular genes regulated during infection, we simultaneously analyzed PrV and cellular transcriptome modifications using two microarrays i.e. a laboratory-made combined SLA/PrV microarray, consisting of probes for all PrV genes and for porcine genes contained in the Swine Leukocyte Antigen (SLA) complex, and the porcine generic Qiagen-NRSP8 oligonucleotide microarray. We confirmed the differential expression of a selected set of genes by qRT-PCR and flow cytometry.
Results: An increase in the number of differentially expressed cellular genes and PrV genes especially from 4 h
post-infection (pi) was observed concomitantly with the onset of viral progeny while no early global cellular shutoff was recorded. Many cellular genes were down-regulated from 4 h pi and their number increased until 12 h pi. UL41 transcripts encoding the virion host shutoff protein were first detected as differentially expressed at 8 h pi. The viral gene UL49.5 encoding a TAP inhibitor protein was differentially expressed as soon as 2 h pi, indicating that viral evasion via TAP inhibition may start earlier than the cellular gene shutoff. We found that many biological processes are altered during PrV infection. Indeed, several genes involved in the SLA class I antigenic presentation pathway (SLA-Ia, TAP1, TAP2, PSMB8 and PSMB9), were down-regulated, thus contributing to viral immune escape from this pathway and other genes involved in apoptosis, nucleic acid metabolism, cytoskeleton signaling as well as interferon-mediated antiviral response were also modulated during PrV infection.
Conclusion: Our results show that the gene expression of both PrV and porcine cells can be analyzed
simultaneously with microarrays, providing a chronology of PrV gene transcription, which has never been described before, and a global picture of transcription with a direct temporal link between viral and host gene expression.
Published: 10 March 2008
BMC Genomics 2008, 9:123 doi:10.1186/1471-2164-9-123
Received: 20 August 2007 Accepted: 10 March 2008 This article is available from: http://www.biomedcentral.com/1471-2164/9/123
© 2008 Flori et al; licensee BioMed Central Ltd.
This is an Open Access article distributed under the terms of the Creative Commons Attribution License (http://creativecommons.org/licenses/by/2.0), which permits unrestricted use, distribution, and reproduction in any medium, provided the original work is properly cited.
Background
In vitro analyses of host cell/pathogen interactions are
essential to unravel the mechanisms of infection and to investigate the host response to infection. Pseudorabies virus (PrV) belongs to the Alphaherpesvirinae subfamily as for example the human herpes simplex virus 1 (HSV-1) and is a well-known pig pathogen responsible for Aujeszky's disease, causing considerable economical losses worldwide in this species [1]. Although some coun-tries have succeeded in eradicating Aujeszky's disease through vaccination and health policies, the disease prev-alence still remains variable in other countries. Young pig-lets are more severely affected by PrV infection often resulting in fatal encephalitis, than older infected pigs, which can remain asymptomatic or develop mild to severe respiratory disease symptoms associated with a limited mortality. Indeed, PrV displays a strong tropism for epithelial cells of the oronasal respiratory tract, which are the first cells targeted by virions [1,2]. Abortions, still-births or weak piglets that die within 48 h of birth are also observed when pregnant sows are infected [1]. Moreover, PrV can infect a broad range of vertebrates resulting in a uniform lethality but it is generally considered as a non-pathogenic agent for man [3]. Because PrV is easy to prop-agate in cells of several mammalian species including rodents and is not harmful to laboratory workers, PrV is a highly relevant model to study the biology of alphaher-pesviruses and their interactions with host cells in vitro [1]. In addition, its genome has been reconstructed from sequences of six different strains (Kaplan, Becker, Rice, Indiana-Funkhauser, NIA-3, and TNL) and 70 genes encoding structural and non structural proteins have been annotated [4].
Viruses have evolved strategies to evade the host immune response. In particular, herpesviruses interfere with the Major Histocompatibility Complex (MHC) class I antigen presentation pathway to avoid the Cytotoxic T Lym-phocyte (CTL) response [5]. MHC class I molecules are expressed on almost all nucleated cells and present pep-tides, including peptides derived from viral antigens, to CTL, which play a critical role in the defense mechanisms against viral infection. It has been reported that PrV infec-tion decreases the expression of MHC class I molecules on the cell surface [6]. This down-regulation is partly explained by the inhibition of the ABC transporter TAP activity, due to interactions with the viral gN protein encoded by the UL49.5 gene [7,8]. This inhibition is inde-pendent of the non-specific mRNA cellular shut-off pro-duced by the virion host shut-off (vhs) protein encoded by the UL41 gene [9]. However, mechanisms other than TAP inhibition may be involved in avoiding the MHC class I presentation pathway.
A precise and more complete identification of cellular and viral genes, which are up- or down-regulated during the time course of infection, is essential to better understand the physiopathology of infection and to identify the mol-ecules involved in host resistance/susceptibility mecha-nisms. During recent years, DNA microarray technology has proven to be a very efficient high-throughput tool to study the gene expression profiles of infected host cells or pathogens [10,11]. To date, three transcriptomic analyses focused on cellular gene expression have been carried out in non-porcine PrV infected cells [12-14]. Ray and Enquist have compared the cellular pathways regulated by PrV and HSV-1 during infection of rat embryonic fibroblast cells using a rat microarray [12]. In a similar system, Bruk-man and Enquist have explored how PrV evades the IFN-mediated immune response [13]. Finally, Blanchard et al have used a human microarray to characterize the impact of PrV infection in human embryonic kidney cells (HEK-293) [14]. These studies have identified many biological processes and host cell genes regulated during infection. The next step in a transcriptomic approach would be the simultaneous analysis of viral and cellular modifications of transcription during PrV infection [10,11] using por-cine genomic tools. Since the pig whole genome assembly is not yet achieved, no complete pan-genomic array exists and only partial generic microarrays are commercially available [15]. However, the pig MHC region referred to as the SLA (Swine Leukocyte Antigen) complex, located on chromosome 7, is the first region of the pig genome that is entirely sequenced and annotated [16].
In this context, our aim was to study the dialogue between PrV and the PK15 porcine epithelial cell line, which mim-ics the first porcine target cells. Using two different por-cine microarrays, we followed both the viral and cellular transcriptome kinetics during infection. These microar-rays were the Qiagen-NRSP8 commercial array [17] and a microarray we constructed, referred to as SLA/PrV, which combines probe sets specific to genes localized in the SLA complex, genes encoding other important immunological molecules [18] and all the PrV genes. Here, we present a large-scale analysis of the porcine physiological pathways regulated during viral infection with a special focus on genes in the SLA complex together with the modifications of the PrV transcriptome.
Results
Construction of the SLA/PrV microarray and
complementarity with the Qiagen-NRSP8 microarray
The 1789 DNA/cDNA probes spotted on the SLA/PrV microarray fall into four distinct probe sets: i) 420 probes localized on a segment of chromosome 7 between the loci PRL and PRIM2A (SSC7p1.1-q1.2), which includes the extended-SLA region and represents 272 unique sequences, 111 belonging to the strict SLA region between
the loci UBD and RING1 [16]; ii) 73 probes specific to 73 genes encoding molecules involved in immunity and localized outside the SLA region [18]; iii) 80 PrV probes specific to the 70 viral genes (Figure 1) and iv) 1170 probes randomly chosen for data normalization from porcine cDNA AGENAE library [19,20]. The PrV/SLA microarray covers 72.5% of the annotated sequences of the strict SLA region (= 111/153) [16,21].
The Qiagen-NRSP8 oligonucleotide microarray contains 13297 probes, which match 8541 unique human or mouse RefSeq or pig annotated gene NCBI accession numbers and 1.5% of these encode immune proteins [17]. Only 48 of the 420 probes from the extended SLA probe set and 41 of the 73 from the immune probe set are present on both microarrays.
Expression of PrV genes during the time course of infection
The six time points, which were studied in this experiment – i.e. 0, 1, 2, 4, 8 and 12 hours (h) post-infection (pi), were chosen according to viral growth kinetics observed in
PK15 cells in our experimental conditions (Figure 2). The expression of viral genes was detected between 2 and 12 h pi and increased during time and most of the genes were expressed at 8 and 12 h pi. The hierarchical clustering (HCL) of viral gene expression levels according to all con-ditions (time and infection status) allowed us to distin-guish two main groups: i) mock-infection at all time points and infection until 2 h pi ii) infection from 4 until 12 h (data not shown). With the k-means method, we identified three transcript clusters with similar expression profiles (Figure 3). The average expression levels for the first cluster (29 probes) showed little variation and only from 8 h pi. The second cluster contained 30 probes cor-responding to genes, the expression level of which increased from 4 h pi. The last group (21 probes) dis-played a higher increase of expression level from 2 to 8 h pi.
Using a linear model and student t tests, the analysis of viral genes, which were differentially expressed between infected and mock-infected cells at each time pi (FDR =
Map of the PrV transcriptome
Figure 1
Map of the PrV transcriptome. The relative location of transcripts and designed amplicons are shown. UL and US regions
of the PrV genome are represented in black while IR and TR regions are in pink. Transcripts corresponding to each gene are represented with arrows (coding region in orange and non-coding regions or introns in green). Amplicons are represented in blue on the genome. The name of each amplicon is written above the corresponding genome location. Size is measured in kb.
5 K 10 K 15 K 20 K 25 K 30 K UL54 UL53 UL52 ORF1 UL51 UL50 UL49 UL49.5 UL48 UL47 UL27 UL46 UL28 UL29 UL31 UL30 UL32 UL33 UL35 UL34 ORF 1 UL5 4 UL5 3 UL5 2 UL5 1 UL5 0 UL4 9. 5 UL4 9 UL4 8 UL4 7 UL4 6 GII ICP 18 .5 UL2 9 UL3 0 UL3 1 UL3 2 UL3 3 UL3 4 UL3 5 35 K 40 K 45 K 50 K 55 K 60 K
UL36 UL37 maj.
UL39
UL38 UL40 UL41UL42 UL43
UL37 min. UL44 UL26.5 UL25 UL26 UL24 UL23 UL22 UL3 61 UL3 62 UL3 7 UL3 8 UL3 9 UL4 0 UL4 1 UL4 2 UL4 3 GII IN IA3 ORF 2N IA3 UL2 6N IA3 UL2 5N IA3 UL2 4N IA3 TKN IA 3 GHN IA 3 65 K 70 K 75 K 80 K 85 K 90 K 95 K UL21 UL20 UL19 maj. UL17 UL18 UL16 UL15 UL13 UL14 UL19 min. UL15 UL12 UL11 UL9 UL10 UL8.5 UL8 UL6 UL7 UL5 UL4 UL2 UL3 UL1 UL3.5 UL2 1N IA3 UL2 0N IA3 UL1 91 UL1 92 UL1 8 UL1 7 UL1 6 UL1 5E X2 UL1 5E X12 UL1 4 UL1 3 UL1 2 UL1 1 UL1 0 UL9 2 UL8 .5
UL8 UL7 UL6 UL5 UL4 UL3
.5
UL3 UL2 UL1
100 K 105 K 110 K 115 K 120 K 125 K
LLT
IE180
EP0 US1
US3 maj. US6
US4 US7 US8 US2 US9 LLT US3 min. US1 LLT E1 LLT E2 1 LLT I2 LLT E2 22 EP0 1 EP0 2 IEP 1 IEP 2 RSP 40 PKN IA 3 GXG G GP5 0G D GP6 3G I GIG E 11K 2 28K NI A3 RSP 40 130 K 135 K 140 K IE180 LLT E2 1 LLT I2 LLT E2 22 IEP 1 IEP 2 5kb
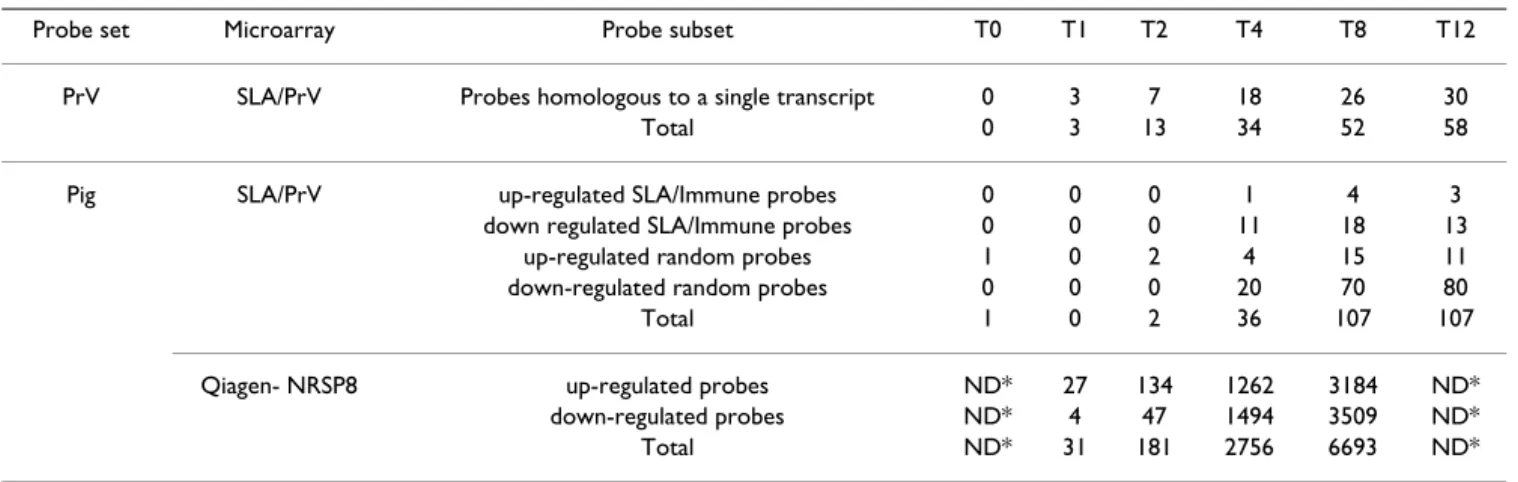
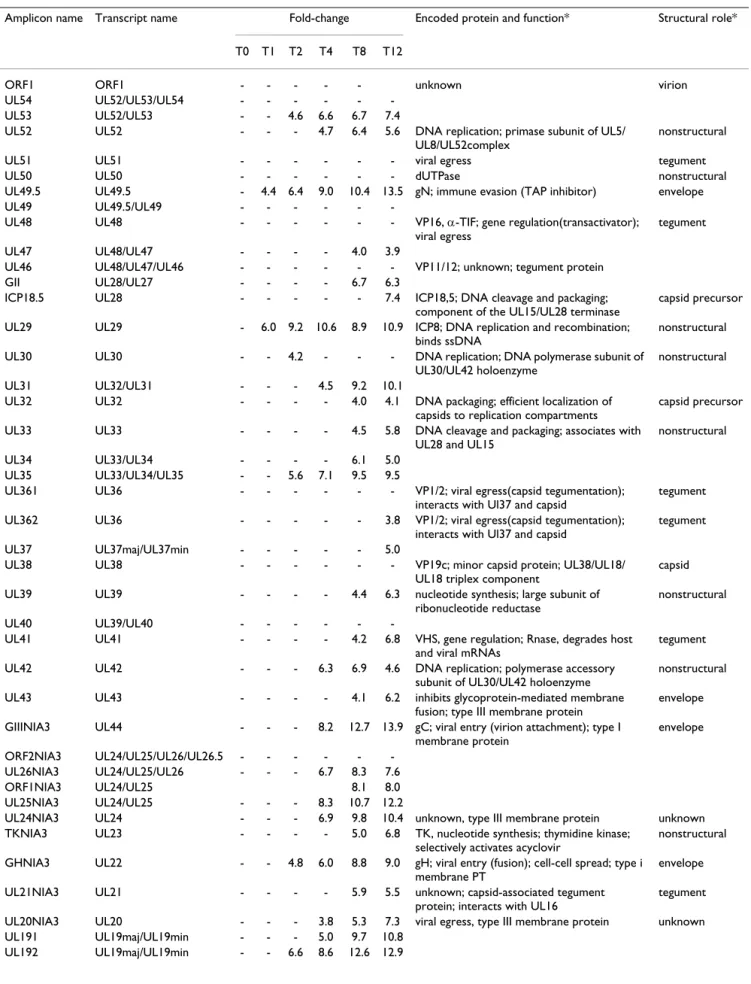
0.05) indicated that three differentially expressed probes were observed as soon as 1 h pi and that this number increased drastically between 2 and 8 h (39 additional probes) and reached a plateau after 8 h pi (Table 1). The important increase between 4 and 8 h confirmed the HCL and k-means results and correlated with the PrV growth curve (Figure 2). Nineteen probes were not differentially expressed between infected and mock-infected cells at any time and 16 of them were found in the less variable cluster by the k-means method (Figure 3). Most of the differen-tially expressed probes belonged to the two most variable clusters. Among the 58 differentially expressed probes, 26 recognized two to four transcripts and 32 were specific to a single transcript (Table 2). When examining these latter 32 genes, the first differentially expressed genes observed 1 h pi were US1 and UL29 encoding two non structural proteins RSP40 and ICP8, respectively, and UL49.5 encoding the virion envelope glycoprotein gN. However, IE180 encoding the immediate early protein IEP, a trans-activator of early gene expression was found differentially expressed at 4 h pi. Moreover, the four genes, which were
differentially expressed between 8 and 12 h, specify non structural (UL9), capsid (UL28), tegument (UL36) and envelope (US8) transcripts. The differential expression of UL41 encoding vhs protein was first detected at 8 h pi. Among the probes recognizing two transcripts, PKNIA3 specific of US3min and US3maj involved in the inhibi-tion of apoptosis was also differentially expressed from 8 h pi and UL37 specific of UL37min and UL37maj encod-ing a tegument protein was differentially expressed at 12 h pi.
Global PK15 differential gene expression during the time course of infection
The number of differentially expressed cellular probes increased with time in parallel to viral gene expression (Table 1). Between 0 and 2 h pi most of the SLA/immune probes showed no change and few differentially expressed genes were detected from 1 h pi with the Qiagen-NRPS8 microarray (Table 1). As shown in Table 1, the SLA/PrV microarray identified 1, 0, 2, 36, 107 and 107 differen-tially expressed probes at 0, 1, 2, 4, 8 and 12 h pi,
respec-PrV growth kinetics in PK15 cells
Figure 2
PrV growth kinetics in PK15 cells. The PK15 cells were infected with PrV NIA3 at 20 MOI in HMS-M medium. PrV was
titrated in the medium by plaque assay at different times pi (0, 4, 8, 12, 22, 26, 32 and 50 h pi). PrV titer was expressed as plaque forming units per ml (pfu/ml).
0
1
2
3
4
5
6
7
8
9
10
0 2 4 6 8 10 12 14 16 18 20 22 24 26 28 30 32 34 36 38 40 42 44 46 48 50 52 54time post-infection (hours)
lo
g (
p
fu
/
m
l)
tively [see Additional file 1] and the Qiagen-NRSP8 microarray identified 31, 181, 2756, 6693 differentially expressed probes at 1, 2, 4 and 8 h pi [see Additional file 2], respectively. The SLA/PrV microarray data show that 86 (31/36), 82 (88/107), and 87 % (93/107) of the differ-entially expressed probes were down-regulated at 4, 8 and 12 h pi, respectively and the Qiagen-NRSP8 microarray
data show that 13 (4/31), 26 (47/181), 54 (1494/2756) and 52 % (3509/6693) of the differentially expressed probes explored in this case were down-regulated at 1, 2, 4 and 8 h pi, respectively (Table 1). With the k-means method, the expression levels for each condition (time and infection status) of the SLA/PrV differentially expressed probes set were clustered in three groups (Figure
Clusters of PrV gene expression levels identified by the k-means method
Figure 3
Clusters of PrV gene expression levels identified by the k-means method. The average of normalized intensities for
all mock-infected conditions and for each infected condition, centered (median) by genes were analyzed with the k-means method (three clusters). For each cluster, one graph and one clustering picture are represented. The graph shows the mean of the expression levels of all genes (x = Time; y = mean of levels of expression). The clustering picture depicts the mean of each gene expression level for all mock-infected time points and for each infected time point (x = Time; y = level of expression). The list of PrV amplicons belonging to each cluster, the list of the corresponding viral genes and the location of the corresponding proteins in virion structure (for amplicons that hybridize to a single transcript) are represented on the right. The names of the probes that are differentially expressed are represented in blue. To distinguish immediate early, early and late genes, early genes are underlined. All other genes are late genes except IE180 which is the only immediate early gene of PrV.
Cluster 1
Cluster 2
Cluster 3
T8 MI T0 T1 T2 T4 T12 I T8 MI T0 T1 T2 T4 T12 I UL49 UL49.5/UL49 GP50GD US6 envelope EP02 EP0/LLTUL38 UL38 capsid
UL362 UL36 tegument
ORF1 ORF1 virion
UL48 UL48 tegument
UL40 UL39/UL40
UL51 UL51 tegument
UL37 UL37maj/UL37min
UL3 UL1/UL2/UL3
UL46 UL48/UL47/UL46 UL54 UL52/UL53/UL54 LLTE21 LLT (2nd exon) unknown ORF2NIA3 UL24/UL25/UL26/UL26.5
ICP18.5 UL28 capsid precursor
UL30 UL30 nonstructural
LLTE1 LLT (1st exon) unknown
IEP2 IE180 nonstructural
UL2 UL1/UL2 UL3.5 UL1/UL2/UL3/UL3.5 UL13 UL14/UL13 UL4 UL5/UL4 UL34 UL33/UL34 EP01 EP0/LLT
UL17 UL17 inner capsid
UL32 UL32 capsid precursor
UL361 UL36 tegument
UL43 UL43 envelope
UL18 Ul19min/UL18
IL15EX12 UL15 (1st exon) capsid
UL8 UL9/UL8.5/UL8
UL20NIA3 UL20 unknown
UL191 UL19maj/UL19min
UL10 UL10 envelope
ORF1NIA3 UL24/UL25
PKNIA3 US3maj/US3min tegument
UL21NIA3 UL21 tegument
GP63GI US6/US7
UL11 UL14/UL13/UL12/UL11
GII UL28/UL27
TKNIA3 UL23 nonstructural
UL92 UL9 non structural
UL1 UL1 envelope
UL41 UL41 tegument
UL142 UL14 unknown
UL14 UL14 unknown
UL31 UL32/UL31
UL39 UL39 nonstructural
UL12 UL14/UL13/UL12
UL33 UL33 nonstructural
UL52 UL52 nonstructural
GIGE US8 envelope
UL8.5 UL9/UL8.5
IEP1 IE180 nonstructural UL50 UL50 nonstructural
LLTI2 LLT intron
UL16 UL17/Ul16
UL47 UL48/UL47
UL25NIA3 UL24/UL25
GIIINIA3 UL44 envelope
Ba5 IE180/ LLT (2nd exon)
UL42 UL42 nonstructural
UL24NIA3 UL24 unknown
LLTE222 LLT (2nd exon) unknown
UL26NIA3 UL24/UL25/UL26
11K2 US9/US8
28KNIA3 US2 tegument
UL29 UL29 nonstructural
UL35 UL33/UL34/UL35
UL49.5 UL49.5 envelope
RSP40 US1 nonstructural
UL6 UL6 capsid
UL5 UL5 nonstructural
GXGG US3maj/US3min/US4
UL7 UL6/UL7
GHNIA3 UL22 envelope
UL192 UL19maj/UL19min
UL53 UL52/UL53
UL15EX2 UL15 (2nd exon) Capsid precursor
Scale of expression levels
AMPLICON TRANSCRIPT(S) DETECTED PROTEIN LOCATION IN VIRION STRUCTURE 0 1 2 3 4 -1 -2 -3 -4 0 1 2 3 4 -1 -2 -3 -4 0 1 2 3 4 -1 -2 -3 -4 0 3 - 3
4). Eighty-eight probes with a small decrease in expression levels from 4 h pi were found in the first cluster and 45 probes with a stronger decrease in expression levels from 2 h pi in the second cluster. The third cluster contained 27 up-regulated probes at 8 h pi. The results obtained with both microarrays show that many cellular genes were down-regulated during the time course of the experiment especially between 4 and 12 h pi.
PrV infection alters multiple biological processes and cellular functions
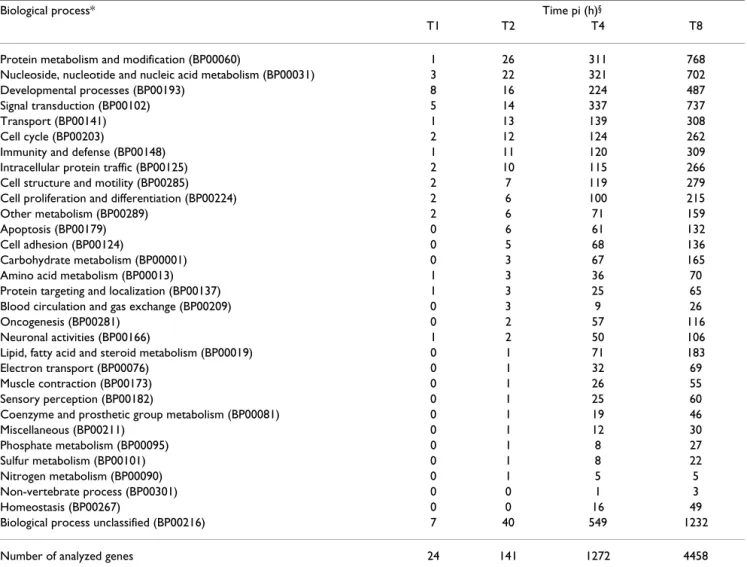
For each time point, the differentially expressed genes from the Qiagen-NRSP8 microarray were classified into biological processes using GO terms when available (Table 3). The biological processes that contained more than 5% of the differentially expressed genes during the period between 2 and 8 h pi included: protein metabo-lism and modification (BP0060), nucleoside, nucleotide and nucleic acid metabolism (BP00031), developmental process (BP00193), signal transduction (BP00102), trans-port (BP00141), cell cycle (BP00203), immunity and defense (BP00148), intracellular protein traffic (BP00125) and cell structure and motility (BP00285). Several biological processes were predominantly regu-lated 1 h pi such as developmental processes (BP00193) and signal transduction (BP00102). Other biological processes were regulated later such as cell adhesion (BP00124) or apoptosis (BP00179) from 2 h pi and homeostasis (BP00267) from 4 h pi.
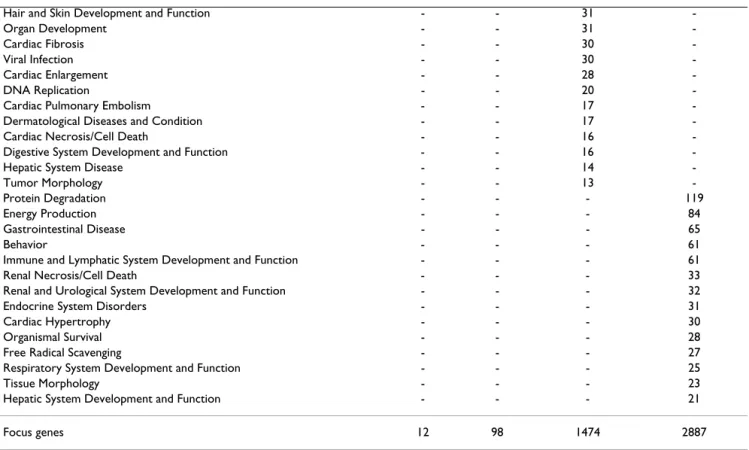
The Ingenuity Pathway Analysis (IPA) of the differentially expressed probes from the Qiagen-NRSP8 microarray identified 82 different top functions associated with sig-nificant networks (Table 4). Three top functions were reg-ulated early during infection (1 h pi): gene expression, molecular transport and drug metabolism. Sixteen, 68 and 67 top functions were modulated by PrV infection at 2, 4 and 8 h pi. Fifteen and 14 top functions were specific
of time points 4 and 8 h pi, respectively. The number of regulated top functions strongly increased from 4 h pi. The top functions containing the highest number of focus genes at both 4 and 8 h pi were those involved in cancer, cell cycle and cell signaling with the first two detected as early as 2 h pi. Immune response and immunological dis-ease top functions were found from 4 h pi and immune and lymphatic system development and function at 8 h pi. Cell death top function was first detected at 2 h pi.
PrV infection modifies the expression of genes involved in MHC antigenic presentation pathways
The expression of many genes belonging to the SLA class I antigenic presentation pathway was modulated during PrV infection according to the results of both microarrays (Table 5). SLA Ia genes were down-regulated from 4 h pi with the SLA/PrV microarray and from 8 h pi with the Qia-gen-NRSP8 microarray. TAP1 and TAP2 genes, encoding molecules involved in peptide transport from the cytosol to the endoplasmic reticulum, were also down-regulated 8 h pi according to the results of the Qiagen-NRSP8 microarray. Surprisingly, TAP1 was up-regulated 8 h pi with the SLA/PrV microarray. PSMB8 (alias LMP7), one of the genes encoding immunoproteasome molecules was up-regulated from 4 h pi on the Qiagen-NRSP8 microar-ray.
Unexpectedly, our results show that transcript levels of genes belonging to the MHC class II antigenic presenta-tion pathway were also modulated during PrV infecpresenta-tion. Expression of SLA-DOB and SLA-DMB decreased at 4 h pi according to the results from the SLA/PrV microarray (Table 5). SLA-DMB was also down-regulated with the Qiagen-NRSP8 microarray 8 h pi while DOA, SLA-DQA1 and CIITA were up-regulated at this time point (Table 5).
Table 1: Number of viral and cellular probes differentially expressed at each time point.
Probe set Microarray Probe subset T0 T1 T2 T4 T8 T12
PrV SLA/PrV Probes homologous to a single transcript 0 3 7 18 26 30
Total 0 3 13 34 52 58
Pig SLA/PrV up-regulated SLA/Immune probes 0 0 0 1 4 3
down regulated SLA/Immune probes 0 0 0 11 18 13
up-regulated random probes 1 0 2 4 15 11
down-regulated random probes 0 0 0 20 70 80
Total 1 0 2 36 107 107
Qiagen- NRSP8 up-regulated probes ND* 27 134 1262 3184 ND*
down-regulated probes ND* 4 47 1494 3509 ND*
Total ND* 31 181 2756 6693 ND*
Table 2: Viral probes and fold-change during infection kinetics.
Amplicon name Transcript name Fold-change Encoded protein and function* Structural role*
T0 T1 T2 T4 T8 T12
ORF1 ORF1 - - - unknown virion
UL54 UL52/UL53/UL54 - - -
-UL53 UL52/UL53 - - 4.6 6.6 6.7 7.4
UL52 UL52 - - - 4.7 6.4 5.6 DNA replication; primase subunit of UL5/
UL8/UL52complex
nonstructural
UL51 UL51 - - - viral egress tegument
UL50 UL50 - - - dUTPase nonstructural
UL49.5 UL49.5 - 4.4 6.4 9.0 10.4 13.5 gN; immune evasion (TAP inhibitor) envelope
UL49 UL49.5/UL49 - - -
-UL48 UL48 - - - VP16, α-TIF; gene regulation(transactivator);
viral egress
tegument
UL47 UL48/UL47 - - - - 4.0 3.9
UL46 UL48/UL47/UL46 - - - VP11/12; unknown; tegument protein
GII UL28/UL27 - - - - 6.7 6.3
ICP18.5 UL28 - - - 7.4 ICP18,5; DNA cleavage and packaging;
component of the UL15/UL28 terminase
capsid precursor
UL29 UL29 - 6.0 9.2 10.6 8.9 10.9 ICP8; DNA replication and recombination;
binds ssDNA
nonstructural
UL30 UL30 - - 4.2 - - - DNA replication; DNA polymerase subunit of
UL30/UL42 holoenzyme
nonstructural
UL31 UL32/UL31 - - - 4.5 9.2 10.1
UL32 UL32 - - - - 4.0 4.1 DNA packaging; efficient localization of
capsids to replication compartments
capsid precursor
UL33 UL33 - - - - 4.5 5.8 DNA cleavage and packaging; associates with
UL28 and UL15
nonstructural
UL34 UL33/UL34 - - - - 6.1 5.0
UL35 UL33/UL34/UL35 - - 5.6 7.1 9.5 9.5
UL361 UL36 - - - VP1/2; viral egress(capsid tegumentation);
interacts with Ul37 and capsid
tegument
UL362 UL36 - - - 3.8 VP1/2; viral egress(capsid tegumentation);
interacts with Ul37 and capsid
tegument
UL37 UL37maj/UL37min - - - 5.0
UL38 UL38 - - - VP19c; minor capsid protein; UL38/UL18/
UL18 triplex component
capsid
UL39 UL39 - - - - 4.4 6.3 nucleotide synthesis; large subunit of
ribonucleotide reductase
nonstructural
UL40 UL39/UL40 - - -
-UL41 UL41 - - - - 4.2 6.8 VHS, gene regulation; Rnase, degrades host
and viral mRNAs
tegument
UL42 UL42 - - - 6.3 6.9 4.6 DNA replication; polymerase accessory
subunit of UL30/UL42 holoenzyme
nonstructural
UL43 UL43 - - - - 4.1 6.2 inhibits glycoprotein-mediated membrane
fusion; type III membrane protein
envelope
GIIINIA3 UL44 - - - 8.2 12.7 13.9 gC; viral entry (virion attachment); type I
membrane protein envelope ORF2NIA3 UL24/UL25/UL26/UL26.5 - - - -UL26NIA3 UL24/UL25/UL26 - - - 6.7 8.3 7.6 ORF1NIA3 UL24/UL25 8.1 8.0 UL25NIA3 UL24/UL25 - - - 8.3 10.7 12.2
UL24NIA3 UL24 - - - 6.9 9.8 10.4 unknown, type III membrane protein unknown
TKNIA3 UL23 - - - - 5.0 6.8 TK, nucleotide synthesis; thymidine kinase;
selectively activates acyclovir
nonstructural
GHNIA3 UL22 - - 4.8 6.0 8.8 9.0 gH; viral entry (fusion); cell-cell spread; type i
membrane PT
envelope
UL21NIA3 UL21 - - - - 5.9 5.5 unknown; capsid-associated tegument
protein; interacts with UL16
tegument
UL20NIA3 UL20 - - - 3.8 5.3 7.3 viral egress, type III membrane protein unknown
UL191 UL19maj/UL19min - - - 5.0 9.7 10.8
Immune response, apoptosis, nucleic acid binding and actin cytoskeleton pathways are modulated during PrV infection
Among all the biological processes (Table 3) and top func-tions (Table 4), shown to be regulated during PrV infec-tion, we examined in greater detail genes differentially expressed in four pathways i.e. immune response, apopto-sis, nucleic acid binding and actin cytoskeleton (Table 5).
For genes involved in immune response, we observed that CD4 and CD69 were up- and down-regulated from 4 h pi, respectively (Table 5) and that several chemokine ligand and interleukin genes such as IL12A, IL12B and IL17 were down-regulated at 4 and 8 h pi. These observations have a poor biological significance. Since the relevant gene prod-ucts are known to be specific of immune cells, it is proba-ble that these transcript expressions are not correlated
UL18 Ul19min/UL18 - - - 7.0 5.7 9.6
UL15EX2 UL15 (2nd exon) - - 6.4 6.5 7.5 9.2 DNA cleavage/encapsidation; terminase
subunit of UL15/UL28 terminase6
capsid precursor
UL17 UL17 - - - DNA cleavage and encapsidation inner capsid
UL16 UL17/Ul16 - - - 4.5 6.2 5.0
UL15EX12 UL15 (1st exon) - - - - 4.0 7.7 DNA cleavage/encapsidation; terminase
subunit of UL15/UL28 terminaseUL6
capsid precursor
UL14 UL14 6.1 6.1 9.8 unknown unknown
UL142 UL14 - - - - 6.3 7.8 unknown unknown
UL13 UL14/UL13 - - -
-UL12 UL14/UL13/UL12 - - - - 3.7 5.3
UL11 UL14/UL13/UL12/UL11 - - - 6.0
UL10 UL10 - - - - 6.6 6.1 gM; inhibits glycoprotein-mediated membrane
fusion; type III membrane protein
envelope
UL92 UL9 - - - 4.1 not found non structural
UL8.5 UL9/UL8.5 - - - 4.0 -
-UL8 UL9/UL8.5/UL8 - - -
-UL7 UL6/UL7 - - 5.0 7.4 10.7 9.4
UL6 UL6 - - 5.0 12.7 13.8 13.3 capsid protein; portal protein; docking site for
terminase
capsid
UL5 UL5 - - 4.3 6.3 8.7 5.9 DNA replication; part of UL5/UL8/UL52
helicase/primase complex
nonstructural
UL4 UL5/UL4 - - - - 3.5 5.5 unknown
UL3.5 UL1/UL2/UL3/UL3.5 - - -
-UL3 UL1/UL2/UL3 - - - - 5.1 6.5
UL2 UL1/UL2 - - - 4.2 5.4 5.4
UL1 UL1 - - - - 6.5 7.3 gL; viral entry (fusion); sell-sell spread envelope
LLTE1 LLT (1st exon) - - - 4.6 6.5 8.0 not found unknown
EP02 EP0/LLT - - -
-EP01 EP0/LLT - - - - 6.3 4.7
LLTI2 LLT intron - - - - 3.7 4.7
LLTE21 LLT (2nd exon) - - - - - - not found unknown
IEP2 IE180 - - - 3.5 - - ICP4; gene regulation (transactivator);
immediate early protein
nonstructural
IEP1 IE180 - - - ICP4; gene regulation (transactivator);
immediate early protein
nonstructural
Ba5 IE180/LLT (2nd exon) 5.9 6.7 4.3
LLTE222 LLT (2nd exon) - - - 6.8 8.9 8.2 not found unknown
RSP40 US1 - 5.3 8.3 12.9 15.3 13.0 RSP40/ICP22; unknown; HIV-1 homolog acts
as regulator of gene expression
nonstructural
PKNIA3 US3maj/US3min - - - - 6.0 5.0 PK, minor and major form of protein kinase;
inhibits apoptosis
tegument
GXGG US3maj/US3min/US4 - - 6.5 9.1 10.6 11.0
GP50GD US6 - - - gD; viral entry, type I membrane protein envelope
GP63GI US6/US7 - - - 5.0 6.3 8.5
GIGE US8 - - - 4.0 - 4.3 gE; cell-cell spread envelope
11K2 US9/US8 - - - 9.0 10.0 10.4
28KNIA3 US2 - - - 6.2 6.9 7.1 28K, tegument protein; membrane associated
protein
tegument
*gene function and structural role [1] are only specified for amplicons that hybridize to a single transcript. - gene not found differentially expressed between PrV infected and mock-infected cells
with significant protein synthesis in the present epithelial cell context. Among the genes involved in interferon-mediated immunity, many were modulated during PrV infection (Table 5) i.e. IFNAR2 and IFI6 transcript levels increased from 4 h pi and ISGF3G transcript levels at 8 h pi. The expression of IRF1, IRF2and IRF5 appeared down-regulated from 4 h pi and that of IRF3 at 8 h pi. IFNA6, IFI30 were down-regulated 8 h pi while IFNG, which was included in the SLA/PrV probe set, was not detected as a
differentially expressed gene. In addition, the expression of TLR8, involved in recognition of viral nucleic acid bind-ing was decreased at 8 h pi. Immunophilin genes were also regulated during infection. From 4 h pi PPIA (alias Cyclophilin A) was down-regulated (Table 5) and at 8 h pi PPIF and PPIG were down-regulated while PPIH was up-regulated.
Clusters of PK15 gene expression levels identified by the k-means method
Figure 4
Clusters of PK15 gene expression levels identified by the k-means method. The expression levels of genes that are
differentially expressed between infected and mock-infected cells at each time point are analyzed by the k-means method (three clusters). Averages of normalized intensities for all mock-infected conditions and for each infected condition were cen-tered (median) by genes. For each cluster, one graph and one clustering picture are represented. The graph shows the mean of the expression levels of all genes (x = Time; y = mean of levels of expression) and the clustering picture depicts the mean of each gene expression level for all mock-infected time points and for each infected time point (x = Time; y = level of expres-sion). T8 MI T0 T1 T2 T4 T12 I NKAP MYL9 SLA-7 CCT7 ZNF546 PI16 4S ribosomal protein S3 Unknown CXCR6 HIST1H2AL
Heterogenous nuclear ribonucleoprotein HLA-DOB
Unknown Unknown SRF Unknown Pyruvate kinase isosymes M1/M2 6S ribosomal protein L11 Unkown Unknown PFDN4 SLC39A7 Unknown COX3 SPMI Unknown Unknown Unknown Ubiquitin HSPA8 Unknown LMD1 Unknown SLA class 1 4S ribosomal protein S8 4S ribosomal protein S17 SLA class 1 6S ribosomal protein L19 Calcyclin 6S ribosomal protein L18 C7H6orf48 Tumor protein p73 RFHC1 Unkown 6S ribosomal protein L17 CPNE5 6S ribosomal protein L37a 4S ribosomal protein S3 Putative methyl-transferase Unkown 13KDa leucine-rich protein Guanine nucleotide binding protein G NADH-ubiquinone oxidoreductase chain RGL2
C6orf49 Unknown SET protein Splicing factor subunit 1 Unknown EGD2 FKBP5 Unknown 6S ribosomal protein L11 Nucleobindin 2 precursor C2orf178 6S ribosomal protein L13 HLA-DMB Unknown GSTZ1 GATA-4 NifU-like protein Apolipoprotein 1-IV precursor TAP1
Unknown Eukaryotic initiation factor 4A-II ZNF193
U4/U6 small nuclear ribonucleoprotein LY6G6C
CWFN HM13 Fibrinogen alpha chain Unknown Unknown SLA class 1
Cyclin-dependent kinase regulatory subunit 2 KLF9 Unknown Unknown HIST1H4J Unknown Unknown KCTD20 Unknown Ferritin light chain Unknown Fibronectin Unknown Unknown Unnkown SPG7 Unknown Unknown Unknown C6orf89 Unknown PPIA HIST1H2BK Unknown Unknown COX3 HIST3H2BB Unknown 6S ribosomal protein L19 COX2 Unknown Unknown COX3 Unknown SFP57 H2AfJ RAN Unknown BTNL5/BTNL6 Unknown Calmodulin AS16
Mitogen activated protein kinase kinase kinase 3 4S ribosomal protein S3 Unknown Ubiquitin YV28 PPIA ACTB
Calpain 2 large subunit precursor Forkhead box protein 01A Epithelial protein lost in neoplasm DNA-binding protein inhibitor ID-3 Pantothenate kinase 4 M3KC Jerky protein
Guanine nucleotide exchange factor DBS RPL10A
Tumor suppressor p53-binding protein 1 SUF1 TRIM26 Unknown Unknown Unknown CED2 Unknown CCR7 Adiponutrin Epithelial protein lost in neoplasm SRPK1
SPBP APOBEC2 Unknown
Zinc phosphodiesterase ELAC protein 2 RS11
Unknown
Scale of expression levels
T8 MI T0 T1 T2 T4 T12 I T8 MI T0 T1 T2 T4 T12 I Cluster 1 T8 MI T0 T1 T2 T4 T12 I 1 0 -1 Cluster 2 T8 MI T0 T1 T2 T4 T12 I 1 0 -1 Cluster 3 T8 MI T0 T1 T2 T4 T12 I 1 0 -1 0 3 - 3
For the apoptosis pathway, genes belonging to the BCL-2 molecule family, FAIM2, CASP1 and CASP3 were down-regulated whereas CASP7 and NF-KB2 were up-down-regulated. Transcript levels of JAK1, XBP1, ATF4 and HSPA5 were decreased at 8 h pi. HSPA1A, HSPA1B, HSPA2, HSPA4, HSPA4K and HSPA8 were up-regulated at 8 h pi and EIF2A from 4 h pi. HSPA6 was first down-regulated at 2 h pi and then up-regulated from 4 h pi. Several differentially expressed genes, which belong to the apoptosis pathway, were also involved in the stress response.
Among the differentially expressed genes that play a role in nucleoside, nucleotide and nucleic acid binding, the expression of histone genes HIST1H2AL, HIST1H4J, HIST1H2BK was decreased from 4 h pi. Expression of sev-eral histone deacetylases was also regulated during infec-tion: HDAC2 and HDAC10 expression levels increased,
while HDAC3, HDAC6, and HDAC9 expression decreased. HDAC2 and HDAC9 were regulated early from 2 h pi. Several genes encoding signal transducers and acti-vators of transcription (STAT1, STAT3, STAT5B and STAT6) were down-regulated during PrV infection. Within the actin cytoskeleton pathway, ACTG1 was up-regulated very early i.e. as soon as 1 h pi. Other genes such as ACTC1, ACTRT2, ACTA4, MYO1D and MYO5A were all down-regulated from 4 or 8 h pi and ACTL6A was up-reg-ulated at 8 h pi.
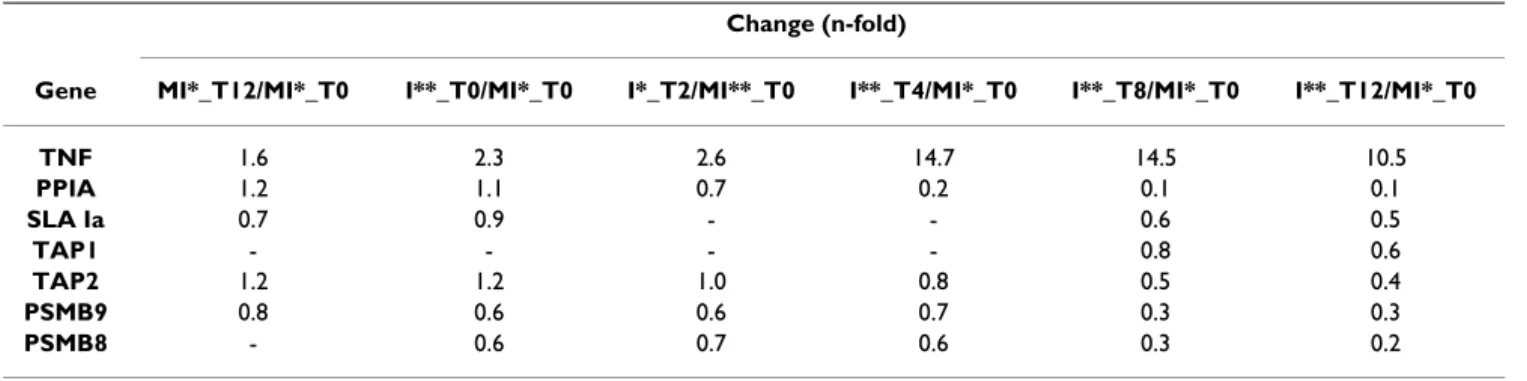
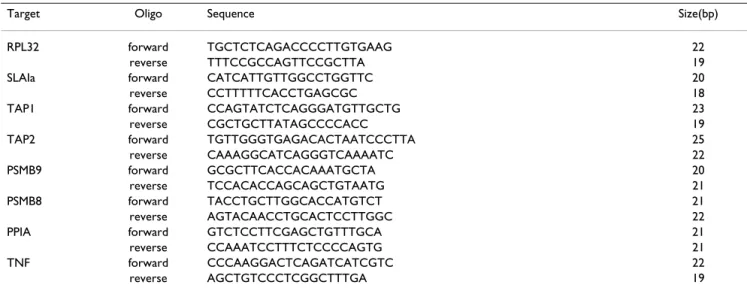
Validation of microarray results by quantitative real-time PCR (qRT-PCR)
Five genes involved in the presentation antigen class I pathway were studied by qRT-PCR: SLA Ia, TAP1, TAP2, PSMB8 and PSMB9. PPIA, down-regulated during
infec-Table 3: Biological processes associated with differentially expressed cellular genes.
Biological process* Time pi (h)§
T1 T2 T4 T8
Protein metabolism and modification (BP00060) 1 26 311 768
Nucleoside, nucleotide and nucleic acid metabolism (BP00031) 3 22 321 702
Developmental processes (BP00193) 8 16 224 487
Signal transduction (BP00102) 5 14 337 737
Transport (BP00141) 1 13 139 308
Cell cycle (BP00203) 2 12 124 262
Immunity and defense (BP00148) 1 11 120 309
Intracellular protein traffic (BP00125) 2 10 115 266
Cell structure and motility (BP00285) 2 7 119 279
Cell proliferation and differentiation (BP00224) 2 6 100 215
Other metabolism (BP00289) 2 6 71 159
Apoptosis (BP00179) 0 6 61 132
Cell adhesion (BP00124) 0 5 68 136
Carbohydrate metabolism (BP00001) 0 3 67 165
Amino acid metabolism (BP00013) 1 3 36 70
Protein targeting and localization (BP00137) 1 3 25 65
Blood circulation and gas exchange (BP00209) 0 3 9 26
Oncogenesis (BP00281) 0 2 57 116
Neuronal activities (BP00166) 1 2 50 106
Lipid, fatty acid and steroid metabolism (BP00019) 0 1 71 183
Electron transport (BP00076) 0 1 32 69
Muscle contraction (BP00173) 0 1 26 55
Sensory perception (BP00182) 0 1 25 60
Coenzyme and prosthetic group metabolism (BP00081) 0 1 19 46
Miscellaneous (BP00211) 0 1 12 30 Phosphate metabolism (BP00095) 0 1 8 27 Sulfur metabolism (BP00101) 0 1 8 22 Nitrogen metabolism (BP00090) 0 1 5 5 Non-vertebrate process (BP00301) 0 0 1 3 Homeostasis (BP00267) 0 0 16 49
Biological process unclassified (BP00216) 7 40 549 1232
Number of analyzed genes 24 141 1272 4458
§ The number of genes from the Qiagen_NRSP8 microarray found in Panther database is reported at each time point for each biological process.
Table 4: Top functions associated with significant networks identified by IPA and number of focus genes at each time point.
Top functions Time
T1 T2 T4 T8
Gene Expression 9 12 178 297
Molecular Transport 9 - 81 372
Drug Metabolism 9 - 31 83
Cancer - 47 386 357
Connective Tissue Development and Function - 27 103 152
Cell Cycle - 24 246 432
Cellular Development - 23 144 64
Cell Death - 23 141 205
Cell Morphology - 23 91 58
Cellular Movement - 15 92 125
Cellular Assembly and Organization - 15 82 358
Post-Translational Modification - 13 75 79
Small Molecule Biochemistry - 13 64 324
Amino Acid Metabolism - 13 56 219
Neurological Disease - 12 59 147
Organismal Injury and Abnormalities - 12 30 56
Cellular Growth and Proliferation - 11 93 114
Connective Tissue Disorders - 11 15 21
Cell Signaling - - 223 662
DNA Replication Recombination and Repair - - 183 194
Genetic Disorder - - 128 218
Nervous System Development and Function - - 98 166
Hematological Disease - - 92 89
Protein Synthesis - - 88 204
Dermatological Diseases and Conditions - - 82 175
Hematological System Development and Function - - 81 116
Lipid Metabolism - - 79 363
Cell-To-Cell Signaling and Interaction - - 76 122
Skeletal and Muscular Disorders - - 76 33
Immune Response - - 71 246
Cardiovascular Disease - - 70 80
Cellular Function and Maintenance - - 61 263
Embryonic Development - - 54 180
Endocrine System Development and Function - - 53 62
Immunological Disease - - 44 54
RNA Post-Transcriptional Modification - - 43 122
Nucleic Acid Metabolism - - 39 130
Reproductive System Development and Function - - 35 26
Tissue Development - - 34 73
Protein Trafficking - - 34 63
Protein Folding - - 32 31
Carbohydrate Metabolism - - 31 136
Cardiovascular System Development and Function - - 31 127
Organismal Development - - 29 30
Cellular Compromise - - 28 96
Organ Morphology - - 28 91
Vitamin and Mineral Metabolism - - 27 61
Skeletal and Muscular System Development and Function - - 25 33
Developmental Disorder - - 18 33 Inflammatory Disease - - 16 95 Nutritional Disease - - 16 30 Infectious Disease - - 14 65 Metabolic Disease - - 12 89 Viral Function - - 61
-Reproductive System Disease - - 48
-tion, and TNF, even if not detected as differentially expressed in our transcriptome experiment, were also cho-sen for validation (Table 6). qRT-PCR were performed for a subset of conditions at 0, 2, 4, 8, and 12 h pi (see mate-rials and methods). We confirmed that SLA Ia genes were down-regulated during infection from 8 h pi. We also observed a clear down-regulation of TAP1 and TAP2 from 8 and 4 h pi, respectively. An early down-regulation of PSMB8 and PSMB9 was detected before 2 h pi. TNF was strongly up-regulated from 4 h pi and PPIA was down-reg-ulated from 2 h pi.
Cell surface expression of MHC class I and MHC class II molecules on PK15 cells during PrV infection
Since our experiments, as well as other studies [6,7], have clearly indicated a down-regulation of the MHC class I genes during PrV infection, we checked, by flow cytome-try, for a down-regulation of surface MHC class I mole-cules on PrV infected PK15 cells at 8 h pi. To visualize infected cells, we used, in the same experimental condi-tions, a recombinant PrV strain (derived from NIA3) expressing the green fluorescent protein (GFP). Ninety percent of the cells appeared infected and 73% of these infected cells expressed surface MHC class I molecules on their surface while 89.1% and 83.9% of the mock-infected cells expressed MHC class I molecules at 0 and 8 h pi,
respectively (data not shown). The MHC class I mean flu-orescence intensity of infected cells at 8 h pi was 50.9% of that of mock-infected cells (mean of three experiments) thus confirming a clear decrease of MHC class I molecules expression on the surface of infected cells (Figure 5). As a control, we observed that the expression of tubulin, detected by Western blot, remains unchanged even 8 h pi in PK15 cells (data not shown).
Since a significant variation in MHC class II transcript lev-els during infection was detected in our transcriptome analysis, we also analyzed the expression of MHC class II molecules on the surface of PK15 cells. Our results show that 5.5% of mock-infected cells (at 0 and 8 h pi) and infected cells (0 h pi) expressed surface MHC class II mol-ecules. However, we could not detect any differential expression between infected and mock-infected cells at 8 h pi.
Discussion
A joint PrV-porcine epithelial cell transcriptomic approach
This work is the first study of PrV transcriptome expres-sion during the time course of infection. Moreover, it is the first time that the gene expressions of both PrV (NIA3 strain) and porcine cells during infection are analyzed simultaneously and we demonstrate that virus and host
Hair and Skin Development and Function - - 31
-Organ Development - - 31
-Cardiac Fibrosis - - 30
-Viral Infection - - 30
-Cardiac Enlargement - - 28
-DNA Replication - - 20
-Cardiac Pulmonary Embolism - - 17
-Dermatological Diseases and Condition - - 17
-Cardiac Necrosis/Cell Death - - 16
-Digestive System Development and Function - - 16
-Hepatic System Disease - - 14
-Tumor Morphology - - 13
-Protein Degradation - - - 119
Energy Production - - - 84
Gastrointestinal Disease - - - 65
Behavior - - - 61
Immune and Lymphatic System Development and Function - - - 61
Renal Necrosis/Cell Death - - - 33
Renal and Urological System Development and Function - - - 32
Endocrine System Disorders - - - 31
Cardiac Hypertrophy - - - 30
Organismal Survival - - - 28
Free Radical Scavenging - - - 27
Respiratory System Development and Function - - - 25
Tissue Morphology - - - 23
Hepatic System Development and Function - - - 21
Focus genes 12 98 1474 2887
*The same focus gene may exist in different top functions.
§ The number of focus genes from the Qiagen_NRSP8 microarray is reported at each time point for each top function.
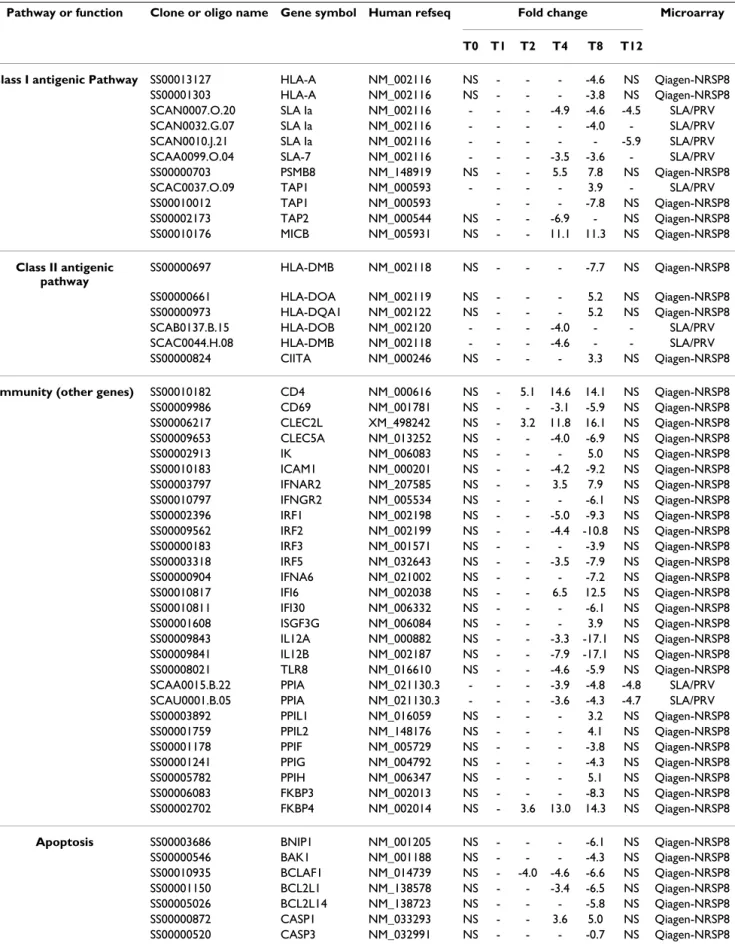
Table 5: Subset of differentially expressed cellular genes at each time point.
Pathway or function Clone or oligo name Gene symbol Human refseq Fold change Microarray
T0 T1 T2 T4 T8 T12
Class I antigenic Pathway SS00013127 HLA-A NM_002116 NS - - - -4.6 NS Qiagen-NRSP8
SS00001303 HLA-A NM_002116 NS - - - -3.8 NS Qiagen-NRSP8
SCAN0007.O.20 SLA Ia NM_002116 - - - -4.9 -4.6 -4.5 SLA/PRV
SCAN0032.G.07 SLA Ia NM_002116 - - - - -4.0 - SLA/PRV
SCAN0010.J.21 SLA Ia NM_002116 - - - -5.9 SLA/PRV
SCAA0099.O.04 SLA-7 NM_002116 - - - -3.5 -3.6 - SLA/PRV
SS00000703 PSMB8 NM_148919 NS - - 5.5 7.8 NS Qiagen-NRSP8
SCAC0037.O.09 TAP1 NM_000593 - - - - 3.9 - SLA/PRV
SS00010012 TAP1 NM_000593 - - - -7.8 NS Qiagen-NRSP8 SS00002173 TAP2 NM_000544 NS - - -6.9 - NS Qiagen-NRSP8 SS00010176 MICB NM_005931 NS - - 11.1 11.3 NS Qiagen-NRSP8 Class II antigenic pathway SS00000697 HLA-DMB NM_002118 NS - - - -7.7 NS Qiagen-NRSP8 SS00000661 HLA-DOA NM_002119 NS - - - 5.2 NS Qiagen-NRSP8 SS00000973 HLA-DQA1 NM_002122 NS - - - 5.2 NS Qiagen-NRSP8
SCAB0137.B.15 HLA-DOB NM_002120 - - - -4.0 - - SLA/PRV
SCAC0044.H.08 HLA-DMB NM_002118 - - - -4.6 - - SLA/PRV
SS00000824 CIITA NM_000246 NS - - - 3.3 NS Qiagen-NRSP8
Immunity (other genes) SS00010182 CD4 NM_000616 NS - 5.1 14.6 14.1 NS Qiagen-NRSP8
SS00009986 CD69 NM_001781 NS - - -3.1 -5.9 NS Qiagen-NRSP8 SS00006217 CLEC2L XM_498242 NS - 3.2 11.8 16.1 NS Qiagen-NRSP8 SS00009653 CLEC5A NM_013252 NS - - -4.0 -6.9 NS Qiagen-NRSP8 SS00002913 IK NM_006083 NS - - - 5.0 NS Qiagen-NRSP8 SS00010183 ICAM1 NM_000201 NS - - -4.2 -9.2 NS Qiagen-NRSP8 SS00003797 IFNAR2 NM_207585 NS - - 3.5 7.9 NS Qiagen-NRSP8 SS00010797 IFNGR2 NM_005534 NS - - - -6.1 NS Qiagen-NRSP8 SS00002396 IRF1 NM_002198 NS - - -5.0 -9.3 NS Qiagen-NRSP8 SS00009562 IRF2 NM_002199 NS - - -4.4 -10.8 NS Qiagen-NRSP8 SS00000183 IRF3 NM_001571 NS - - - -3.9 NS Qiagen-NRSP8 SS00003318 IRF5 NM_032643 NS - - -3.5 -7.9 NS Qiagen-NRSP8 SS00000904 IFNA6 NM_021002 NS - - - -7.2 NS Qiagen-NRSP8 SS00010817 IFI6 NM_002038 NS - - 6.5 12.5 NS Qiagen-NRSP8 SS00010811 IFI30 NM_006332 NS - - - -6.1 NS Qiagen-NRSP8 SS00001608 ISGF3G NM_006084 NS - - - 3.9 NS Qiagen-NRSP8 SS00009843 IL12A NM_000882 NS - - -3.3 -17.1 NS Qiagen-NRSP8 SS00009841 IL12B NM_002187 NS - - -7.9 -17.1 NS Qiagen-NRSP8 SS00008021 TLR8 NM_016610 NS - - -4.6 -5.9 NS Qiagen-NRSP8
SCAA0015.B.22 PPIA NM_021130.3 - - - -3.9 -4.8 -4.8 SLA/PRV
SCAU0001.B.05 PPIA NM_021130.3 - - - -3.6 -4.3 -4.7 SLA/PRV
SS00003892 PPIL1 NM_016059 NS - - - 3.2 NS Qiagen-NRSP8 SS00001759 PPIL2 NM_148176 NS - - - 4.1 NS Qiagen-NRSP8 SS00001178 PPIF NM_005729 NS - - - -3.8 NS Qiagen-NRSP8 SS00001241 PPIG NM_004792 NS - - - -4.3 NS Qiagen-NRSP8 SS00005782 PPIH NM_006347 NS - - - 5.1 NS Qiagen-NRSP8 SS00006083 FKBP3 NM_002013 NS - - - -8.3 NS Qiagen-NRSP8 SS00002702 FKBP4 NM_002014 NS - 3.6 13.0 14.3 NS Qiagen-NRSP8
Apoptosis SS00003686 BNIP1 NM_001205 NS - - - -6.1 NS Qiagen-NRSP8
SS00000546 BAK1 NM_001188 NS - - - -4.3 NS Qiagen-NRSP8 SS00010935 BCLAF1 NM_014739 NS - -4.0 -4.6 -6.6 NS Qiagen-NRSP8 SS00001150 BCL2L1 NM_138578 NS - - -3.4 -6.5 NS Qiagen-NRSP8 SS00005026 BCL2L14 NM_138723 NS - - - -5.8 NS Qiagen-NRSP8 SS00000872 CASP1 NM_033293 NS - - 3.6 5.0 NS Qiagen-NRSP8 SS00000520 CASP3 NM_032991 NS - - - -0.7 NS Qiagen-NRSP8
cell transcriptome modifications can be examined with a unique microarray combining viral and host cell probe sets. Indeed, a majority of transcriptomic studies have focused either on host or on pathogen gene expression profiling [11,22,23] and only a few studies report the simultaneous detection of pathogen and mammalian host transcriptomes i.e. Plasmodium berghei ANKA and mouse [24] and EBV-NK/T cell lymphoma and man [25]. Our work confirms the feasibility and the relevance of this kind of approach to establish a direct link between patho-gen and cellular patho-gene expression. In order to explore por-cine cellular gene expression with even more detail, we chose to supplement the SLA/PrV microarray with the Qiagen-NRSP8 microarray. The sensitivity of each micro-array differed according to the nature of the probes (70-mer oligonucleotides versus DNA/cDNA) as shown by comparative studies [26]. Seventy-mer oligonucleotides give better results in terms of specificity and sensitivity compared to cDNA microarrays and this could explain some discrepancies observed between both microarrays in particular for the TAP1 gene [27] as confirmed in our
study. With this integrated approach, a parallel increase in the number of differentially expressed PrV and cellular genes was detected illustrating the viral and cellular tran-script modifications during infection.
A picture of PrV gene transcription during PK15 cell line infection
In our experimental conditions, we obtain a picture of the global PrV gene transcription during the lytic cycle. PrV transcription was monitored in single cycle conditions using a high MOI that guarantees that more that 90% cells are infected. Despite the presence of nested transcription units in PrV preventing the design of probes specific of unique transcripts for some genes, we were, however, able to confidently report viral gene expression for probes spe-cific of unique viral transcripts and draw a general picture of PrV transcription during the time course of infection. As expected, the expression of most viral genes increased during infection. Our results show that a notable increase in transcript levels and in the number of differentially expressed viral probes, detected from 4 h pi, correlates
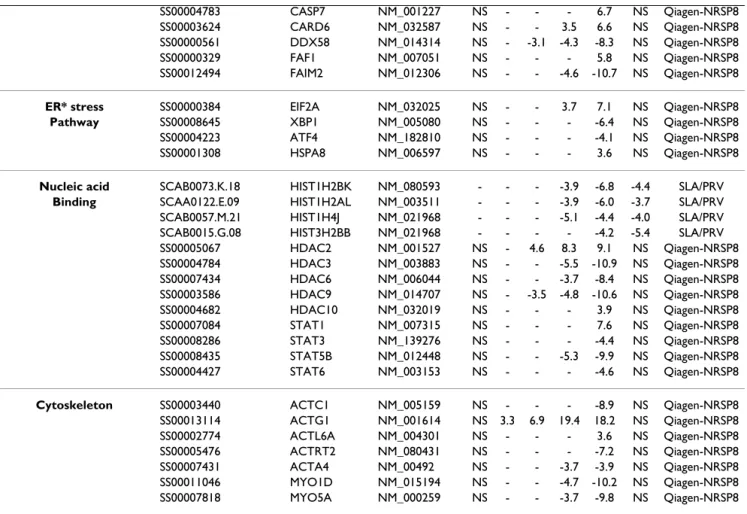
SS00004783 CASP7 NM_001227 NS - - - 6.7 NS Qiagen-NRSP8
SS00003624 CARD6 NM_032587 NS - - 3.5 6.6 NS Qiagen-NRSP8
SS00000561 DDX58 NM_014314 NS - -3.1 -4.3 -8.3 NS Qiagen-NRSP8
SS00000329 FAF1 NM_007051 NS - - - 5.8 NS Qiagen-NRSP8
SS00012494 FAIM2 NM_012306 NS - - -4.6 -10.7 NS Qiagen-NRSP8
ER* stress SS00000384 EIF2A NM_032025 NS - - 3.7 7.1 NS Qiagen-NRSP8
Pathway SS00008645 XBP1 NM_005080 NS - - - -6.4 NS Qiagen-NRSP8
SS00004223 ATF4 NM_182810 NS - - - -4.1 NS Qiagen-NRSP8
SS00001308 HSPA8 NM_006597 NS - - - 3.6 NS Qiagen-NRSP8
Nucleic acid SCAB0073.K.18 HIST1H2BK NM_080593 - - - -3.9 -6.8 -4.4 SLA/PRV
Binding SCAA0122.E.09 HIST1H2AL NM_003511 - - - -3.9 -6.0 -3.7 SLA/PRV
SCAB0057.M.21 HIST1H4J NM_021968 - - - -5.1 -4.4 -4.0 SLA/PRV
SCAB0015.G.08 HIST3H2BB NM_021968 - - - - -4.2 -5.4 SLA/PRV
SS00005067 HDAC2 NM_001527 NS - 4.6 8.3 9.1 NS Qiagen-NRSP8 SS00004784 HDAC3 NM_003883 NS - - -5.5 -10.9 NS Qiagen-NRSP8 SS00007434 HDAC6 NM_006044 NS - - -3.7 -8.4 NS Qiagen-NRSP8 SS00003586 HDAC9 NM_014707 NS - -3.5 -4.8 -10.6 NS Qiagen-NRSP8 SS00004682 HDAC10 NM_032019 NS - - - 3.9 NS Qiagen-NRSP8 SS00007084 STAT1 NM_007315 NS - - - 7.6 NS Qiagen-NRSP8 SS00008286 STAT3 NM_139276 NS - - - -4.4 NS Qiagen-NRSP8 SS00008435 STAT5B NM_012448 NS - - -5.3 -9.9 NS Qiagen-NRSP8 SS00004427 STAT6 NM_003153 NS - - - -4.6 NS Qiagen-NRSP8
Cytoskeleton SS00003440 ACTC1 NM_005159 NS - - - -8.9 NS Qiagen-NRSP8
SS00013114 ACTG1 NM_001614 NS 3.3 6.9 19.4 18.2 NS Qiagen-NRSP8 SS00002774 ACTL6A NM_004301 NS - - - 3.6 NS Qiagen-NRSP8 SS00005476 ACTRT2 NM_080431 NS - - - -7.2 NS Qiagen-NRSP8 SS00007431 ACTA4 NM_00492 NS - - -3.7 -3.9 NS Qiagen-NRSP8 SS00011046 MYO1D NM_015194 NS - - -4.7 -10.2 NS Qiagen-NRSP8 SS00007818 MYO5A NM_000259 NS - - -3.7 -9.8 NS Qiagen-NRSP8
* ER: Endoplasmic Reticulum NS: Not Studied
-: not differentially express
with viral growth and thus coincides with the beginning of the release of extracellular progeny (see Figure 2, Figure 3, Table 1 and Table 2). It has already been reported that the beginning of viral progeny usually occurs between 4 and 5 h pi but without any description of the global viral transcription [1]. We observe a continuous increase in
transcript levels and in the number of differentially expressed viral probes between 4 and 8 h pi followed by a stabilization when virion production is maximum. This suggests that the transcriptional machinery is fully active at 8 h pi thus permitting a massive virion production. All the different classes of viral transcripts are represented
SLA I cell surface decrease on PrV infected PK15 cells
Figure 5
SLA I cell surface decrease on PrV infected PK15 cells. Histogram overlays of MHC class I expression detected by the
mAb PT85A are shown. The number in red represents the percent mean fluorescence intensity [(mean channel fluorescence of the infected sample at 8 h pi/mean channel fluorescence of the mock-infected cells at 8 h pi) × 100]. The results represent one of three representative experiments.
Relativ e cell n u m ber Fluorescence intensity Control 8h pi (51.7%) 8h post-MI(100%) 0h post-MI 0h pi Table 6: Cellular gene expression study by qRT-PCR.
Change (n-fold)
Gene MI*_T12/MI*_T0 I**_T0/MI*_T0 I*_T2/MI**_T0 I**_T4/MI*_T0 I**_T8/MI*_T0 I**_T12/MI*_T0
TNF 1.6 2.3 2.6 14.7 14.5 10.5 PPIA 1.2 1.1 0.7 0.2 0.1 0.1 SLA Ia 0.7 0.9 - - 0.6 0.5 TAP1 - - - - 0.8 0.6 TAP2 1.2 1.2 1.0 0.8 0.5 0.4 PSMB9 0.8 0.6 0.6 0.7 0.3 0.3 PSMB8 - 0.6 0.7 0.6 0.3 0.2
- - no detected difference between two samples - *: mock-infected
from 4 h pi (non structural, capsid, tegument and enve-lope protein transcripts). The molecular hallmark of her-pesvirus infection is a temporally ordered gene transcription. As for other herpesviruses, the PrV genes are subdivided in three main classes of successively expressed transcripts: immediate early, early and late transcripts [1]. After binding of the viral particle and fusion of the virion envelope with the cell membrane, the release of capsid and tegument proteins into the cell and the takeover of host cell protein synthesis machinery, the IE180 protein encoded by the immediate early gene is expressed in the cytoplasm and translocated to the nucleus. This protein can further transactivate the RNA polymerase II mediated transcription of early genes including transactivators of transcription (EP0, US1, UL54) and proteins essential for viral replication (UL5, UL8, UL9, UL29, UL30, UL42, UL52, UL28, UL39, UL40, UL23, UL50, UL12, UL2) [1]. The expression of IE180 has been reported to begin between 40 min and 1 h pi and last until 3 h pi [1]. In our experiment, the IE180 probe (IEP2) was differentially expressed only at 4 h pi, when the transcript level proba-bly reaches its peak value. This suggests that a low level of IE180 transcripts is sufficient to induce the transcription of early genes. In this experiment, the differential expres-sion of US1 and UL29 was detected as early as 1 h pi but other early genes appeared differentially expressed later. Interestingly, the UL49.5 probe corresponding to the gN protein, responsible for TAP inhibition, was differentially expressed at 1 h pi, even if this gene is not described as an early gene. The synthesis of late proteins, such as capsid (UL6, UL18, UL19, UL25, UL35 and UL38), tegument (UL11, UL13, UL16, UL21, UL36, UL37, UL37, UL41, UL46, UL47, UL48, UL49, UL51, US3, US2) and envelope proteins (gE, gI, gD, gM, gH, gC, gB, gN, gK) are reported to occur during the PrV replication cycle [1]. In our study, the two late transcripts UL6 and UL22 encoding the gH protein were differentially expressed as early as 2 h pi. The four latest differentially expressed genes mostly encoded envelope or tegument proteins, except UL9.
We described for the first time a global analysis of PrV gene transcription using a microarray. The results of our analysis is consistent with what is known about PrV viral cycle and with the kinetic classification of individual tran-scripts [1]. Similar approaches have been developed for other alphaherpesviruses such as HSV-1 [28,29] and Vari-cella-Zoster virus (VZV) [28,29]. It is difficult to compare our results with those obtained in the VZV study because this viral system does not allow cell infection under single cycle synchronized conditions (one limitation of this viral system), which is required to establish reliable kinetics of viral gene expression. However our results are consistent with the transcriptomic study reported for HSV-1 [28,29]. It is clear from figure 3 that PrV early homologues of HSV-1 immediate early genes (EP0, UL54, USHSV-1) and early
genes (UL23 encoding thymidine kinase, UL30 encoding a DNA polymerase subunit, UL39 encoding the large sub-unit of ribonucleotide reductase) are expressed at early times before most of the late genes encoding structural proteins. A clear distinction between immediate early, early and late genes for PrV will require transcriptomic analysis in the presence of the translation inhibitor cycloheximide (to identify immediate early genes) or the viral DNA replication inhibitor phosphonoacetic acid (to distinguish early and late genes) as was done for HSV-1 [28,29].
PrV and cellular shutoff
A cellular shutoff during infection has been described for herpesviruses including PrV [1]. In our experiment, a shut-off of PK15 genes is observed during infection since many cellular genes are down-regulated between 4 and 12 h pi. In contrast, at the 4 h time point, 42.5 % of the viral genes are up-regulated. Our transcriptomic analyses reveal that the shutoff occurs in porcine cells earlier than that previ-ously reported in other transcriptome studies i.e. between 8 and 12 h pi in rat embryonic fibroblasts and from 6 h pi in human embryonic kidney cells [12,14]. It is assumed that the virion host shutoff protein (vhs/UL41 transcript) causes cellular shutoff. The vhs protein is an RNAse located in the viral tegument, which degrades host and viral RNA just after infection for 1 [30]. Unlike HSV-1, it has been suggested that for cellular shutoff, PrV requires a fresh round of viral protein synthesis explaining the observed delayed shutoff [9]. In our experiment, UL41 transcripts appear to be differentially expressed only at 8 h pi suggesting that the vhs activity can be attributed to the newly synthesized proteins and not to the vhs proteins present in the virion tegument at the moment of infection and that the vhs protein should be active at low level. The activity of HSV-1 vhs is modulated by the UL48 product (VP16), which can bind to vhs to allow viral mRNA accu-mulation [31]. However, our study does not show any dif-ferential expression of the UL48 transcript.
PrV infection and immune evasion strategies
To evade host response PrV develops several strategies that probably disturb different biological pathways including the MHC class I presentation pathway. We observed a decrease of SLA-Ia and TAP2 transcript levels in PK15 cells infected with the PrV NIA3 strain as previously reported in infected PK15 and bovine kidney cells respectively (IND-F PrV strain) [9]. A down-regulation of TAP1 and TAP2 genes encoding immunoproteasome catalytic subunits, PSMB8 and PSMB9, involved in the MHC class I antigenic presentation pathway was also detected in our experi-ment. Moreover, we checked that at 8 h pi the PK15 cells expressed 50% less MHC class I proteins than mock-infected cells in our culture conditions. These results con-firm previous reports describing the reduced capacity of
infected cells to present viral peptides to CTL [6,7]. The viral gene UL49.5, encoding the gN protein, is one of the earliest differentially expressed genes in our study (from 1 h pi). This viral protein has been shown to inhibit TAP activity and induce degradation of TAP molecules by the proteasome [5,8,32]. Our results strongly suggest a very early production of gN protein and agree with the detec-tion of TAP inhibidetec-tion from 2 h pi [7]. This TAP inhibidetec-tion has been shown to be independent of vhs activity [9] and we demonstrate here that UL41 encoding vhs is differen-tially expressed later than UL49.5, indicating two succes-sive steps i.e. TAP inhibition followed by cellular shutoff. Since the level of several transcripts involved in the MHC class I presentation pathway (MHC class Ia, TAP1, TAP2, PSMB8 and PSMB9) decreased, it is possible that PrV has developed complementary strategies to evade this path-way i.e. turning off the peptide pump with inhibition of TAP activity and transcription alteration of key players [5]. Other viruses, such as the human cytomegalovirus, down-regulate the transcription of key players of the MHC class I antigen presentation pathway [5]. Unexpectedly, some MHC class II genes were also regulated during PrV infec-tion in PK15 cells. In particular, a down-regulainfec-tion of class II-like chaperones SLA-DOB and SLA-DMB was observed. MHC class II molecules that are constitutively expressed on professional antigen presenting cells (APCs), present peptides derived from exogenous antigens to CD4+ T-helper cells playing an important role in the induction and maintenance of CTL immunity. Epithelial cells can also constitutively express MHC II molecules but at a lower level than professional APCs [33]. In our exper-iment, we detected a small subpopulation of uninfected PK15 cells constitutively expressing MHC class II mole-cules. However, we did not detect modifications of the MHC class II expression at the cell surface. Since a down-regulation of constitutive and IFNγ induced HLA class II expression has been observed in cells infected by other herpesviruses [33], our preliminary data suggest that it would be highly relevant to explore how PrV may interfere with the MHC class II presentation pathway in profes-sional APCs.
In addition to genes belonging to MHC antigen presenta-tion pathways, several other genes, playing a role in anti-viral response are regulated during PrV infection such as genes belonging to the IFN signaling pathway. Indeed, it has been reported that in primary rat fibroblasts, PrV infection could suppress the establishment of the IFNβ-induced viral state [13]. IRF3, which is a transcriptional factor involved in IFNβ production by epithelial cells, is down-regulated together with a set of other IRF. Constitu-tively expressed in the cytosol, IRF3 is phosphorylated during herpesvirus infection and translocated into the nucleus to target the IFNβ promoter. Many viruses inter-fere with IRF activities [34]. A decrease of IRF1 mRNA and
protein levels has also been detected in cells infected with hepatitis C virus, resulting in the transcriptional repres-sion of several IFN-stimulated genes [35]. In addition, TNF-alpha, which is a multifunctional cytokine with potent antiviral activities and which mediates protection against HSV-1 in the mouse [36] was analyzed by qRT-PCR. A strong up-regulation of TNF was detected from the beginning of PrV infection and until 12 h pi. These results suggest that the TNF transcription increase that is usually expected during an infection is not suppressed by PrV infection and that the cellular shutoff does not target TNF.
Other cellular pathways modulated during PrV infection
Our transcriptome analysis confirms that many other bio-logical processes and functions are modulated during PrV infection in porcine PK15 cells as previously observed in rat embryonic fibroblast and human embryonic kidney cells [12,14]. We have focused our study on a limited number of pathways and genes. Interestingly, we observe both by transcriptome analysis and qRT-PCR that PPIA gene expression is clearly down-regulated during PrV infection. PPIA encodes cyclophilin A, a peptidyl-prolyl isomerase, which catalyzes the isomerization of peptide bonds from the trans to cis form at proline residues and facilitates protein folding [37] and which acts as a cytosolic molecular chaperone. Cyclophilins have been discovered because of their high affinity for cyclosporine, an immuno-suppressive drug, which prevents allograft rejection. This immunosuppressive effect is due to the cal-cineurin inhibition by a cyclosporin-cyclophilin complex. Calcineurin is required for transcriptional activation of many cytokines in stimulated T cells. Cyclophilin A can also interact with HIV-1 Gag polyprotein and is involved in HIV-1 replication kinetics and modifies the infectivity of HIV-1 virions in Jurkat T cells [38]. Indeed, virions pro-duced by PPIA-/- cells are less infectious than virions
pro-duced by PPIA+/+ cells. Since we observed a
down-regulation of PPIA before the global cellular shutoff, cyclophilin A may be a target for PrV and play a role in infection via an unknown mechanism.
Several cellular genes involved in apoptosis were regu-lated during PrV infection such as BCl-2 molecules and caspases. Viral infection of mammalian cells tends to gen-erate proapoptotic signals to limit viral replication but viruses and, in particular, herpesviruses produce mole-cules acting as modulators of apoptosis [1]. Thus, US3 products from PrV play an anti-apoptotic role [39]. The PIKNIA3 probe specific to US3 long and short isoform transcripts was up-regulated from 8 h pi in our experi-ment, suggesting a possible late antiapoptotic role of the US3 products. In addition, PrV genes homologous to other HSV-1 antiapoptotic genes may also possess an antiapoptotic role such as UL54 or US1 [1]. UL54 was not