HAL Id: hal-00746946
https://hal.archives-ouvertes.fr/hal-00746946
Submitted on 30 Oct 2012HAL is a multi-disciplinary open access archive for the deposit and dissemination of sci-entific research documents, whether they are pub-lished or not. The documents may come from teaching and research institutions in France or abroad, or from public or private research centers.
L’archive ouverte pluridisciplinaire HAL, est destinée au dépôt et à la diffusion de documents scientifiques de niveau recherche, publiés ou non, émanant des établissements d’enseignement et de recherche français ou étrangers, des laboratoires publics ou privés.
Cecile Miege, A. Roy, P. Labadie, H. Budzinski, B. Le Bizec, K. Vorkamp, J.
Tronczynski, H. Persat, Marina Coquery, M. Babut
To cite this version:
Cecile Miege, A. Roy, P. Labadie, H. Budzinski, B. Le Bizec, et al.. Occurrence of priority and emerging organic compounds in fishes from the Rhone River (France). Analytical and Bioanalytical Chemistry, Springer Verlag, 2012, 404 (9), p. 2721 - p. 2735. �10.1007/s00216-012-6187-0�. �hal-00746946�
Occurrence of priority and emerging organic compounds in fishes from the Rhone River (France)
C. Miège1*, A. Roy1, P. Labadie2**, H. Budzinski3, B. Le Bizec4, K. Vorkamp5, J. Tronczyński6, H. Persat7, M. Coquery1, M. Babut1
1
: Irstea, U.R. MALY, 3bis quai Chauveau, Cedex 09, 69336 Lyon, France 2
: CNRS/UPMC, UMR 7619 Sisyphe, BP 105, 4 place Jussieu, 75252 Paris Cedex 05, France 3
: University of Bordeaux 1, EPOC-LPTC laboratory, 351 cours de la Libération, 33405 Talence, France
4
: LABERCA, USC 2013, ONIRIS Atlanpôle, Site de la Chantrerie, BP 50707 44307 NANTES Cedex 3, France
5
: Aarhus University, Department of Environmental Science, Frederiksborgvej 399, 4000 Roskilde, Denmark
6
: IFREMER, dpt Biogeochemistry and Ecotoxicology, Laboratory of Organic Contaminants Biogeochemistry, (DCN/BE/LBCO), rue de l'Ile d'Yeu, BP 21105, 44311 Nantes, Cedex 03, France
7
: University of Lyon 1, UMR CNRS 5023, Ecology of Fluvial Hydrosystems, Bâtiment Forel, 69622 Villeurbanne Cedex, France
*
corresponding author, cecile.miege@irstea.fr
**
current address: University of Bordeaux 1, EPOC-LPTC laboratory, 351 cours de la Libération, 33405 Talence, France
Summary
The main objective of this study was to collect new data on the occurrence and levels of priority and emerging organic compounds in freshwater fishes sampled in the Rhone River. The 34 studied contaminants included alkylphenols (AP), bisphenol A (BPA), polybromodiphenylethers (PBDE), perfluorinated compounds (PFC), hexabromocyclododecanes (HBCD), hexachloro-benzene (HCB) and hexachloro-butadiene (HCBD). About 50 fish samples (individual specimens or pooled fishes) were collected from 3 sites located upstream and downstream of the Lyon metropolitan area in the Rhone River (France). Four species were caught at each site, namely: the barbel (Barbus barbus), the common bream (Abramis brama), the white bream (Blicca bjoerkna) and the chub (Squalius cephalus).
Some contaminants were quantified in all the 32 fish samples analysed: 4-nonylphenol, α -HBCD, the 6 PBDE congeners (28, 47, 99, 100, 153, 154), perfluorooctanesulfonate (PFOS) and perfluorodecanoic acid. And 23 of the 32 samples had concentration of PFOS above the Environmental Quality Standards (up to 6 times higher the EQS); and all the 32 samples had concentrations of PBDE above the EQS (up to 4000 times higher, with the sum of 6 PBDE varying from 4.5 to 182 ng/g dw). Clearly, the interest to consider PFOS and HBCD as new priority substances is confirmed. In contrast, the pertinence of a priority status for HCBD, which was never quantified in our study, might have to be reconsidered in the future.
Keywords: emerging compounds, priority compounds, fishes, river waters, contamination level
The European Commission (EC) daughter Directive 2008/105/EC and the recent proposal for a Directive 2011/0429/EC [1, 2] detail the application of the Water Framework Directive (WFD) 2000/60/EC [3] for the monitoring of priority substances and other pollutants, including new emerging substances, in surface waters; in particular, it requires the implementation of temporal and spatial trend monitoring programs. The use of integrative matrices (biota and sediments) is strongly recommended to achieve such objectives for hydrophobic substances. Indeed, water is not a suitable matrix for environmental monitoring of hydrophobic compounds (i.e., with logKow >3), since their concentrations in water are very low and often below limits of quantification (LQ), except for highly polluted systems. For example, surface water monitoring under the WFD conducted by the French water agency Loire-Bretagne between April 2008 and January 2009 lead to only 1% of results above the LQ, for about 22,000 analyses of priority substances performed in waters [4].
The list of priority substances of the WFD includes several substances which have a low solubility in water, a corresponding high log Kow and a high potential for bioaccumulation and bioconcentration. Out of the 33 priority substances (or groups of substances), the 8 other pollutants of the Daughter Directive 2008/105/EC [1], and the 15 new substances of the recent proposal of the European Community [2], a majority have a log Kow> 3 and thus should preferably be monitored in biota or sediments.
Compared to water matrices, sediments and biota are more representative of these substances since they allow integrating water contamination over time (several months for biota and several years for sediments). Sampling can be performed at a lower frequency to be representative. Their analyses are generally easier since contaminant concentrations are higher than in water.
In this study, 34 individual hydrophobic anthropogenic compounds were selected for analysis in fish samples, including 5 alkylphenols (AP), bisphenol A (BPA), 3 hexabromocyclododecanes (HBCD), 9 polybromodiphenylethers (PBDE), 14 perfluorinated compounds (PFC), hexachlorobenzene (HCB) and hexachlorobutadiene (HCBD). For some of these compounds, Environmental Quality Standards (EQS) have been proposed for biota (with values at 10, 55, 167, 9.1 and 8.5x10⁻³ ng/g fresh weight –fw- respectively for HCB, HCBD, HBCD, PFOS and sum of BDE28, 47, 99, 100, 153, 154) [1, 2]. Among these compounds, 2 AP (4tertoctylphenol, 4nonylphenol), 6 PBDE (BDE28, 47, 99, 100, -153, -154), HCB and HCBD are priority substances listed in Annex II of the Daughter Directive 2008/105/EC; and 1 PFC (perfluorooctane sulfonate, PFOS) and BPA are optional substances listed in Annex III of the same directive. HBCD (isomers α, β and γ) were recently proposed as priority substances in Annex I of the proposal Directive 2011/0429/EC [2]. PBDE are also part of US EPA priority lists; and PFC, HBCD and PBDE are on the OSPAR list of chemicals for priority action.
These 34 organic compounds, priority and emerging, were chosen because they have been widely used, their occurrence has been shown in aquatic systems but is not widely documented for all of them, and because of their toxicity, as summarized thereafter:
- AP have been extensively used as precursors to detergents, as additives for fuels and lubricants, polymers, and as components in phenolic resins. Their use has not been banned but drastically restricted in Europe and USA in particular by their replacement with ethoxylate alcohols in detergents [5]. AP (4-tert-octylphenol, 4-nonylphenol, 4-nonylphenoxyacetic acid and 4-nonylphenol-diethoxylate) have strong oestrogenic effects, they are able to stimulate
vitellogenin gene expression in trout hepatocytes, gene transcription in transfected cells and the growth of breast cancer cell lines [6]. BPA is used primarily as a component of plastics for a variety of common products including baby and water bottles, sports equipment, medical and dental devices, eyeglass lenses, CDs and DVDs, and household electronics. Epoxy resins containing BPA have been used as coatings on the inside of almost all food and beverage cans. In the European Union, BPA use is now banned in baby bottles and its use is restricted [7]. BPA is suspected to induce biochemical changes in brain, immune-modulatory effects and enhanced susceptibility to breast tumours [8].
- HBCD is a flame retardant mainly added to polystyrene foam used as thermal insulation in the construction industry, and to textiles, upholstery, packaging material, and electric and electronic equipment. Commercial mixtures consist of the stereoisomers γ-HBCD (75 to 89%), α-HBCD (10 to 13%), β-HBCD (1 to 12%), δ-HBCD and ε-HBCD (less than 1%) [9, 10]. At present, HBCD is not regulated, but voluntary emission control has been reported in Europe, as well as discontinuation of the UK production [11]. Furthermore, the Stockholm Convention’s Persistent Organic Pollutants (POP) Review Committee has suggested adding HBCD to the Stockholm Convention on POPs, with the aim of a possible ban. With a logKOW value of 5.6, technical HBCD has a high bioaccumulative potential and there are indications of biomagnification comparable with or even exceeding that of BDE-47 [12]. Toxicity information of HBCD is still very limited, but neurobehavioral alterations have been found in mice following neonatal exposure to HBCD [13]. This was supported by a recent epidemiological study showing that PBDE and HBCD levels during pregnancy were correlated with motor, cognitive and behavioral outcomes at five-six years old children, including positive and negative associations [14]. In vitro studies have indicated that HBCD induced cancer via a non-mutagenic mechanism, similarly to PCB and DDT [15].
- HCB is a fungicide formerly used as a seed treatment, especially on wheat to control the fungal disease bunt. Since 2001, its use has been severely restricted under the Stockholm Convention on POPs [16]. As summarised by AMAP (2004), HCB can be fetotoxic, teratogenic and carcinogenic. It is an immunosuppressor, can affect reproduction and induce porphyria [17]. Studies on freshwater fish have shown correlations with estrogenic activity, oxidative stress and contributions to serological alterations [18, 19]. The potential for HCB-related sediment toxicity to benthic invertebrates was considered low [20]. Humans are mainly exposed to HCB through food, but current dietary intake of HCB was not considered to lead to significant health risks in a Catalonian study [21]. HCBD has been most commonly used as a solvent for other chlorine-containing compounds in the production of rubber and other polymers. It has also been used in hydraulic and heat transfer fluids, as a seed dressing and fungicide in agriculture and in a number of manufacturing processes such as production of aluminium and graphite rods. Today, HCBD has been phased out in most of these applications, but can also be formed as a by-product in chemical industrial processes. It is regarded as a priority hazardous compound under the WFD, for which emissions should be phased out by 2020. An overview of the legal status in different countries is given by van der Honing [22]. Toxicity information is scarce, but HCBD has been described as moderately to very toxic to aquatic organisms [23]. According to a risk assessment by the chlor-alkali industry, HBCD levels in marine surface waters do not present an unacceptable risk to the environment of the North Sea, neither to fish or fish-eating birds and mammals [24]. These findings are supported by a Canadian risk assessment of HCBD which indicated little or no risk to pelagic aquatic organisms. However, HCBD could pose a risk to benthic organisms in areas of high sediment contamination, e.g., near point sources [25].
- PBDE have been used as flame retardants in a wide array of products, including building materials, electronics, furnishings, motor vehicles, airplanes, plastics, polyurethane foams, and textiles. The use of penta and octaBDE has been banned in Europe since 2004 and they were added to the Stockholm Convention on POPs in 2009. The third technical product, decaBDE (BDE-209), is not part of the Stockholm Convention, but has been severely restricted in the EU for use in electrical and electronic equipment [26]. PBDE present structural similarities with thyroid hormones and, thus, one of the main concerns regarding their toxicity is their potential as thyroid hormone agonists. PBDE are suspected to induce a disruption of the thyroid hormone function in humans and wildlife, leading to changes in metabolic rates, protein synthesis, and cell development [9, 27].
- PFC have unique properties to make materials stain, oil, and water resistant, and have been widely used in diverse applications: to make fluoropolymers such as Teflon and in the semiconductor industry. Perfluorooctanoic acid (PFOA) and perfluorooctanesulfonate (PFOS) have been included on the POP list of the Stockholm Convention since 2009 [28]. The use of PFOS has been restricted in the USA and Europe since 2007, its use is planned to be banned in 2011 [29]. PFC are ubiquitous in the environment [30] and have a high biomagnification potential in the food chain [31]. PFC, e.g., PFOA and PFOS, have been demonstrated carcinogenic in animals with liver damages [32], as well as on the thyroid gland. They are also considered as endocrine disruptor compounds (EDCs), altering reproductive functions [33] and were found toxic for immune system [34].
Best to our knowledge, no information is available to date on the occurrence of most of these compounds in freshwater fish in France. As it is presented in the discussion part, data on these compounds exist from a few studies conducted in other countries; but, in general, comparisons with literature data are difficult as species, tissues and compounds vary and results are not always reported in a directly comparable way. It appears that better harmonization is needed for monitoring schemes on freshwater fish contamination by organic emerging and more classic pollutants. It may also include a choice of a common species for such surveys and assessments.
The objective of this paper is to present new data on the occurrence and levels of contamination of 34 priority and emerging organic compounds in 49 fish samples (individual or pooled fishes) that represent 4 fish species, the barbel (Barbus barbus), the common bream (Abramis brama), the white bream (Blicca bjoerkna) and the chub (Squalius cephalus), collected in the Rhone River near the area of Lyon, France. Results are focused on comparison of levels of concentration per compound and per fish species. The choice of better species for contamination assessment and monitoring is also highlighted. Lastly, we discuss the pertinence of priorization for some of the studied substances.
II. Experimental section
II.1. Sampling and analysis strategy
Fishes were captured from August 2008 to January 2009 at 3 sites in the Rhone River near Lyon (France). The overall metropolitan area of Lyon is characterized by a population of 2,118,132 and a large number of chemical plants located along the Rhone river downstream Lyon. Two sites are located upstream Lyon (at the Northeast) and one site downstream Lyon (at the South) (Figure 1). The upper Rhone site (upS1), is an abandoned stream channel named La Morte (45°42'5.71"N, 5°33'14.58"E), and most likely constitutes a good reference
site for determining low contamination levels. This stream is indeed located along the less industrialized area of the Rhone River. The second site (upS2), is located in the Grand Large (45° 46' 56,61'' N, 4° 58' 30,31'' E) under influence of industrial zone and the Bourbre River confluence, and represents "urban-upstream" Lyon area. The third site (downS3) at the Ile du Beurre (45°28'35.00"N, 4°46'55.46"E) is an arm of the Rhone representing the downstream of Lyon and its chemical industries area.
Information on sampling and analytical strategy is reported in Table 1. The 4 freshwater fish species studied, namely the barbel (Barbus barbus), the common bream (Abramis brama), the white bream (Blicca bjoerkna) and the chub (Squalius cephalus), were chosen because they are sedentary, they may reach a large size and are long-lived species, but they have different diets and exploit different habitats. Adult specimens of all 4 species were captured with nets or electric fishing. At each site, 2 to 4 pools of 1 to 6 fishes of the same species were made with individual fish of similar size and weight; except no white bream could be found at upS1. Chemical analyses were conducted on pooled fish samples and also on some individual fish samples in order to check the inter-individual concentrations of pooled samples. A total of 26 pools and 23 individual fish samples were analysed (49 fish samples). Information on size, weight, sex, percentage of lipids and moisture of the 49 fish samples are detailed in Table 1.
Immediately after collection, fishes were stored at about 4°C and transported to the laboratory. All of the material (e.g., glassware, knives) used for dissection and storage was washed at 50°C with detergents and acetic acid 20% (v/v), and rinsed with acetone (Pestipur grade) and Milli-Q water (Millipore). Fish fillets were prepared according to the European guideline [35], which includes removing all the muscular part of fishes, scraping and keeping the body fat under skin and freezing fish fillets at -20°C. Then, fillets were freeze-dried using a freeze dryer Christ ALPHA 1-4 LD and homogenized. Samples were stored into glass bottles with polypropylene caps and dispatched for analysis.
II.2. Chemicals
Standards of 4-tert-octylphenol (4-t-OP; 99.4% purity) and bisphenol A (BPA; 99% purity) were purchased from Sigma Aldrich (Saint Quentin Fallavier, France); standards of 4-nonylphenoxyacetic acid (4-NP1EC; 98% purity), 4-nonylphenol (4-NP, commercial mixture 100%), 4-nonylphenol-monoethoxylate (4-NP1EO; 99% purity), 4-nonylphenol-diethoxylate (4-NP2EO; 99% purity) were purchased from Cluzeau Info Labo (St Foy La Grande, France). Internal standards were linear forms of AP and labeled compounds : unlabeled p-n-nonylphenol (98%+, p-n-NP), 13C6-p-n-nonylphenol (99%+, p-n-NP-13C6), 2 H-4-n-nonylphenol (98%+, 4-n-NP-d8), 2H-4-n-nonylphenol monoethoxylate (97.5%+, 4-n-NP1 EO-d2), 2H-4-n-nonylphenoxyacetic acid (98.7%+, 4-n-NP1EC-D2) were purchased from Cluzeau Info Labo (St Foy La Grande, France); octylphenol-3,5-D2 (97.7%+, 3,5-OP-d2) and bisphenol A-d16 (98%+, BPA-d16) were purchased from Sigma Aldrich (Saint Quentin Fallavier, France).
13
C12-labelled and native standards of the isomers α-, β- and γ-HBCD were purchased from Cambridge Isotope Laboratories. All compounds were provided at a concentration of 50 µg/ml in toluene. Purity was 98% for native γ-HBCD and 99% for all other compounds. Standards of HCB and HCBD and internal standards decachlorobiphenyl and phenanthrene d10, in powder, were obtained from Cluzeau Info Labo.
Mixed native PBDE standard solutions were purchased from Wellington Laboratories (via BCP Instruments, Irigny, France): BDE 28, 47, 99 and 100, each at 1 ng/µL, BDE153, -154, -183 and -205, each at 2 ng/µL, and BDE-209 at 5 ng/µL in nonane/toluene. 13C12 -BDE-47, 13C12-BDE-153, BDE-181 (each at 50 ng/µL in nonane) and 13C12-BDE-209 (50 ng/µL in toluene) were used as internal standards (IS) and were also obtained from Wellington Laboratories. A working solution was prepared in toluene, containing each IS at 0.5 ng/µL, except 13C12-BDE-209: 1.25 ng/µL. BDE-77 (Sigma-Aldrich, St Quentin Fallavier, France) and bromobiphenyl-209 (BB-209, Wellington Laboratories) were used as syringe standard to determine IS recoveries.
Standards of the following PFC were purchased from Wellington Laboratories (Guelph, Ontario, Canada): perfluorobutanoic acid (PFBA); perfluoropentanoic acid (PFPA); perfluorohexanoic acid (PFHxA); perfluoroheptanoic acid (PFHpA); perfluorooctanoic acid (PFOA); perfluorononanoic acid (PFNA); perfluorodecanoic acid (PFDA); perfluoroundecanoic acid (PFUnA); perfluorododecanoic acid (PFDoA); perfluorobutanesulfonate potassium (PFBS); perfluorohexanesulfonate potassium (PFHxS); perfluoroheptanesulfonate potassium (PFHpS); perfluorooctanesulfonate potassium (PFOS); perfluorodecanesulfonate potassium (PFDS). Working solutions of PFC at 0.1 and 0.01 ng/µL and a mix of ten 13C-labelled internal standards (IS) at 0.01 ng/µL were prepared by appropriate dilutions of commercial standards in methanol (Picograde® quality, LGC Promochem (Wesel, Germany)). The calibration curve included 10 points covering a range from 0.0 to 1000 µg kg-1. The same amount of the mix of internal standards was added to every standard solution and sample.
II.3. Analytical methods for alkylphenols and bisphenol A
The alkylphenols and the bisphenol A were analysed by EPOC-LPTC laboratory using a method adapted from the one described by Cailleaud et al. [5]. 0.2 g of freeze-dried samples was extracted by Focused Microwave-Assisted Extraction (10 min at 30 W) with dichloromethane (30 ml). Internal standards were gravimetrically added prior to the extraction. The organic extracts were concentrated up to 1 ml using a vacuum evaporation system (RapidVap, Labconco, Fisher Scientific). The extracts were then purified using disposable 3 ml HF-PSA® (Bondelut, 500 mg, HF-PSA®, Varian). The cartridges were conditioned with 3ml of methanol and 3ml of a mixture of methanol/dichloromethane (80/20; v/v). After loading the extracts, HF-PSA® cartridges were eluted with 10 ml of a mixture of methanol/dichloromethane (80/20; v/v). The final eluates were evaporated to dryness with a gentle stream of nitrogen and reconstituted with methanol to a final volume of 100 µl.
The analysis was performed by liquid chromatography coupled to tandem mass spectrometry (LC-MS/MS); acquisition was achieved in Multiple Reaction Monitoring (MRM) mode using an UPLC-Quattro Premier Waters (Saint Quentin en Yvelines, France) with electrospray ionization. The UPLC separation was achieved with 1.7 µm, 50 mm length x 2.1mm i.d. C18 reversed phase column (Acquity UPLC BEH C18; Waters, Saint Quentin en Yvelines, France). BPA, 4-NP, 4-t-OP and NP1EC were quantified in negative ionization mode and NP1EO and NP2EO in positive ionization mode. The tandem mass spectroscopy conditions included the use of 2 ionization transitions for each compound one for the quantification (QT) and one for the identity confirmation (CT).
The samples were extracted and analysed in batches together with a procedural blank and duplicate analyses of an internal reference material (eel muscle) as well as of a spiked sample (reference tissues spiked at 100 ng/g dw basis for each compound). The compounds were quantified according to the corresponding internal standards added prior to the extraction. Response factors were calculated using standard solutions operated in the same run as the samples. Independent other solutions of standards were analysed in parallel, using the calculated response factor, to check the accuracy of the analysis and to calculate analytical recoveries (they ranged between 95 and 100% for each compound). Solvent blanks were injected between each sample to prevent contamination and to check the cleanliness of the analytical system (this is particularly important for 4-NP and BPA which are frequently subjected to problems of blanks and cross contamination).
Uncertainties of quantification were below 15% for all the compounds and recoveries of the global protocol was between 80% and 115%, based on 10 samples of spiked fish tissue (spiked concentration 100 ng/g dw) analysed in 5 batches of samples. For those compounds that were not detected in procedural blanks, the LQ were determined as the concentration with a signal to noise ratio of 9 in non spiked fish muscle extracts. 4-NP and BPA were detected in blanks, so the levels for these compounds were blank corrected and the LQ was derived from the blank value variability. The LQ ranged from 10 to 15 ng/g dw.
II.4. Analytical methods for HBCD
The 3 HBCD isomers were analysed by Aarhus University (Department of Environmental Science) based on the methods described by Frederiksen et al., [36] and Vorkamp et al., [37]. Five g of dried fish was Soxhlet extracted with hexane/acetone, 4/1, v/v. A clean-up of the extract was performed on a multilayer column consisting of aluminum oxide, silica, H2SO4 -impregnated silica and sodium sulfate. The compounds were eluted with hexane/dichloromethane, 1/1, v/v, evaporated to dryness and redissolved in 500 µl methanol. The analysis was performed by high performance liquid chromatography (Agilent 1100 series) coupled to tandem mass spectrometry (Sciex, Concorde, Ontario, Canada) with electrospray ionisation (LC-ESI-MS-MS). Chromatographic separation was achieved on Zorbax 15 cm C18-column (Agilent Technologies, Santa Clara, CA, USA).
13
C-labelled compounds of the 3 stereoisomers were used as internal standards added to all samples before extraction. The samples were extracted and analysed in batches together with a procedural blank and duplicate analyses of an internal reference material (sand eel oil). For each batch, 1-2 samples were randomly chosen and analysed in duplicate. Quantification was based on a double 7 point calibration curve.
Uncertainty was 8.5%, 7.1% and 7.3% for α-, β- and γ-HBCD, respectively, based on 10 samples of spiked fish oil (final concentration 12-18 ng/g wet weight) analysed in 5 batches of samples. The LQ were set to the lowest calibration standard and were approximately 0.110-0.241 ng/g dw for the 3 HBCD-isomers.
II.5. Analytical methods for HCB and HCBD
HCB and HCBD were analysed by the laboratory of Rouen. Five g of dried fish were extracted by Accelerated Solvent Extractor method with the ASE 350 system, with a solvent mixture hexane/acetone, 50/50, v/v. A clean-up of the extract was performed on concentrated sulphuric acid. The analysis was performed by gas chromatography (Thermo Trace GC)
coupled to ECD (GC-ECD). Chromatographic separation was achieved on 60 m DB5 0.25 mm ; 0.25 µm column (Chromoptic). A double analysis was performed on 60 m DB1701 0.25 mm ; 0.25 µm column (Chromoptic).
Internal standard decachlorobiphenyl (PCB209) and phenanthrene d10 were added to the extracts before analysis. Three blanks treated as the sample were analysed in the same run (at the beginning, middle, end). Confirmation of analyte identity and of quantification was performed by GC/MS (Waters Quattro micro GC/MS/MS with an Agilent 6890 GC), on SIR mode, with a chromatographic separation on 30 m DB5 MS 0.25 mm, 0.25 µm column (Chromoptic).
Uncertainty was determined by internal control method based on the French XPT 90-220 standard [38] and ranged from 30 to 60 % at the LQ level. The LQ were determined as presupposed LQ method based on the French NF T 90-210 standard [39]; they were around 1 ng/g dw for HCB and 10 ng/g dw for HCBD.
II.6. Analytical methods for PBDE
The 9 PBDE were analysed by UMR 7619 Sisyphe laboratory as described elsewhere [40]. Briefly, 5 g of dried fish were extracted by sonication-assisted matrix solid phase dispersion with hexane/dichloromethane, 1/1, v/v. A clean-up of the extract was performed on a multilayer column consisting of H2SO4-impregnated silica, activated silica gel and neutral activated alumina (top to bottom). PBDE were eluted with hexane/dichloromethane, 8/2, v/v. The analysis was performed by gas chromatography (Agilent 7890A) coupled to a triple quadrupole mass spectrometer (Agilent 5975C) with electron ionisation (GC-MS/MS). Chromatographic separation was achieved on a 15m long HP-5MS column (Agilent).
For each analyte, the ratio of quantification transition area to confirmation transition area was compared to that obtained with an authentic standard (margin: 20%). Quantification was carried out by calculating the response factor of each analyte relative to its corresponding internal standard and concentrations were determined using a least-square linear regression analysis of the peak area ratio versus the concentration ratio.
Uncertainty was in the range 1.3–19.6%, based on 4 replicate analyses of spiked fish tissues (10–50 ng/g dry weight). For those compounds that were not detected in procedural blanks, the LQ were determined as the concentration with a signal to noise ratio of 9 in non spiked fish muscle extracts. BDE-28, BDE-47, BDE-99, BDE-100 and BDE-209 were detected in blanks, so, for these compounds, PBDE levels were blank corrected and the LQ was derived from the blank value variability [40]. The LQ ranged from 0.002 to 0.170 ng/g dw.
II.7. Analytical methods for PFC
The 14 perfluorinated compounds were analysed by LABERCA laboratory. One gram of freeze-dried sample was transferred to a 15 ml polypropylene centrifuge tube. The 10 mass-labeled internal standards were added (0.5 ng of PFBA 13C4, PFOA 13C4, PFNA 13C9, PFDA 13
C2, PFUnA 13C7, PFDoA 13C2, PFHxS 18O2, PFOS 13C4, FOSA 13C8, PFOSi 13C4). A solid-liquid extraction was performed with 15 mL MeOH; the supernatant was transferred into a polypropylene tube and 200 mg Envicarb phase was added. Agitation was performed for 10 min; after centrifugation, the supernatant was isolated and evaporated until dryness under a gentle stream of nitrogen. The dry residue was reconstituted with dichoromethane; the sample
was applied to a hydrated silica phase. The column was washed with dichloromethane, and analytes were eluted with acetone, before evaporation and final reconstitution in acetate ammonium / methanol, 70/30, v/v. The final extract was centrifuged and transferred into a polypropylene vial. The LC separation was achieved on a Gemini C18 reverse phase column (3 µm, 50 x 2.0 mm) fitted with a guard column (3 µm, 10 x 2.0 mm) (Phenomenex, Torrance CA, USA). The triple quadrupole system (Agilent 6410, Palo Alto, CA, USA) operated in the negative electrospray ionization (ESI-); acquisition was performed in the selected reaction monitoring mode (SRM).
The analytical method was validated according to 2002/657/EC decision [41]. The linearity calculated on the basis of the coefficient of correlation was better than 0.990 for most of the 14 analytes. Recoveries varied in-between 40 and 100%, but were systematically corrected by the 13C-labelled internal standards. Expanded uncertainties (U=2 x u) have been evaluated at 24% for PFOA and PFOS, and have been calculated based on the analyses of 4 batches of spiked samples at different concentrations. Limits of detection (LDs) were estimated on the basis of the signal to noise ratio in each sample. The LDs were generally between 0.01 and 1 ng/g dw. The LQ were around 0.1 ng/g dw except for PFOA and PFOS with LQ of 0.2 and 1 ng/g dw respectively.
II.8 Statistics
Means, medians and standard deviations (SD) were calculated according to Helsel (2005), in order to take account for non-detects [42], except in Table S1.
III. Results
III.1. Inter-individual concentrations in 4 fish species.
The fish pools were homogeneous in size and weight (Table 1), but not necessarily in contamination level (Supplementary material, Table S1). Indeed, concentrations (ng/g dw) of contaminants varied in the 4-6 individual samples that make up a pool, especially in the chub with RSD on the mean concentration up to 120% for 4t-OP (n=4) and 130% for BDE-99 (n=5). Concerning the 3 other species, a maximum RSD of 57% was observed for α-HBCD in the 6 individual samples of common bream, 65% for BDE-153 in the 6 individual samples of white bream and 89% for α-HBCD and BDE-153 in the 4 individual samples of barbel. In summary, inter-individual concentrations within a pool varied as much as a factor of 2 (based on a maximum RSD at 130%). Moreover, we generally observed for a single fish pool that each compound was either always detected in all the individual fishes, or never detected in all the individual fishes. In other words, the information on screening compounds was generally the same when considering individual fishes or pools. Hence, in the following parts, we present and discuss results on the fish pools only (included the mean concentrations resulting from the 4 pools discussed above).
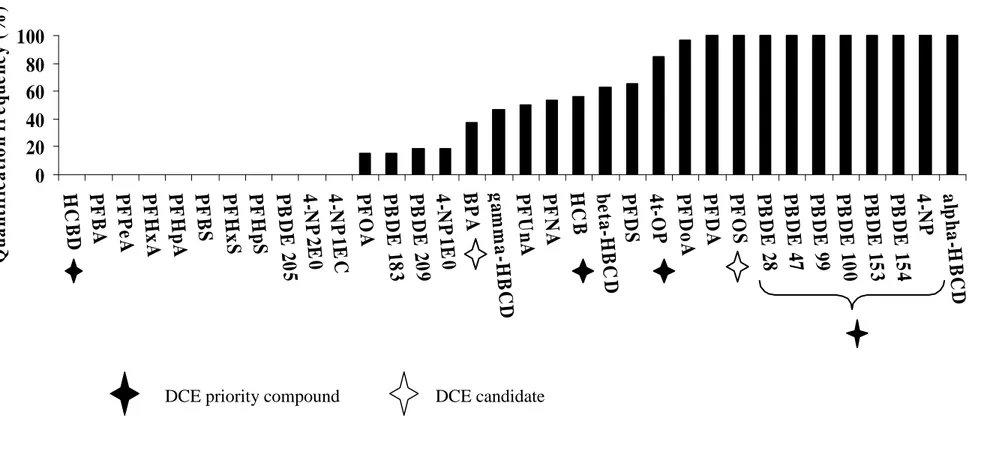
III.2. Quantification frequency of the 34 compounds analysed in the 32 fish sample pools The quantification frequencies (QF) are reported in Figure 2 for the 34 compounds analysed. QF is the ratio of the number of samples with quantifiable data (n>LQ) to the total number of samples analyzed (n=32). Several compounds were systematically quantified in the fish samples (QF = 100%): 4-NP, α-HBCD, the 6 tri to hexaBDE congeners (28, 47, 99, 100, 153, 154), PFOS and PFDA. Two other compounds were measured very frequently (QF>80%): OP
and PFDoA. On the contrary, BPA was quantified in only 37% of the samples and BDE-209 in 19%. Among the 14 PFC analysed, 7 were never quantified (QF=0 for PF-B,Pe,Hx,Hp-A and PF-B,Hx,Hp-S). PFOA were quantified in only 16% of the samples. HCBD was never quantified in the 32 fish pools, whereas HCB was quantified in 56% of them (with LQ equal to 10 and 1 ng/g dw, respectively). Lastly, the non-priority AP (NP1EO, NP2EO, 4-NP1EC) were not frequently quantified (QF=19% for 4-NP1EO, QF=0 for the 2 others). A high QF means that the compound is generally present in the freshwater fish. Conversely, a low QF does not necessarily give evidence of the absence of a compound, as the LQ varied between compounds, leading to non-quantifiable results in cases of higher LQ.
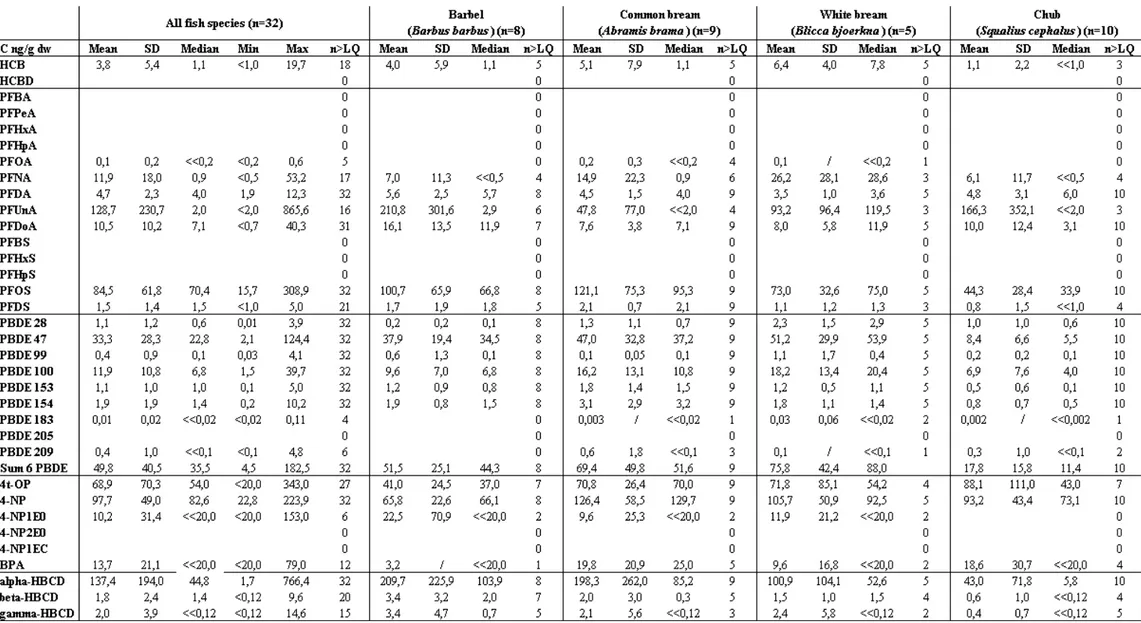
III.3. Comparison of mean concentration of the 34 compounds in the 32 fish sample pools Descriptive statistics, mean and standard deviation, median, minimum and maximum concentrations measured for the 32 fish pools, are reported in the left part of Table 2 (columns 2 to 7). 4-NP and 4t-OP are the AP measured with the highest mean concentrations (97.7 and 68.9 ng/g dw respectively). Among the other AP, only 4-NP1EO was quantified in some samples (mean concentration of 10.2 ng/g dw). BPA had a mean concentration of 13.7 ng/g dw. The α-HBCD isomer is by far more concentrated than the β- and γ- isomers, by a factor of 75 and 70 respectively (when considering mean concentrations). No individual sample had concentration of α-HBCD higher than the EQS (at 167 ng/g fw, or about 835 ng/g dw). HCB was quantified in 18 of the 32 fish pools analysed, of which 12 samples were collected in the downS3 site. The mean and median concentrations were 3.8 and 1.1 ng/g dw, respectively. This is lower than the EQS value (at 10 ng/g fw or about 50 ng/g dw). Moreover, no individual sample had higher concentration than the EQS. HCBD concentrations in the 32 fish pools were all below the LQ (i.e., < 10 ng/g dw), thus were lower than the EQS (at 55 µg/kg fw or about 275 ng/g dw). BDE-47 was the predominant PBDE congener (mean and median concentrations of 33.3 and 22.8 ng/g dw respectively). BDE-100 was measured as the second highest concentrated PBDE (mean and median concentrations of 11.9 and 6.8 ng/g dw, respectively). Whereas BDE-209, which is the main congener of the decaBDE commercial product, was not frequently quantified in fish, possibly because of debromination phenomena or a lack of bioavailability and bioaccumulation (QF=19%, mean concentration of 0.4 ng/g dw). Mean concentrations for other PBDE congeners were lower than 1.9 ng/g dw. Considering the proposal of EQS at 8.5x10⁻³ ng/g fw (or about 42.5x10⁻³ ng/g dw) for the sum of BDE-28, 47, 99, 100, 153 and 154, all the 32 samples had concentrations higher than the EQS. Indeed, the sum of the 6 BDE varied from 4.5 ng/g dw (for a chub pool at upS1) to 182.5 ng/g dw (for a common bream pool at upS1). Lastly, among the PFC, the highest mean concentrations were observed for PFUnA, PFOS and PFNA (128.7, 84.5 and 11.9 ng/g dw, respectively). The unusual high mean concentration of PFUnA could be explained by a strong contamination by this compound at downS3. Mean concentrations for other PFC were lower than 10.5 ng/g dw. Considering the proposal of EQS for the PFOS at 9.1 ng/g fw (about 45.5 ng/g dw), 23 on the 32 samples had higher concentration than the EQS.
III.4. Comparison of contamination measured in the various fish species
In the right part of Table 2, mean concentrations are reported for the barbel, the two bream species and the chub. To better compare the 4 fish species, we have studied the quantification frequencies for a given fish species, the sum of the mean concentrations and the compounds fingerprint, as detailed below. The white bream has to be considered differently since it was not collected in upS1.
The quantification frequencies for a given fish species (QFfish) is equal to
xz A
34 (with A, the sum of n>LQ for the 34 compounds in the samples of a given fish species; 34, the total number of compounds analysed; z, the total number of samples analyzed for a given fish species). The value of z is 8 for the barbel, 9 for the common bream, 5 for the white bream and 10 for the chub. As for example, a QFbarbel equal to 100% would correspond to
quantification of the 34 compounds in all the 8 samples of barbel. The QFchub (43%) was
slightly lower than for the other species (48% for the barbel and 51% for the two bream species). Thus, a higher number of compounds appeared to be quantifiable in the bream. Even if the number of individual fishes per pool and the number of pools per fish species and per site were not exactly the same (Table 1), we chose to compare the bioaccumulated concentration by summing the mean concentration per fish species for all compounds, except for PFUnA (Figure 3A). We did not consider PFUnA because of its very atypically high concentration at downS3. From Figure 3A, we may infer that the common bream was the best bioaccumulator (sum of mean concentration equal to 655 ng/g dw) and the chub was the worst (sum of mean concentration equal to 329 ng/g dw); although the difference was less than a factor of 2.
Then, we compared the compounds fingerprint (i.e. the profile of concentration) in the 4 fish species, as presented in Figure 3B. Once again, we did not consider PFUnA. In the 4 fish species, PFC (14 compounds) corresponded to about 25% of the total concentration (considering the 34 compounds and the samples with concentration higher than LQ). The proportion of AP (6 compounds) was higher in the chub (61%), the proportion of HBCD (3 isomers) was higher in the barbel (40%). The common bream appeared to bioaccumulate AP and HBCD in the same proportions (at about 35%).
III.5. Comparison of contamination measured in the 3 sampling sites
The mean concentrations (and SD) measured for each compound at the 3 sites are illustrated in Figure 4. The mean concentrations of some compounds showed a strong increase downstream Lyon in comparison to upstream: HCB (up to 38 times), PFNA (up to 58 times), PFUnA (up to 335 times). In contrast, we did not observe any significant concentration gradient for AP, PBDE and PFOS. Surprisingly, α-HBCD has clearly higher concentrations at upS2 than at upS1 and downS3 (mean concentrations at 271, 101 and 22 ng/g dw respectively).
At downS3, HCB, PFNA and PFUnA were quantified in all fish pools, whereas they were measured in less than 30% of the fish pools upstream Lyon. Generally, compounds were more frequently quantified at downS3 in comparison with the two other sites; except for PBDE 209, 4t-OP, 4-NP1E, β-and δ-HBCD, that were quantified more frequently at upS2 and BPA at upS1.
IV. Discussion
Concerning the priority substances of the European Commission daughter Directive 2008/105/EC [1], we observed that 4t-OP, 4-NP, BDE-28, -47, -99, -100, -153, -154 were very frequently quantified (QF > 84%), with higher concentrations than the EQS values (proposed in [2]) for the sum of the 6 BDE. Hence, these toxic compounds, whose use is now restricted or banned, are still widely present in fish of the Rhone River. In contrast, HCBD
was never quantified in the 32 fish pools and concentrations of HCB were always below the EQS value. These two compounds have recently been confirmed as priority compounds in the proposal for a new EC daughter Directive 2011/0429/EC [2]. But, further studies on the occurrence of HCBD are now necessary to better evaluate the occurrence of this compound in biota. The pertinence of a priority status for this compound, that is known to be volatile and not subject to biomagnification phenomenon [43], might have to be reconsidered. Among PFC, PFOS is the only candidate compound of the EC daughter Directive [1] and its priority status was confirmed in the proposal for a new EC daughter Directive [2]. Indeed, it was one of the 3 compounds of this family always quantified in fish samples of the Rhone River (QF 100%); and measured concentrations were higher than the proposed EQS values for 23 samples on 32 [2]. Our results confirm the risk of this compound. Lastly, BPA was a candidate compound of the EC daughter Directive [1], but its priority status was not confirmed in the proposal for a new EC daughter Directive [2]. Yet, we note that it was quantified in 38% of the 32 samples, with mean and median concentrations in the same range as for the other AP. Further studies should be ongoing to document the occurrence of this compound in aquatic biota, as it is well suspected for its human toxicity.
Concerning the emerging substances added in the proposal for a Directive 2011/0429/EC [2]: isomers α-, β- and γ-HBCD were quantified with a clear predominance of isomer α, that represented more than 90% of the 3 isomers measured in fish fillets. The isomer α-HBCD was quantified in 100% of the 32 samples, with concentrations in the same range as observed for 4t-OP, 4-NP, BDE 47 and PFOS. This is consistent with the literature on high trophic level biota: Pulkrabova et al. [44] detected α-HBCD in more than 80% of 136 fish samples from Vltava, Elbe and Ticha Orlice Rivers (Czech Republic). In this study, they noticed that concentrations of α-HBCD in fish were present at the same order of magnitude as those of the most abundant PBDE-47. Nonetheless, in our study, fish samples concentrations for isomer α, although always below the EQS, were sometimes in the same range as the EQS value (with 4 samples with concentrations higher than the EQS/2). These results confirm the pertinence to consider these emerging substances, and especially isomer α, as priority substances.
Other emerging compounds were very frequently quantified in our study: PFDA and PFDoA (QF > 97%) and to a less extent PFDS, PFNA and PFUnA (QF > 50%). Further analyses of these compounds in biota in different river systems would be useful to be able to state on their priorization.
In the following paragraphs, we have tried to report some information from the literature that can be useful to interpret or corroborate our results, although it has proved somewhat difficult. Indeed, fish species vary, individual compounds are not always the same, concentrations are expressed in various different ways (in dry vs. fresh matter, with a lipid normalization or not, by summing compounds or not). For instance, Roosens et al., [45] presented results only in ng/g lipid weight, and on sum PBDE or sum HBCD, without any information on individual compounds. They also focused their study on a mean concentration for all the fish species, which prevent any possible comparison between the 10 species analysed. Moreover, some authors focused their study on compound concentrations in fish bile [46] or the total fish [47], which does not allow direct comparisons with studies reporting fillet concentrations (i.e., the majority of the studies).
We have identified Abramis brama and then Barbus barbus as the 2 best bioindicators to monitor the 34 compounds in freshwaters (part III.4. and Figure 3). This is consistent with a study from Pulkrabova et al. [44], who compared the bioaccumulation of α-HBCD and 9
PBDE in 5 fish species (Abramis brama, Barbus barbus, Leuciscus cephalus, Salmo trutta and Perca fluviatilis): the highest concentrations were measured in the fatty benthic species represented by the bream and barbel; and the lowest concentrations were measured in the predator fishes, i.e., perch and trout, which are the highest trophic level species.
As for compounds occurrence in fish, we identified 4-NP as the predominant AP, α-HBCD as the predominant HBCD, BDE-47 as the predominant PBDE congener and PFOS as the predominant PFC (part III.3., Table 2). These results are confirmed by the literature [9, 46-48-52]. Indeed, α-HBCD is generally the main isomer measured in fish, in contrast to the composition of the technical mixture, with a predominance of γ- isomer [37, 49]. Some thermal rearrangement might occur during production processes, especially at elevated temperatures [10]. In addition, bioisomerisation and isomer-specific metabolisation have been discussed [50, 51]. The higher concentration of α-HBCD in freshwater fishes could also be explained by its higher ability to bioaccumulate and its lower toxicity. When comparing various fish organs, the proportion of α- β- and γ-HBCD isomers can vary: in a study on 8 fish species from the Yangtze River (China), α-HBCD represented 80% of the 3 isomers measured in liver, 60% in fillet and 40% in eggs [48]. The predominance of BDE-47 congener in biota was already explained by high uptake and accumulation rates [9, 52]. In addition, it has been proved to be a debromination product of other BDE congeners such as -99 and -153 in some fishes such as Cyprinus carpio [53]. Concerning the PFOS, it has also been observed that its concentrations in fish liver are consistently higher than those in fillet; it has been shown to bioaccumulate in fish with a kinetic bioconcentration factor estimated in the range of 1000 – 4000; and the time to reach 50% clearance in fish has been estimated to be around 100 days [54].
Very few information exist on background contamination of fishes in reference sites. For instance, Randak et al. [55] measured 4-NP and 4t-OP in Squalius cephalus from the Elbe River (Czech Republic) up and downstream industrial sites. They concluded on no significant contamination for concentrations between 1.1 and 3.0 ng/g ww (or about 3 - 9 ng/g dw). This is an order of magnitude lower than mean concentrations measured up and downstream Lyon (Cf. Figure 4, with mean concentrations higher than 64 and 73 ng/g dw for 4t-OP and 4-NP, respectively). The lower concentrations were 20 ng/g dw for 4t-OP and 23 ng/g dw for 4-NP, in 2 barbel pools from upS1 and downS3, respectively. Thus, we can conclude on a significant contamination by these 2 compounds in the 3 sites up and downstream Lyon. Further studies on background contamination of fishes in reference sites would be necessary to better evaluate water quality in the context of the WFD.
Conclusion
In this study, the bream and the barbel seemed to be the best adapted as bioindicator for freshwaters chemical monitoring (best accumulation and higher number of compounds detected), and the chub somewhat less efficient.
Several organic contaminants were quantified in all the 32 fish pooled samples: 4-NP, α -HBCD, the 6 tri to hexaBDE congeners (28, 47, 99, 100, 153, 154), PFOS and PFDA. Considering HCB, HCBD and HBCD, fish fillet concentrations did not exceed the EQS in any of the 32 samples. On the contrary, 23 of the 32 fish samples had concentration of PFOS above the EQS (up to 6 times higher). Moreover, the 32 fish samples had concentrations of PBDE above the EQS (up to 4000 times higher, with the sum of 6 BDE varying from 4.5 to
182 ng/g dw). Lastly, some compounds were never quantified in our 32 fish samples: HCBD, PFBA, PFPeA, PFHxA, PFHpA, PFBS, PFHxS, PFHpS, BDE205, 4-NP2EO, 4-NP1EC. The interest to consider PFOS (candidate from [1]) and HBCD as new priority substances (from [2]) is confirmed in this study. The pertinence of a priority status for HCBD, which was never quantified in our study, might have to be reconsidered in the future. Furthermore, we believe that more studies on background contamination of fishes in reference sites are necessary to better evaluate water quality in the context of the WFD.
In order to improve the comparability of results from the literature, it is important to systematically include information on the moisture content (or on the ratio dry weight / wet weight), the lipid content of fish samples and also the concentrations of all individual compounds. Even if it can be interesting to analyse specific parts of the fish (as for example the liver for PFC), it would be important to increase our knowledge on the concentrations in fillets.
Aknowledgement
Authors thank Onema (the French National Agency for Water and Aquatic Ecosystems) for its financial support.
References
[1] Directive 2008/105/EC of the European Parliament and of the Council of 16 December 2008 on environmental quality standards in the field of water policy. Official J of the European Union, L348: 84-97
[2] Proposal for a Directive 2011/0429/EC of the European Parliament and of the council amending Directives 2000/60/EC and 2008/105/EC as regards priority substances in the field of water policy
[3] Directive 2000/60/EC of the European Parliament and of the Council of 23 October 2000 establishing a framework for Community action in the field of water policy OJL 327, 22 December 2000, pp. 1–73
[4] Claisse D (2009) Adaptation de la surveillance chimique pour la DCE conformément à la directive fille 2008/105/CE - Propositions pour l’élaboration de stratégies. IFREMER, R.INT.DCN-BE/2009/05, 28 p
[5] Cailleaud K, Forget-Leray J, Souissi S, Lardya S, Augagneura S, Budzinski H (2007) Seasonal variation of hydrophobic organic contaminant concentrations in the water-column of the Seine Estuary and their transfer to a planktonic species Eurytemora affinis (Calanoid, copepod). Part 2: Alkylphenol-polyethoxylates. Chemosphere 70(2): 281-287
[6] White R, Jobling S, Hoare SA, Sumpter JP and Parker MG (1994) Environmentally persistent alkylphenolic compounds are estrogenic. Endocrin.135:175-182
[7] Directive 2011/8/EC of 28 January 2011 amending Directive 2002/72/EC as regards the restriction of use of Bisphenol A in plastic infant feeding bottles, 4 p
[8] Scientific Opinion on Bisphenol A: evaluation of a study investigating its neurodevelopmental toxicity, review of recent scientific literature on its toxicity and advice on the Danish risk assessment of Bisphenol A EFSA Journal (2010) 8(9):1829, 116 p
[9] de Wit CA (2002) An overview of brominated flame retardants in the environment. Chemosphere 46:583-624
[10] Covaci A, Gerecke AC, Law RJ, Voorspoels S, Kohler M, Heeb NV, Leslie H, Allchi CR, de Boer J (2006) Hexabromocyclododecanes (HBCDs) in the environment and humans: A review. Environmental Science & Technology 40 (12) :3679-3688
[11] Law RJ, Bersuder P, Barry J, Wilford BH, Allchin C, Jepson PD (2008) A significant downturn in levels of hexabromocyclododecane in the blubber of harbour porpoises (Phocoena phocoena) stranded or bycaught in the UK: An update to 2006. Environmental Science & Technology 42:9104-9109
[12] Birnbaum LS, Staskal DF (2004) Brominated flame retardants – cause for concern? Environmental Health Perspective 112 (1):9-17
[13] Eriksson P, Fischer C, Wallin M, Jakobsson E, Fredriksson A (2006) Impaired behaviour, learning and memory, in adult mice neonatally exposed to hexabromocyclododecane (HBCDD). Environmental Toxicology and Pharmacology 21:317-322
[14] Roze E, Meijer L, Bakker A, van Braeckel KNJA, Sauer PJJ, Bos AF (2009) Prenatal exposure to organohalogens, including brominated flame retardants, influences motor, cognitive and behavioural performance at school age. Environ Health Persp 117 (12):1953-1958
[15] Helleday T, Tuominen KL, Bergman A, Jenssen D (1999) Brominated flame retardants induce intragenic recombination in mammalian cells. Mutation Research/Genetic Toxicology and Environmental Mutagenesis 439(2):137-147
[16] Stockholm Convention on Persistent Organic Pollutants, May 2001, 43 p. (http://chm.pops.int/default.aspx)
[17] AMAP (2004). AMAP Assessment 2002: Persistent Organic Pollutants in the Arctic. Arctic Monitoring and Assessment Programme (AMAP), Oslo, Norway, xvi + 310 p
[18] Garcia-Reyero, N., Grimalt, J.O., Vives, I., Fernandez, P., Pina, B. (2007). Estrogenic activity associated with organochlorine compounds in fish extracts from European mountain lakes. Environmental Pollution 145, 745-752
[19] Song, S.B., Xu, Y., Zhou, B.S. (2006). Effects of hexachlorobenzene on antioxidant status of liver and brain of common carp (Cyprinus carpio). Chemosphere 65, 699-706
[20] Fuchsman, P.C., Barber, T.R., Sheehan, P.J. (1998). Sediment toxicity evaluation for hexachlorobenzene: Spiked sediment tests with Leptocheirus plumulosus, Hyalella azteca, and Chironomus tentans. Archives of Environmental Contamination and Toxicology 25, 573-579 [21] Parello, G., Gómez-Catalan, J., Castell, V., Llobet, J.M., Domingo, J.L. (2012). Estimation of
the daily intake of hexachlorobenzene from food consumption by the population of Catalonia, Spain: Health risks. Food Control 23, 198-202
[22] Van der Honing M (2007) Exploration of management options for hexachlorobutadiene (HCBD). 6th Meeting of the UNECE CLRTAP Task Force on Persistent Organic Pollutants, Vienna, Austria, 4-6 June 2007
[23] WHO (1994). Hexachlorobutadiene. Environmental Health Criteria 156, International Programme on Chemical Safety, World Health Organization, Geneva.
[24] EuroChlor (2002). EuroChlor risk assessment for the marine environment, OSPARCOM Region – North Sea: Hexachlorobutadiene, 35 p
[25] Taylor, K.W., Caux, P.-Y., Moore, D.R.J. (2003). An ecological risk assessment of hexachlorobutadiene. Human and Ecological Risk Assessment 9 (2), 511-525
[26] Directive 2002/95/EC, Directive on the restriction of the use of certain hazardous substances in electrical and electronic equipment or RoHS, L37, 13 February 2003, pp. 19–23
[27] Vonderheide AP, Mueller KE, Meija J, Welsh GL (2008) Polybrominated diphenyl ethers: Causes for concern and knowledge gaps regarding environmental distribution, fate and toxicity. Science of The Total Environment 400(1-3):425-436
[28] Stockholm Convention on Persistent Organic Pollutants, amendments to annexes A, B and C, August 2009, 14 p. (http://chm.pops.int/default.aspx)
[29] Paul AG, Jones KC, Sweetman A (2009) A first global production, emission, and environmental inventory For Perfluorooctane Sulfonate. Environmental Science & Technology 43(2):386-392
[30] Giesy JP, Kannan K (2001) Global Distribution of Perfluorooctane Sulfonate in Wildlife. Environmental Science & Technology 35:1339-1342
[31] Conder JM, Hoke RA, De Wolf W, Russell MH and Buck RC (2008) Are PFCAs bioaccumulative? A critical review and comparison with regulatory criteria and persistent lipophilic compounds. Environmental Science & Technology 42:995-1003
[32] Perfluorooctane sulfonate (PFOS), perfluorooctanoic acid (PFOA) and their salts. Scientific Opinion of the Panel on Contaminants in the Food chain. The EFSA Journal (2008) 653:1-13 [33] Liu C, Du Y, Zhou B (2007) Evaluation of estrogenic activities and mechanism of action of
perfluorinated chemicals determined by vitellogenin induction in primary cultured tilapia hepatocytes. Aquat Toxicol 85:267-277
[34] Peden-Adams MM, Keller JM, EuDaly JG, Berger J, Gilkeson GS, Keil DE (2008) Suppression of humoral immunity in mice following exposure to perfluorooctane sulfonate. Toxicol Sci 104:144-154
[35] Commission Regulation (EC) No 1883/2006 of 19 December 2006 laying down methods of sampling and analysis for the official control of levels of dioxins and dioxin-like PCBs in certain foodstuffs
[36] Frederiksen M, Vorkamp K, Bossi R, Riget F, Dam M, Svensmark B (2007) Method development and preliminary screening of HBCD, TBBPA and dimethyl-TBBPA in marine biota from Greenland and the Faroe Islands. International Journal of Environmental Analytical Chemistry 87 (15):1095-1109
[37] Vorkamp K, Bossi R, Rigét FF, Dietz R (2011) Time trends of hexabromocyclododecane, polybrominated diphenyl ethers and polychlorinated biphenyls in ringed seals from East Greenland. Environmental Science & Technology 45:1243-1249
[38] XPT 90-220, Qualité de l'eau - Protocole d'estimation de l’incertitude de mesure associé à un résultat d’analyse pour les méthodes d’analyses physico-chimiques, 2003, 74 p
[39] NFT 90-210, Qualité de l'eau - Protocole d'évaluation initiale des performances d'une méthode dans un laboratoire (ICS : 03.120.30 ;13.060.50 ; 13.060.60/ ISSN 0335-3931/ Mai 2009) [40] Labadie P, Alliot F, Bourges C, Desportes A, Chevreuil M (2010) Determination of
polybrominated diphenyl ethers in fish tissues by matrix solid-phase dispersion and gas chromatography coupled to triple quadrupole mass spectrometry: Case study on European eel (Anguilla anguilla) from Mediterranean coastal lagoons. Original Research Article Analytica Chimica Acta 675(2):97-105
[41] Commission Decision of 12 August 2002 implementing Council Directive 96/23/EC concerning the performance of analytical methods and the interpretation of results (2002/657/EC) 29p
[42] Helsel DR (2005) Non-detects and data analysis - Statistics for censored environmental data. Statistics in practice. John Wiley & sons, Hoboken (NJ)
[43] Goldbach RW, Van Genderen H and Leeuwangh PL (1976) Hexachlorobutadiene Residues in Aquatic Fauna From Surface Water Fed by the River Rhine. Science of the Total Environment 6(1) 31-40
[44] Pulkrabova J, Hajslova J, Poustka J, Kazda R (2007) Fish as Biomonitors of Polybrominated Diphenyl Ethers and Hexabromocyclododecane in Czech Aquatic Ecosystems: Pollution of the Elbe River Basin. Environmental Health Perspectives 115:28-34
[45] Roosens L, Dirtu AC, Goemans G, Belpaire C, Gheorghe A, Neels H, Blust R, Covaci A (2008) Brominated flame retardants and polychlorinated biphenyls in fish from the river Scheldt, Belgium. Environment International 34 976–983
[46] Vigano L, Mandich A, Benfenati E, Bertolotti R, Bottero S, Porazzi E, Agradi E (2006) Investigating the estrogenic risk along the River Po and its intermediate section. Archives of Environmental Contamination and Toxicology 51(4):641-651
[47] Martin JW, Whittle DM, Muir DCG, Mabury SA (2004) Perfluoroalkyl contaminants in a food web from lake Ontario. Environmental Science & Technology 38(20):5379-5385
[48] Xian QM, Ramu K, Isobe T, Sudaryanto A, Liu X, Gao Z, Takahashi S, Yu H, Tanabe S (2008) Levels and body distribution of polybrominated diphenyl ethers (PBDEs) and hexabromocyclododecanes (HBCDs) in freshwater fishes from the Yangtze River, China. Chemosphere 71(2):268-276
[49] Tomy GT, Pleskach K, Oswald T, Halldorson T, Helm PA, Macinnis G, Marvin CH (2008) Enantioselective bioaccumulation of hexabromocyclododecane and congener-specific accumulation of brominated diphenyl ethers in an Eastern Canadian Arctic marine food web. Environmental Science & Technology 42 (10):3634-3639
[50] Zegers BN, Mets A, van Bommel R, Minkenberg C, Hamers T, Kamstra JH, Pierce GJ, Boon JP (2005) Levels of hexabromocyclododecane in harbor porpoises and common dolphins from Western European seas, with evidence for stereoisomer-specific biotransformation by cytochrome P450. Environmental Science & Technology 39 (7):2095-2100
[51] Law K, Palace VP, Halldorson THJ, Danell RW, Wautier K, Evans RE, Alaee M, Marvin CH, Tomy GT (2006) Dietary accumulation of hexabromocyclododecane diastereomers in juvenile rainbow rout (Oncorhynchus mykiss). I: Bioaccumlation parameters and evidence of bioisomerization. Environ Toxicol Chem 25:1757-1761
[52] Burreau S, Axelman J, Broman D, Jakobsson E (1997) Dietary uptake in pike (Esox lucius) of some polychlorinated biphenyls, polychlorinated naphthalenes and polybrominated diphenyl ethers administered in natural diet. Environ Toxicol Chem 16:2508-2513
[53] Stapleton HM, Letcher RJ, Baker JE (2004) Debromination of Polybrominated Diphenyl Ether Congeners BDE 99 and BDE 183 in the Intestinal Tract of the Common Carp (Cyprinus carpio). Environmental Science & Technology 38(4):1054-1061
[54] OECD (Organisation for Economic Co-operation and Development) (2002) Hazard assessment of perfluorooctane sulfonate (PFOS) and its salts. ENV/JM/RD(2002)17/FINAL. Joint Meeting of the Chemicals Committee and the Working Party on Chemicals, Pesticides, and Biotechnology, Environment Directorate, Organisation for Economic Co-operation and Development (Paris)
[55] Randak T, Zlabek V, Pulkrabova J, Kolarova J, Kroupova H, Siroka Z, Velisek J, Svobodova Z, Hajslova J (2009) Effects of pollution on chub in the River Elbe, Czech Republic. Ecotoxicology & Environmental Safety 72(3):737-746
Table 1: Sampling and analytical strategy, description of samples from four species and three sites in the Rhone River.
Pool I II III IV I II III I II III
Fish number / pool 4 3 3 3 3 1 1 3
Mean fish wet mass (g) 1189 1300 782 1742 2081 1050 1500 2238
RSD (%) 4 0 5 5 6 / / 10
Mean total length (cm) 53.0 54.1 44.8 56.3 60.3 48.8 53.5 60.2
RSD (%) 1.31 1.45 1.06 1.65 1.17 / / 2.11
Analysis 4 fishes* 1 pool 1 pool 1 pool 1 pool 1 fish 1 fish 1 pool
Lipids (%) 8.0 4.8 8.8 17.1 14.5 15.9 12.6 19.9
Moisture (%) 79 80 78 74 78 78 78 77
Sex F F M F F M M F
Fish number / pool 2 3 1 3 3 3 6 3 3
Mean fish wet mass (g) 952 1770 3090 1265 1966 2299 1517 2117 2767
RSD (%) 22 19 / 11 6 3 7 3 8
Mean total length (cm) 42.3 55.3 64.0 46.1 55.9 58.4 48.1 54.0 58.9
RSD (%) 3.25 1.81 0.82 1.63 1.35 1.84 0.87 1.28
Analysis 1 pool 1 pool 1 pool 1 pool 1 pool 1 pool 6 fishes* 1 pool 1 pool
Lipids (%) 6.8 13.8 3.1 12.9 22.5 17.9 24.4 30.8 32.5
Moisture (%) 79 77 81 78 77 78 76 73 70
Sex M F,M,M F M F,F,M F 2M,4F M F
Fish number / pool 4 6 3 5 4
Mean fish wet mass (g) 527 625 1200 1210 1550
RSD (%) 7 5 7 5 3
Mean total length (cm) 33.8 35.0 43.9 45.0 46.9
RSD (%) 1.18 0.97 1.03 1.34 1.89
Analysis 1 pool 6 fishes* 1 pool 1 pool 1 pool
Lipids (%) 16.8 16,3 27.8 23.2 23.5
Moisture (%) 76 77 74 76 72
Sex M F M F F
Fish number / pool 3 3 5 3 4 5 3 3 3 3
Mean fish wet mass (g) 420 599 1153 1571 520 1035 1724 447 1214 1404
RSD (%) 21 14 5 6 8 9 3 15 6 2
Mean total length (cm) 33.9 37.5 46.1 49.5 36.1 45.0 51.0 33.6 45.7 47.8
RSD (%) 1.87 2.00 0.38 3.35 1.26 1.03 2.40 0.21 2.20 0.42
Analysis 1 pool 1 pool 5 fishes* 1 pool 1 pool 1 pool 1 pool 1 pool 1 pool 1 pool
Lipids (%) 3.9 2.5 3.2 2.8 4.5 10.9 6.4 2.7 12.2 9.2
Moisture (%) 80 80 80 81 78 77 80 79 79 78
Sex M F F F M 3M,2F F M F F
* : From four pools, the fish were analyzed individually to test the inter-individual concentrations of the pools
Chub (Squalius cephalus )
upS1 upS2 downS3
Barbel (Barbus barbus ) Common Bream (Abramis brama ) White Bream (Blicca bjoerkna )
Table 2: Concentrations (ng/g dw) of the 34 compounds analysed in the 32 fish pools. Mean moisture of fish samples equal to 77±3% (n=32).
Figure 1: Location of the 3 sites along the Rhone River, in France, where fishes were collected, La Morte (upS1), Grand Large (upS2), Ile du Beurre (downS3).
DownS3 UpS2
Figure 2: Quantification frequency (QF, %) of the 34 compounds analysed in the 32 fish pools for all 3 sites in the Rhone River.
0
20
40
60
80
100
H
C
B
D
P
F
B
A
P
F
P
e
A
P
F
H
x
A
P
F
H
p
A
P
F
B
S
P
F
H
x
S
P
F
H
p
S
P
B
D
E
2
0
5
4
-N
P
2
E
0
4
-N
P
1
E
C
P
F
O
A
P
B
D
E
1
8
3
P
B
D
E
2
0
9
4
-N
P
1
E
0
B
P
A
g
a
m
m
a
-H
B
C
D
P
F
U
n
A
P
F
N
A
H
C
B
b
e
ta
-H
B
C
D
P
F
D
S
4
t-
O
P
P
F
D
o
A
P
F
D
A
P
F
O
S
P
B
D
E
2
8
P
B
D
E
4
7
P
B
D
E
9
9
P
B
D
E
1
0
0
P
B
D
E
1
5
3
P
B
D
E
1
5
4
4
-N
P
a
lp
h
a
-H
B
C
D
Q
u
a
n
ti
fi
c
a
ti
o
n
f
r
e
q
u
e
n
c
y
(
%
)
Figure 3: Comparison of A/ sum of mean concentration (Cmean) obtained for the 34 compounds1 and
B/ fingerprint for AP, HBCD, HCB, PBDE and PFC in the barbel, the common bream, the white bream and the chub.
1
: Cmean presented in Table 2 were summed for each fish species, except for PFUnA. 0 100 200 300 400 500 600 700
Barbel Common bream White bream Chub
S u m C m ea n ( n g /g d w ) ex ce p t P F U n A 498 329 536 0% 20% 40% 60% 80% 100%
Barbel Common bream White bream Chub
C o m p o u n d s fi n g er p ri n t (% ) ex ce p t P F U n A HBCD AP PBDE PFC HCB/HCBD B /
Figure 4: Comparison of mean concentration and SD (ng/g dw) for AP, BPA, HBCD isomers, HCB, PBDE, PFC in fishes from the Rhone River, in upS1, upS2 and downS3. The following compounds: 4-NP2EO and 4-NP1EC, HCBD, BDE-205, PFBA, PFPeA, PFHxA, PFHpA, PFBS, PFHxS, PFHpS, were never quantified in the 32 fish sample pools.
0 30 60 90 120 150 HC B PFO A PFN A PFD A PFU nA PFD oA PFO S PFD S PBD E 28 PBD E 47 PBD E 99 PBD E 10 0 PBD E 15 3 PBD E 15 4 PBD E 18 3 PBD E 20 9 4t-O P 4-N P 4-N P1E BPA alph a-H BCD beta -HB CD gam m a-HB CD M e a n C o n c e n tr a ti o n ( n g /g d w ) UpS1 UpS2 DownS3 0.01 at UpS2 and DownS3 352 271
1