HAL Id: hal-00784797
https://hal.sorbonne-universite.fr/hal-00784797
Submitted on 23 Apr 2015HAL is a multi-disciplinary open access archive for the deposit and dissemination of sci-entific research documents, whether they are pub-lished or not. The documents may come from teaching and research institutions in France or abroad, or from public or private research centers.
L’archive ouverte pluridisciplinaire HAL, est destinée au dépôt et à la diffusion de documents scientifiques de niveau recherche, publiés ou non, émanant des établissements d’enseignement et de recherche français ou étrangers, des laboratoires publics ou privés.
Influence of normal and radial contributions of local
current density on local electrochemical impedance
spectroscopy
Jean V. Ferrari, Hercilio G. de Melo, Michel Keddam, Mark E. Orazem,
Nadine Pébère, Bernard Tribollet, Vincent Vivier
To cite this version:
Jean V. Ferrari, Hercilio G. de Melo, Michel Keddam, Mark E. Orazem, Nadine Pébère, et al.. In-fluence of normal and radial contributions of local current density on local electrochemical impedance spectroscopy. Electrochimica Acta, Elsevier, 2012, 60, pp.244-252. �10.1016/j.electacta.2011.11.053�. �hal-00784797�
Influence of Normal and Radial Contributions of Local Current
Density on Local Electrochemical Impedance Spectroscopy
J.V. Ferrari,a,b,c H.G. De Melo,c M. Keddam,a,b M.E. Orazem,d N. Pébère,e B. Tribollet,a,b V. Viviera,b,*
a CNRS, UPR15, Laboratoire Interfaces et Systèmes Electrochimiques, F-75005 Paris, France b UPMC Univ Paris 06, UPR15, LISE, 4 place Jussieu, F-75005 Paris, France
c Chemical Engineering Department of the Polytechnic School of the São Paulo University,
P.O. Box 61548, CEP: 05424-970 – São Paulo – SP, Brazil
d Department of Chemical Engineering, University of Florida, Gainesville, FL 32611, USA e Université de Toulouse, CIRIMAT, UPS / INPT / CNRS, ENSIACET, 4, allée Emile Monso –
BP 44362, 31030 Toulouse cedex 4, France
Abstract
A new tri-electrode probe is presented and applied to local electrochemical impedance spectroscopy (LEIS) measurements.As opposed to two-probe systems, the three-probe one allows measurement not only of normal, but also of radial contributions of local current densities to the local impedance values. The results concerning the cases of the blocking electrode and the electrode with faradaic reaction are discussed from the theoretical point of view for a disk electrode. Numerical simulations and experimental results are compared for the case of the ferri/ferrocyanide electrode reaction at the Pt working electrode disk. At the center of the disk, the impedance taking into account both normal and radial contributions was in good agreement with the local impedance measured in terms of only the normal contribution. At the periphery of the electrode, the impedance taking into account both normal and radial contributions differed significantly from the local impedance measured in terms of only the normal contribution. The radial impedance results at the periphery of the electrode are in good agreement with the usual explanation that the associated larger current density is attributed to the geometry of the electrode, which exhibits a greater accessibility at the electrode edge.
1. Introduction
Local electrochemical techniques such as scanning electrochemical microscopy (SECM), scanning vibrating electrode technique (SVET) or local electrochemical impedance spectroscopy (LEIS) are now widely used for the characterization of surface reactivity[1-6], the determination of electron transfer kinetics [7-9], as well as studying complex electrochemical reactions [10-12]. Among these techniques, local electrochemical impedance spectroscopy (LEIS), pioneered by Isaacs et al. [13, 14], takes advantage of electrochemical impedance spectroscopy to probe the local electrochemical reactivity of an interface [15-17]. From this seminal work, different approaches have been envisioned for measuring LEIS. The most widespread procedure employs a bi-electrode to sense simultaneously the local potential at two locations above the substrate [18, 19]. This can be achieved using a large bi-electrode (Pt electrodes in the millimetre range with an inter-electrode distance of few millimetres are commercially available) [20-23] or smaller probes that consist of two micro-electrodes embedded in a glass capillary [14, 19, 24, 25]. In the latter case, Ag/AgCl micro-reference electrodes can be used [19]. The local current density is thus calculated from this local potential difference and the Ohm’s law for the electrolyte.
An adaptation of SVET to AC polarization was also devised and took advantage of the use of a single probe that is vibrated, allowing a fine and easy control of the inter-electrode distance by controlling the amplitude of the vibration [26, 27]. This technique, however, suffers from local convection induced by the probe vibration and from the contribution of the redox potential at a metallic electrode [26]. Since the deposit of Ag/AgCl at the apex of the vibrating tip results in a fragile probe, no significant improvement in the measurement of the local potential can be reached.
A common feature of the above configurations is that only the normal component of the AC-current in solution is monitored, i.e., curvature of equipotential surfaces in solution is
not taken into account. Therefore the resulting estimate for local current density is valid only when the sensing probe is located above the center of the domain of interest; otherwise the local current in solution is the vector sum of both the normal and the radial components. In addition, in spite of the capability of SVET to measure simultaneously the normal and radial dc-current components [28-32], to the best of our knowledge, only the normal component of the current has been considered for the measurement of LEIS.
More recently, some developments of the microcell technique have been reported [33, 34], where only a small area of an electrode is isolated by a glass capillary and placed in direct contact with the electrolyte for performing LEIS measurements. It should be noted that using a microcapillary, equipotential surfaces are constrained by the capillary geometry, thus equipotential surfaces are parallel to the electrode surface along the cylinder between the working electrode and the counter electrode. With such a device, local measurement can be performed, but the electrochemical response does not account for the surrounding environment of the local domain analyzed.
The objective of the present work is to report on the use of a tri-electrode system which is used for the first time to perform LEIS measurements. A theoretical framework is developed for a classical blocking electrode and for an electrode with faradaic reaction, allowing a direct comparison with previous works [24, 25, 35-37]. Then, experimental investigation for a model system (ferri/ferrocyanide redox couple at Pt electrode) was performed to illustrate the relevance of the simultaneous measurement of both normal and radial current components.
2. Experimental
2.1. Instrumentation
The LEIS apparatus consisted of an in-house made device with a 3-axis positioning system (UTM25, Newport) driven by a motion encoder (MM4005, Newport) allowing a spatial resolution of 0.2 µm in the three directions. The potentials were controlled by a home-made potentiostat. The experimental setup was computer controlled by a single software developed under the Labview® environment. Use of a four-channel frequency response analyzer (Solartron – FRA 1254) allowed both global and local impedances to be recorded simultaneously [24, 36, 38]. Home-made low-noise analog differential amplifiers with both variable gain and high input impedance were developed for recording both the local potentials and current variations.
The LEIS experiments were performed using 50 mV peak-to-peak sine wave perturbation, 50 acquisition cycles over a frequency range of 65 kHz to 100 mHz with 7 points per decades.
2.2. Tri-Electrode Current Sensor
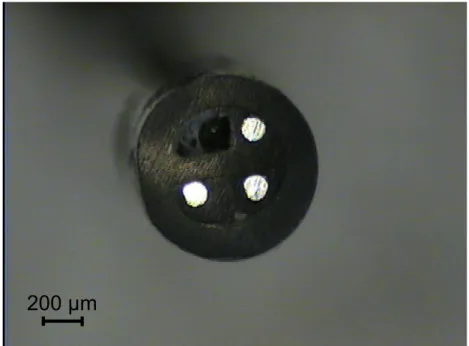
The trielectrode consisted of three silver microwires of 100 µm in diameter, each of them laterally insulated using a cataphoretic paint (few micrometers thick), and then sealed in a capillary glass with an epoxy resin. The electrode arrangement was optimized for the measurement of both normal and radial local current densities (Fig. 1). Such a setup is equivalent to the vibrating probe developed for SVET experiments, except that the use of a multi sensor avoided local forced convection. The apex of the electrode was polished with SiC emery paper up to 1200 grade, and an electrochemical deposit of AgCl was performed by potentiostatic oxidation of Ag in a KCl 0.5 M solution on each electrode. This set of reference microelectrodes allowed simultaneous measurement of three local potentials in the close vicinity of the substrate. It should be mentioned that, as previously demonstrated, the relevant
parameters for the local measurements are the size of each probe, the distance between two probes, and the tip-to-sample distance [15].
2.3. Chemicals and samples
All the experiments were performed using analytical grade chemicals as received. Electrolytic solutions were prepared in twice-distilled water (18 MΩ cm). A 10 mM ferri/ferrocyanide solution was prepared in a 0.5 M KCl electrolyte. A Pt working electrode was laterally insulated with a cathaphoretic paint, heat treated for 1 hour at 150°C, and then molded into an epoxy resin (Buhler, EpoxycureTM). This electrode was secured at the bottom of a Teflon cell with an O-ring larger than the nominal Pt diameter. The counterelectrode was a large platinum gauze surrounding all the electrochemical cell in order to minimize current and potential distributions due to the cell geometry. A saturated calomel electrode (SCE) was used as reference electrode. All potentials are reported with respect to this reference unless otherwise stated.
3. Mathematical Models
The mathematical models developed for this work and the definitions employed in the description of the impedance response are presented below. First, the definitions employed in the description of the impedance response are presented. Then, simulations were developed for a blocking electrode and an electrode with Faradaic reaction. All simulations were performed using finite element method, implemented in Comsol Multiphysics on a PC.
3.1. Definitions
Previous works defined global, local, local interfacial, and local ohmic impedances using a bi-electrode for probing the solution potential and a multi-channel frequency response analyzer [35-37]. The local AC-current density iloc( )
ω
was obtained through the Ohm’s lawd V i probe loc κ ω ω) ( ) ( = Δ (1)
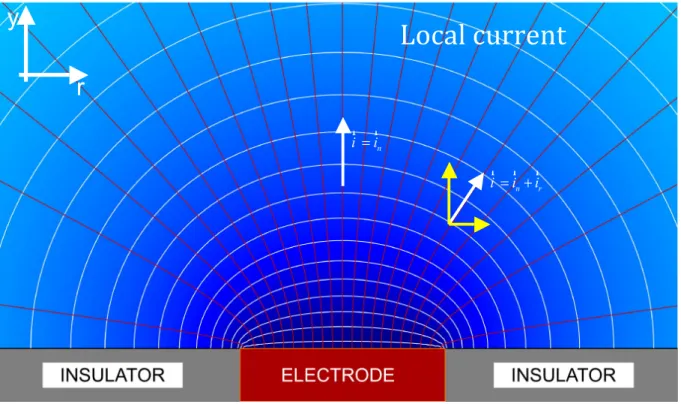
where κ is the electrolyte conductivity, ΔVprobe(ω) is the AC-potential difference between the two probes, and d is the distance between the two probes. As shown in Fig. 2, for the disk geometry, the local current density in solution is the vector sum of radial and normal contributions: ( ) ( ) probe loc n n n V i d ω κ ω = Δ (2) ( ) ( ) probe loc r r r V i d ω κ ω = Δ (3)
where ΔVn is the potential difference measured by the probe in a direction normal to the
electrode surface, and Δ is the potential difference measured by the probe in a radial Vr
direction, parallel to the electrode surface.
The two local impedances, zn( )ω and ( )zr ω , involve the electrode potential measured with respect to a reference electrode located far from the electrode surface:
ref ( ) ( ) ( ) ( ) ( ) loc probe n n n n V V d z i V ω ω ω ω ω κ − Φ = = Δ % % (4) ref ( ) ( ) ( ) ( ) ( ) loc probe r r r r V V d z i V ω ω ω ω ω κ − Φ = = Δ % % (5)
where V~(ω)−Φref represents the AC-potential difference between the working electrode and the reference electrode in the bulk solution.
The two local interfacial impedances, z0n( )ω and
0( )
r
z ω , involve the potential of the electrode referenced to the potential of the electrolyte measured at the inner limit of the diffuse layer.
0 0 0 ( ) ( ) ( ) ( ) ( ) ( ) ( ) loc probe n n n n V V d z i V ω ω ω ω ω ω ω κ − Φ − Φ = = Δ % % % % (6) 0 0 0 ( ) ( ) ( ) ( ) ( ) ( ) ( ) loc probe r r r r V V d z i V ω ω ω ω ω ω ω κ − Φ − Φ = = Δ % % % % (7)
Thus, the local Ohmic impedances, n( ) e
z ω and r( ) e
z ω , can be deduced by calculating the difference between the local impedance and local interfacial impedance for both normal and radial contributions. 0 ( ) ( ) ( ) n n n e z ω =z ω −z ω (8) 0 ( ) ( ) ( ) r r r e z ω =z ω −z ω (9)
Following previous developments in this area [34-37], the Ohmic impedance can be a complex number. Throughout this paper, the results are expressed in terms of a dimensionless frequency, K, which is defined by:
0 0
C r
K ω
κ
= (10)
where C is the interfacial capacitance and r0 0 is the electrode radius.
3.2. Blocking Electrode
The potential Φ in solution in the vicinity of an inlaid disk electrode is governed by the Laplace’s equation.
0 2Φ=
∇ (10)
Using cylindrical coordinates and taking into account the cylindrical symmetry condition, the potential distribution can be expressed as:
2 2 2 2 1 0 r r r y ∂ Φ+ ⎛∂Φ⎞+∂ Φ= ⎜ ⎟ ∂ ⎝ ∂ ⎠ ∂ (11)
blocking electrode can be described by a pure capacitive behavior, the flux boundary condition at the electrode surface was written as:
(
)
0 0 0 = ∂ Φ ∂ − = ∂ Φ − ∂ y y t V C κ (12)where κ is the electrolyte conductivity, V is the electrode potential, and Φ is the potential 0 just outside the double layer. On the surrounding insulator and far from the electrode surface, the boundary conditions were given by:
0 0 = ∂ Φ ∂ = y y for r > r0 (13) and: 0 → Φ when r2+y2 →∞ (14)
3.3. Electrode with Faradaic Reaction
The second model describes an electrochemical reaction of redox moiety in solution that also takes into account current and potential distributions. A one-step electrochemical reaction involving a single electron exchange was assumed to occur at the disk interface, e.g.,
ox+ à àÜe−á àà red (15)
The reaction rate
( )
v follows the Butler-Volmer relationship:(
)
(
)
(
)
0 exp 0 exp 1 0 red ox F F v k C V E C V E RT RT α α ⎛ ⎡ ⎤ ⎡ ⎤⎞ = ⎜ ⎢ − ⎥− ⎢− − − ⎥⎟ ⎣ ⎦ ⎣ ⎦ ⎝ ⎠ (16)where C and red C are the interfacial concentrations of electroactive species, ox k0 is the
standard rate constant, α the transfer coefficient, E the standard potential. If the 0
electrochemical cell is assumed to be convection free during the duration of the experiment, the mass transport of electroactive species is governed by the second Fick’s law:
2 2 2 2 1 i i i i i C C C C D t r r r y ⎛ ⎞ ∂ = ∂ + ⎛∂ ⎞+∂ ⎜ ⎜ ⎟ ⎟ ∂ ⎝ ∂ ⎝ ∂ ⎠ ∂ ⎠ (17)
where the subscript i accounts for ox or red, and Di is the diffusion coefficient of the species i.
For the electrochemical impedance simulations, this problem was split in two contributions: a steady-state contribution and a harmonic contribution. The latter was obtained from the linearization of Butler-Volmer equation as already described elsewhere [39, 40]. Thus, the system to be solved consisted in five coupled differential equations (two for each redox moiety describing the steady-state and the harmonic contributions, and one for the potential). The faradaic admittance was obtained by integrating the flux along the radial direction of the electrode for each angular frequency
(
ω=2 fπ)
.4. Results and Discussion
Simulations were performed for a blocking electrode, and both simulations and experiments were done for a model ferricyanide/ferrocyanide redox system.
4.1. Blocking electrode
In the following, the case of a blocking electrode is investigated. It consists of a disk electrode of 0.25 cm in radius, embedded in an infinite insulator and which behaves as a pure capacitor (C0 = 10 µF). The electrolyte conductivity is κ = 0.01 S/cm.
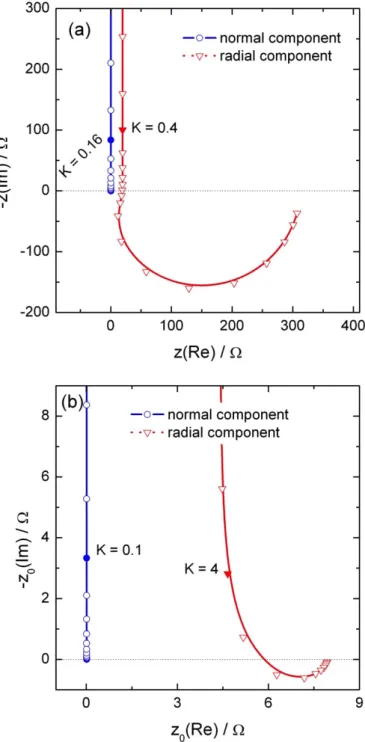
Calculated normal and radial local electrochemical impedances are presented in Figure 3a for a probe positioned above the electrode surface (at a distance y = 100 µm) and close to the center of the disk (r = 100 µm). The high-frequency limit of the spectrum is about 0.5 Ω for the normal local impedance, and is much larger (about 320 Ω) in the case of the radial local impedance. Similarly, in the case of the local interfacial impedance shown in Fig. 3b, the high frequency limit is about 12 mΩ for the normal contribution; whereas, it is about 8 Ω
for the radial contribution. It should be noted that, in both cases, the ratio of the high frequency limit is the same.
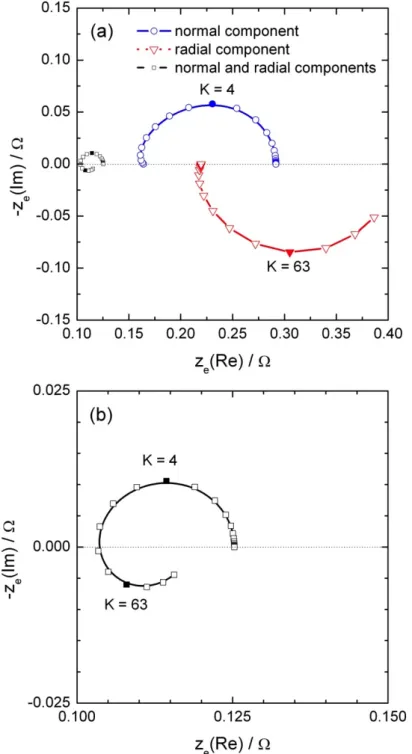
The local impedance calculated from both normal and radial contributions under the conditions described for Figure 3 is compared in Figure 4a to the local impedance calculated only with the normal contribution of the current density. Diagrams are very similar in both shape and intensity. The error made by using only the normal contribution is about 0.2 % in the high frequencies, and about 1.5 % in the medium frequencies. The local Ohmic impedance diagrams calculated from both normal and radial contribution are compared in Figure 4b to the local Ohmic impedance calculated only with the normal contribution of the current density. As already observed in the case of the normal component only [35-37], the diagrams exhibit a single inductive loop in the high-frequency domain with the same time constant than the one observed for the local impedance. Thus, above the electrode center, the use of only the normal current density for the determination of the local impedances results in minor error, usually in the range of the experimental error.
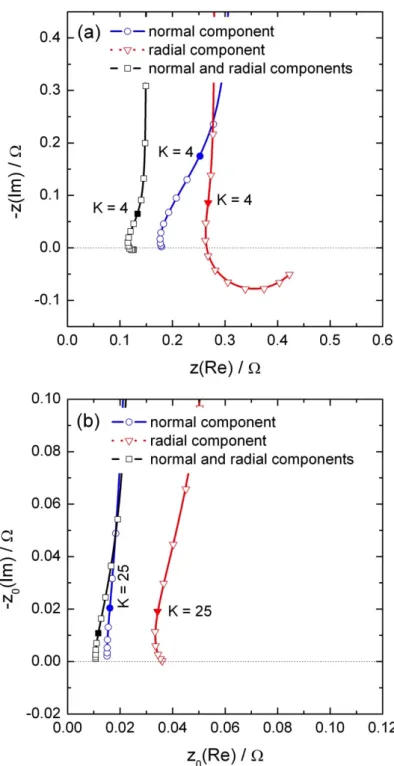
The local impedance calculated close to the electrode edge (r = 0.24 cm) is presented in Figure 5a. In that case, both local impedances calculated from the normal or from the radial current density are of the same order of magnitude. As a result, the local impedance close to the electrode edge is smaller than the one calculated with only one contribution. For instance, if only the normal current density is considered, the error is larger than 50% in the whole frequency range. Such a behaviour is attributed to the geometry of the electrode, which exhibits a greater accessibility at the electrode edge. The same trends are shown in Figure 5b for the local interfacial impedance. However, the difference between the radial and the normal local interfacial impedances is larger because, close to the electrode surface, the curvature of the current lines is less significant.
The local Ohmic impedance calculated close to the electrode edge is shown in Figure 6a. The local Ohmic impedance calculated with the normal current density is mainly capacitive with a small inductive feature in the high frequencies. Conversely, the contribution calculated with the radial current density only is an inductive loop in a higher frequency range. Thus, the local Ohmic impedance is characterized by two time constants as shown in Figure 6b.
Thus in the case of a blocking electrode, the geometry of the cell cannot be neglected. The radial component of the current is to be considered when the probe is close to the boundary between the conducting part of the electrode and the surrounding insulator. It is also interesting to note that both contributions of the local current density result in two different time-constants that can be observed in the local Ohmic impedance spectra.
4.2. Ferri/ferrocyanide at a Pt electrode
Experiments and simulations were also performed on a model system
( )
( )
(
4 3)
6 6
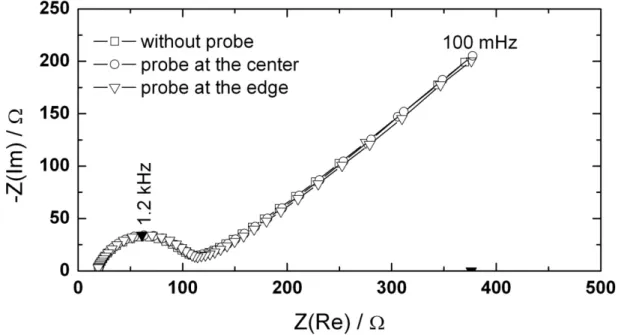
Fe CN − Fe CN − in order to investigate the contribution of normal and radial current densities on the most common contributions such as charge transfer resistance and diffusion impedances. Three successive global impedance diagrams, performed with a 0.25 cm in radius Pt electrode in a 10 mM ferri/ferrocyanide and 0.5 M KCl solution at the equilibrium potential, are shown in Figure 7. The Pt disk electrode was not polished nor electrochemically activated in order to decrease the rate of the electron exchange reaction (i.e., causing a larger charge transfer resistance). The diagrams were obtained in absence or in presence of the tri-electrode in the close vicinity of the substrate. It can be seen that even if the presence of the probe undoubtedly modifies the current and potential distributions at the disk, no significant effect is seen.
Experimental local impedance diagrams are shown in Fig. 8a for a probe position close to the edge or close to the centre of the electrode. These diagrams have the same shape as does the
global measurement (Fig. 7) and have similar time constants. However, the impedance close to the electrode edge is larger, which corresponds to smaller current density at the electrode edge than at the centre. This behaviour was previously observed by performing systematic local impedance measurements along an electrode radius of AZ91 Mg alloy [41]. Due to the edge effect, one can imagine that the local current density should be larger at the electrode edge than at the centre [42, 43], thus the radial contribution cannot be neglected. This was confirmed by the use of the tri-electrode (Fig. 8b), which allows the radial local impedance to be measured simultaneously with the normal contribution. The low-frequency limit (0.1 Hz) shown in Figure 8b is about 8 times larger at the electrode centre than at the edge, but the general shape of the signal corresponds to a high-frequency capacitive loop attributed to the charge transfer resistance in parallel with the double layer capacitance, and the Warburg impedance in the low frequency domain for the diffusion of electroactive species. In addition, a high frequency inductive feature appears when the probe is above the electrode centre. Such a behaviour was previously attributed to the disk geometry of the substrate [35-37]. Simulations were performed to account for such a behaviour using finite element methods to describe simultaneously diffusion of electro-active species and current and potential distributions in the electrochemical cell. All calculations were performed with a diffusion coefficient of 10-5 cm2/s, a heterogeneous rate constant of 10-3 cm/s, a transfer coefficient of 0.5, an equimolar concentration of redox moieties (10-2 mol/l) a tip-to-substrate distance of 100 µm, an interelectrode distance of 100 µm, C0 = 10 µF and κ = 0.01 S/cm; and results for both radial and normal local impedance are shown in Figure 9. The simulation results are in agreement with the experimental ones, showing that when the measurement is performed above the electrode centre, the normal component of the local current density (thus, the normal local impedance) describes with a good approximation the local behaviour. However, close to the electrode edge, the radial current density increases and can no longer be
neglected. It should be noted that such behaviour does not apply only for a disk electrode. It can be easily extended to more complicated system, e.g., for multiphase electrodes for which discontinuity exists at each boundary between grains. In fact, the influence of the radial component of the current was previously argued in the case of galvanic coupling between two metals in order to explain the variations in the high frequency domain of local impedance measured with a bi-electrode [44, 45].
However, some differences between experimental and simulated diagrams can be noticed. In particular, the amplitude of the diagrams is different and there is a small shift of the characteristic frequencies. This is due to limitations of the simulation for which we cannot extend the number of meshes throughout the whole domain. To circumvent this problem, we have used geometric parameters (probe-to-substrate distance, distance between the two probes) for the calculations slightly different from the experimental conditions. Accordingly, the simulations account enough for the observed experimental variations and validated the contributions of the normal and radial contributions on local impedance measurements. The objective was not to fit accurately the experimental results.
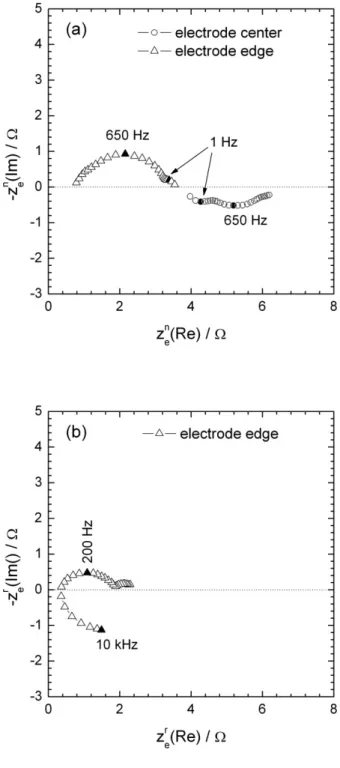
Figure 10a shows the experimental local normal Ohmic impedances measured at the centre and at the edge of the electrode. In both case, two time constants are observed at 650 Hz and at 1 Hz. It should be mentioned that this impedance changes from inductive to capacitive behaviour from the centre to the edge, respectively. The HF time constant should be attributed to the relaxation of charge transfer resistance in parallel with the double layer capacitance, and the low frequency loop is to be linked to the diffusion process.
The radial contributions were also measured (Fig 10b). Close to the electrode edge, this local Ohmic impedance exhibits an additional high-frequency time constant, which is attributed to the geometry of the electrode, and a shift towards smaller value of the time constant is also observed. Above the electrode centre, no reliable measurement could be obtained (see below).
The numerical simulations of the two components of the local Ohmic impedance are presented in Figure 11a. A good agreement with the experimental results presented in Fig. 10 for both the shape and the frequency shift is observed. As shown in Figure 11b, the radial local Ohmic impedance is very large (in the mega Ohm range), which corresponds to very small current density. This explains why the radial contributions to local Ohmic impedance could not be measured at the centre of the electrode, and why only the contribution at the electrode edge is reported in Fig. 10b.
5. Conclusions
The numerical simulations show that the contribution of the radial current to the impedance response is significant near the electrode periphery for electrodes exhibiting both blocking and faradaic behaviour. Thus, near the electrode periphery, the local impedance calculated above the electrode surface using only the normal current component is larger than would be obtained using the correct current density containing both radial and normal components. At the centre of the electrode, the radial component of current density may be neglected, and the local impedance calculated using only the normal current component is equal to that which would be obtained using both radial and normal components.
The development of a tri-electrode probe has allowed measurement of axial and radial contributions to local current density and to local impedance values. At the centre of a disk electrode, the radial component contributed little to the overall impedance response, and the impedance taking into account both normal and radial contributions is in good agreement with the local impedance measured in the usual way in terms of only the normal contribution. At the periphery of the electrode, the radial component of the current density is significant, and the impedance taking into account both normal and radial contributions differs significantly from the local impedance measured in the usual way in terms of only the normal contribution. Thus, a bi-microelectrode may be used to obtain quantitative data when the probe is located
above the centre of the electrode; whereas, only qualitative information can be obtained above the edge. The radial impedance results at the periphery of the electrode are in good agreement with the usual explanation that the associated larger current density is attributed to the geometry of the electrode, which exhibits a greater accessibility at the electrode edge. In addition, the inductive and capacitive behavior observed on the local Ohmic impedance for the blocking electrode are linked to radial and normal local current density, respectively.
Acknowledgments
M.E. Orazem acknowledges financial support from the Charles A. Stokes professorship, and
Reference List
1. K. Eckhard, X. Chen, F. Turcu, W. Schuhmann, Phys. Chem. Chem. Phys., 8 (2006) 5359.
2. K. Eckhard, W. Schuhmann, Analyst, 133 (2008) 1486.
3. F. O. Laforge, J. Velmurugan, Y. Wang, M. V. Mirkin, Anal. Chem. (Washington, DC, U. S. ), 81 (2009) 3143.
4. M. J. Franklin, D. C. White, H. S. Isaacs, Corros. Sci., 33 (1992) 251.
5. H. S. Isaacs, M. W. Kendig, Corrosion (Houston, TX, United States), 36 (1980) 269. 6. C. Gabrielli, E. Ostermann, H. Perrot, V. Vivier, L. Beitone, C. Mace, Electrochem.
Commun., 7 (2005) 962.
7. A. J. Bard, M. V. Mirkin, P. R. Unwin, D. O. Wipf, J. Phys. Chem., 96 (1992) 1861. 8. B. Liu, M. V. Mirkin, J. Phys. Chem. B, 106 (2002) 3933.
9. H. Cachet, C. Debiemme-Chouvy, C. Deslouis, A. Lagrini, V. Vivier, Surface and Interface Analysis, 38 (2006) 719.
10. C. Demaille, P. R. Unwin, A. J. Bard, J. Phys. Chem., 100 (1996) 14137. 11. C. M. Sanchez-Sanchez, J. Rodriguez-Lopez, A. J. Bard, 2008, Ch.9. 12. R. D. Martin, P. Unwin, J. Chem. Soc. , Faraday Trans., 94 (1998) 753.
13. R. S. Lillard, P. J. Moran, H. S. Isaacs, J. Electrochem. Soc., 139 (1992) 1007. 14. F. Zou, D. Thierry, H. S. Isaacs, J. Electrochem. Soc., 144 (1997) 1957.
15. V. M. Huang, S. L. Wu, M. E. Orazem, N. Pebere, B. Tribollet, V. Vivier, Electrochim. Acta, 56 (2011) 8048.
16. C. Gabrielli, in I.Rubinstein (Ed.), Physical electrochemistry. Principles, methods, and applications, Marcel Dekker, New-York, 1995, Ch.6.
17. M. E. Orazem, B. Tribollet, Electrochemical Impedance Spectroscopy, John Wiley & Sons, Hoboken, New Jersey, 2008.
18. I. Annergren, D. Thierry, F. Zou, J. Electrochem. Soc., 144 (1997) 1208. 19. G. Galicia, N. Pebere, B. Tribollet, V. Vivier, Corros. Sci., 51 (2009) 1789. 20. I. Dehri, R. L. Howard, S. B. Lyon, Corros. Sci., 41 (1998) 141.
21. G. Baril, C. Blanc, M. Keddam, N. Pebere, J. Electrochem. Soc., 150 (2003) B488-B493.
22. L. V. S. Philippe, G. W. Walter, S. B. Lyon, J. Electrochem. Soc., 150 (2003) B111-B119.
23. J. B. Jorcin, E. Aragon, C. Merlatti, N. Pebere, Corros. Sci., 48 (2006) 1779.
24. I. Frateur, V. M. Huang, M. E. Orazem, B. Tribollet, V. Vivier, J. Electrochem. Soc., 154 (2007) C719-C727.
25. I. Frateur, V. M.-W. Huang, M. E. Orazem, N. Pebere, B. Tribollet, V. Vivier, Electrochim. Acta, 53 (2008) 7386.
26. E. Bayet, F. Huet, M. Keddam, K. Ogle, H. Takenouti, Electrochim. Acta, 44 (1999) 4117.
27. E. Bayet, F. Huet, M. Keddam, K. Ogle, H. Takenouti, J. Electrochem. Soc., 144 (1997) L87-L90.
28. L. F. Jaffe, R. Nuccitelli, J Cell Biol, 63 (1974) 614.
29. B. Vuillemin, X. Philippe, R. Oltra, V. Vignal, L. Coudreuse, L. C. Dufour, E. Finot, Corros. Sci., 45 (2003) 1143.
30. A. M. Simoes, A. C. Bastos, M. G. Ferreira, Y. Gonzalez-Garcia, S. Gonzalez, R. M. Souto, Corros. Sci., 49 (2007) 726.
31. R. M. Souto, Y. Gonzalez-Garcia, A. C. Bastos, A. M. Simoes, Corros. Sci., 49 (2007) 4568.
32. R. M. Souto, B. Normand, H. Takenouti, M. Keddam, Electrochim. Acta, 55 (2010) 4551.
33. M. M. Lohrengel, S. Heiroth, K. Kluger, M. Pilaski, B. Walther, Electrochim. Acta, 51 (2006) 1431.
34. M. Sanchez, J. Gamby, H. Perrot, D. Rose, V. Vivier, Electrochem. Commun., 12 (2010) 1230.
35. V. M.-W. Huang, V. Vivier, M. E. Orazem, N. Pebere, B. Tribollet, J. Electrochem. Soc., 154 (2007) C99-C107.
36. V. M.-W. Huang, V. Vivier, I. Frateur, M. E. Orazem, B. Tribollet, J. Electrochem. Soc., 154 (2007) C89-C98.
37. V. M.-W. Huang, V. Vivier, M. E. Orazem, N. Pebere, B. Tribollet, J. Electrochem. Soc., 154 (2007) C81-C88.
38. S. L. Wu, M. E. Orazem, B. Tribollet, V. Vivier, J. Electrochem. Soc., 156 (2009) C214-C221.
39. C. Gabrielli, M. Keddam, N. Portail, P. Rousseau, H. Takenouti, V. Vivier, J. Phys. Chem. B, 110 (2006) 20478.
41. J. B. Jorcin, M. E. Orazem, N. Pebere, B. Tribollet, Electrochim. Acta, 51 (2006) 1473. 42. J. Newman, J. Electrochem. Soc., 113 (1966) 1235.
43. W. H. Smyrl, J. Newman, J. Electrochem. Soc., 119 (1972) 208.
44. C. Blanc, M. E. Orazem, N. Pebere, B. Tribollet, V. Vivier, S. Wu, Electrochim. Acta, 55 (2010) 6313.
45. L. Lacroix, C. Blanc, N. Pebere, B. Tribollet, V. Vivier, J. Electrochem. Soc., 156 (2009) C259-C265.
Figure Captions
Figure 1: Optical image of a silver tri-electrode used for LEIS measurement. Each wire is
100 µm in diameter.
Figure 2: Current and potential distributions in the vicinity of an inlaid disk electrode. Figure 3: Local normal and local radial impedances (a), and local normal and local radial
interfacial impedances (b) calculated above the electrode surface (at a distance y = 100 µm) close to the center of the disk (r = 100 µm) with C0 = 10 µF and κ = 0.01 S/cm.
Figure 4: Local normal and local total impedances (a); and local normal and local total
Ohmic impedances (b) calculated above the electrode surface (at a distance y = 100 µm) close to the center of the disk (r = 100 µm) with C0 = 10 µF and κ = 0.01 S/cm.
Figure 5: Local normal, local radial, and local total impedances (a), and local normal, local
radial, and local total interfacial impedances (b) calculated above the electrode surface (at a distance y = 100 µm) close to the edge of the disk (r = 0.24 cm) with C0 = 10 µF and κ =
0.01 S/cm.
Figure 6: Local normal, local radial, and local total Ohmic impedances calculated above the
electrode surface (at a distance y = 100 µm) close to the edge of the disk (r = 0.24 cm) with C0 = 10 µF and κ = 0.01 S/cm; zoom on the local total Ohmic impedance.
Figure 7: Global impedance measurements (successive experiments) on a Pt electrode
immersed in a ferri/ferrocyanide solution with the tri-electrode close to the electrode center or close to the electrode edge and without the tri-electrode.
Figure 8: Local normal (a) and local radial impedances (b) experimentally obtained at the
center and close to the edge of the electrode in ferri/ferrocyanide solution at the equilibrium potential.
Figure 9: Simulation of local normal (a) and local radial (b) impedances at the center and
close to the edge for a faradaic system involving diffusion; (c) zoom of the local radial impedance close to the edge. Calculations were performed with D = 10-5 cm2/s, k0 = 10-3 cm/s,
α = 0.5, Cox = Cred = 10-2 mol/l, a tip-to-substrate distance of 100 µm, an interelectrode
distance of 100 µm, C0 = 10 µF and κ = 0.01 S/cm.
Figure 10: Experimental local normal ohmic impedance (a) and local radial (b) impedances
at the center and close to the edge in ferri/ferrocyanide solution at the equilibrium potential.
Figure 11: Simulation of local normal ohmic impedance (a) and local radial (b) impedances
at the center and close to the edge for a faradaic system involving diffusion. Same conditions than for Fig. 9.
Figure 1: Current and potential distributions in the vicinity of an inlaid disk electrode.
y
r
Local current
n i =i r r n r i = +i i r r rFigure 2: Optical image of a silver tri-electrode used for LEIS measurement. Each wire is
100 µm in diameter.
Figure 3: Local normal and local radial impedance (a), and local normal and local radial
local interfacial impedance (b) calculated above the electrode surface (at a distance y = 100 µm) close to the center of the disk (r = 100 µm) with C0 = 10 µF and κ = 0.01 S/cm.
Figure 4: Local normal and local total impedance (a); and local normal and local total
Ohmic impedance (b) calculated above the electrode surface (at a distance y = 100 µm) close to the center of the disk (r = 100 µm) with C0 = 10 µF and κ = 0.01 S/cm.
Figure 5: Local normal, local radial, and local total impedance (a), and local normal, local
radial, and local total interfacial impedance (b) calculated above the electrode surface (at a distance y = 100 µm) close to the edge of the disk (r = 0.24 cm) with C0 = 10 µF and κ =
Figure 6: Local normal, local radial, and local total Ohmic impedance calculated above the
electrode surface (at a distance y = 100 µm) close to the edge of the disk (r = 0.24 cm) with C0 = 10 µF and κ = 0.01 S/cm; zoom on the local total Ohmic impedance.
Figure 7: Global impedance measurements on a Pt electrode immersed in a
ferri/ferrocyanide solution. The disk electrode was not polished nor electrochemically activated in order to decrease the rate of the electron exchange reaction (larger charge transfer resistance). These three successive experiments were performed without a trielectrode in solution or with the probe close to the electrode center or close to the electrode edge.
Figure 8: Local normal impedance (a) and local radial impedance (b) at the center and close
Figure 9: Simulation of local normal (a) and local radial (b) impedance responses at the
center and close to the edge for a faradaic system involving diffusion; (c) zoom of the local radial impedance close to the edgde.
Figure 10: Simulation of local ohmic impedance normal (a) and local radial (b) impedance
Figure 11: Simulation of local ohmic impedance normal (a) and local radial (b) impedance