HAL Id: hal-01611406
https://hal.archives-ouvertes.fr/hal-01611406
Submitted on 5 Oct 2017HAL is a multi-disciplinary open access archive for the deposit and dissemination of sci-entific research documents, whether they are pub-lished or not. The documents may come from teaching and research institutions in France or abroad, or from public or private research centers.
L’archive ouverte pluridisciplinaire HAL, est destinée au dépôt et à la diffusion de documents scientifiques de niveau recherche, publiés ou non, émanant des établissements d’enseignement et de recherche français ou étrangers, des laboratoires publics ou privés.
Distributed under a Creative Commons Attribution - ShareAlike| 4.0 International License
Report on developing bottom-up Marginal abatement
cost curves (MACCS) for representative farm type
Vera Eory, M. Macleod, Philippe Faverdin, D. O’Brien, R. de Oliveira Silva,
L. G. Barioni, T. Z. Albertini, K. Topp, F. A. Fernandes, D. Moran, et al.
To cite this version:
Vera Eory, M. Macleod, Philippe Faverdin, D. O’Brien, R. de Oliveira Silva, et al.. Report on devel-oping bottom-up Marginal abatement cost curves (MACCS) for representative farm type. [Contract] 11.2, UE;Union Européenne. 2015, 129 p. �hal-01611406�
1
ANIMALCHANGE
SEVENTH FRAMEWORK PROGRAMME
THEME 2: FOOD, AGRICULTURE AND FISHERIES, AND
BIOTECHNOLOGIES
Grant agreement number: FP7- 266018
DELIVERABLE
11.2
Report on developing bottom-up Marginal Abatement Cost Curves
(MACCS)
for representative farm types
Abstract
:Developing efficient policy instruments and incentive schemes to promote the uptake of greenhouse gas mitigation measures requires some kind of prioritisation of the mitigation measures. An important consideration in this process is the estimated cost and cost-efficiency the measures. The high number of reports done in developed countries show a high variability in the country-level cost-effectiveness estimates, and suggest that approaches providing higher granularity at the spatial and farm type could suit better to the purpose of regional policy development. At the same time, there is still a gap in our understanding of economic mitigation potential of agriculture in developing and newly industrialised countries.
To address these questions this report presents three studies. The first is a literature review of the cost-effectiveness estimates of mitigation measures published in the past 15 years, discussing the variability in these estimates. The second study reports on marginal abatement cost curves for beef cattle production in Brazil. Finally, the last report presents the conceptual basis of a tool to assess the financial implications of the mitigation measures to be used in parallel with the FarmAC model, ultimately providing mitigation measure cost-effectiveness estimates specific to individual farms. Additionally, it describes the selection of mitigation measures which have been assessed at the farm level in Component 3 of the AnimalChange project.
2
Due date of deliverable:
M30
Actual submission date:
M50
Start date of the project: March 1
st, 2011
Duration: 48 months
Organisation name of lead contractor:
SRUC
Revision:
V1
Dissemination level:
PU
Authors:
Eory, V. (SRUC), M. MacLeod (SRUC), P. Faverdin (INRA), D. O’Brien
(TEAGASC), R. de Oliveira Silva (SRUC), L. G. Barioni (EMBRAPA), T.
Z. Albertini (EMBRAPA), K. Topp (SRUC), F. A. Fernandes, D. Moran
(SRUC), N. Hutchings (AU), M. Stienezen (DLO), L. Shalloo
(TEAGASC), R. M. Rees (SRUC), Lisbeth Mogensen (AU), Peter Lund
(AU), Maike Brask (AU), M. Doreau (INRA), F. Garcia-Launay (INRA), J.
Y. Dourmad (INRA), A. B. Bendahan (EMBPRAPA), R. F. Veloso
3
Table of Contents
1. INTRODUCTION 5
2. LITERATURE REVIEW OF THE COST-EFFECTIVENESS ESTIMATES OF
GHG MITIGATION MEASURES 7
2.1 INTRODUCTION 7
2.2 METHODOLOGY 7
2.3 RESULTS 8
2.4 DISCUSSION 16
3. MARGINAL ABATEMENT COST CURVES FOR BEEF PRODUCTION IN
THE BRAZILIAN CERRADO 19
3.1 INTRODUCTION 19
3.2 METHODOLOGY 19
3.3 RESULTS AND DISCUSSION 20
4. COST-EFFECTIVENESS ASSESSMENT OF MITIGATION OPTIONS ON
MODEL FARMS 21
4.1 INTRODUCTION 21
4.2 IDENTIFICATION AND DESCRIPTION OF THE MITIGATION OPTIONS FOR MODELLING 21
4.2.1 Initial selection for modelling 21
4.2.2 Selection of five best mitigation options by farm experts 22
4.2.3 Selection for modelling across farm types 26
4.2.4 Description of mitigation options for biophysical and economic modelling 29
4.3 METHODOLOGY 41
4
4.3.2 Description of the farms and the financial data 42
4.4 RESULTS 47
4.5 CONCLUDING REMARKS 52
REFERENCES 54
APPENDIX 1: LIST OF STUDIES REVIEWED 57
APPENDIX 2: LONG LIST OF MITIGATION MEASURES 60
APPENDIX 3: OVERVIEW OF THE STUDIES 63
APPENDIX 4: MARGINAL ABATEMENT COST CURVES FOR BEEF
PRODUCTION IN THE BRAZILIAN CERRADO 65
APPENDIX 5: MITIGATION OPTIONS – BRIEF DESCRIPTIONS FOR
BIOPHYSICAL AND ECONOMIC MODELLING 82
APPENDIX 6: DETAILED DESCRIPTION OF MITIGATION OPTIONS FOR
BIOPHYSICAL AND ECONOMIC MODELLING 89
REDUCING N FERTILISATION 89
NITRIFICATION INHIBITORS: THE ROLE OF DCD IN REDUCING N2O EMISSIONS AND NO3
-LEACHING 96
MORE LEGUMES IN GRASS SWARDS 101
FEEDING MORE MAIZE AND LESS GRASS 105
FEEDING MORE FAT WITH RUMINANTS 109
ADDITIVE NITRATE 112
BALANCE AMINO ACIDS AND REDUCE CP IN PIGS 115
GENETIC IMPROVEMENT OF DAIRY CATTLE 119
AGROFORESTRY 122
5
1. Introduction
Agriculture is expected to play a role in reducing greenhouse gas (GHG) concentrations globally. The sector has capacity to contribute to this goal via GHG emission reduction, carbon (C) sequestration and renewable energy (bioenergy production). It is estimated that a total mitigation of 1.5-15.6 Gt CO2e/year (3-31% of the global anthropogenic GHG emissions
of 50 Gt CO2e/year (IPCC 2014)) could be achieved in agriculture and the land use and
forestry sectors (Smith et al. 2013), with the economic potential in agriculture alone (and excluding bioenergy production) being 1.5-4.3 Gt CO2e/year (Smith et al. 2008). This latter
mitigation is to be achieved on farms by modifying current management practices, like improving nutrient management, restoring soils, administering feed additives to livestock and increasing the rate of genetic improvement both crops and livestock. However, agri-environmental policies are necessary to be developed to encourage the uptake of mitigation measures by farmers, either supporting the voluntary uptake or introducing compulsory regulations.
The heterogeneity of farms and farming conditions and the difficulty in estimating the mitigation on farms mean that market-based instruments (like carbon tax) can be very costly to set up in the agricultural sector. Reinforced by the complexity of international negotiations, this makes voluntary or targeted obligatory regulations favoured over market-based instruments (Beddington et al. 2012, Kasterine and Vanzetti 2010). Such policy instruments (often developed at national or sub-national level) require some kind of prioritisation of the mitigation measures, and an important input in this process is the cost-efficiency estimates of the measures, preferably specific to country/region, farm type, farm size and biophysical conditions (e.g. soil and climate).
A number of reports and scientific papers have estimated the mitigation potential and cost-efficiency of various measures, usually at a country-level and often using either economic modelling or bottom-up cost-engineering approaches to calculate the financial consequences of the implementation of the measures (see a typology and a short assessment of these approaches in (Vermont and De Cara 2010)). The measures are usually ranked according to their effectiveness, and those are considered to be economically efficient of which cost-effectiveness is lower than the marginal benefits from emission reduction. This is approximated by a carbon price threshold, for example, in the UK by the social price of carbon (Price et al. 2007).
The bottom-up cost-engineering approach is well suited to give a detailed assessment of the mitigation measures (Kesicki and Strachan 2011), and therefore give specific advice to policy development. Still, the amount of evidence about the cost-efficiency of mitigation measures, especially when disaggregated to farm types or geographical regions, is small, as most of the studies work on the basis of country averages. Examples for the latter include numerous work on MACCs for agriculture in the European Union, New Zealand, France, Ireland and UK (Bates et al. 2009, MacLeod et al. 2010, Pape et al. 2008, Pellerin et al. 2013, Schulte et al. 2012), while papers presenting evidence on the difference between regions or farm types are less abundant (see examples for the US (Biggar et al. 2013) and France (De Cara and Jayet 2000, Dequiedt et al. 2014)).
A literature review in this deliverable investigates the cost-effectiveness estimates of mitigation measures published in the past 15 years, discussing the variability in these estimates and highlighting research gaps (Section 2). Furthermore, a study is presented in the deliverable aiming to advance our knowledge on mitigation measures beyond the developed countries, reporting on marginal abatement cost curves for beef cattle production in Brazil (Section 3).
6 The wide differences in the cost-effectiveness estimates across the studies suggest that regional, farm type level, or even individual farm level assessments might better suit to inform regional policy development and decision makers on farms about potential mitigation options. However, given the well-known trade-off between complexity and accuracy, modelling tools which can be widely used in the farming community would be less accurate in their emission and cost estimates than models requiring detailed information. One approach to this problem is a tool which can be operated by people with expertise in both modelling and in the farming practices of a region. Such a tool, namely the FarmAC model, has been developed in the AnimalChange project to assess the nutrient flows and GHG emissions of the farms. Section 4 of this deliverable presents the conceptual basis of a tool to assess the financial implications of the mitigation measures to be used in parallel with the FarmAC model, ultimately providing mitigation measure cost-effectiveness estimates specific to individual farms.
7
2. Literature
review
of
the
cost-effectiveness
estimates of GHG mitigation measures
This section is partially based on (MacLeod and Eory 2014).
2.1 Introduction
The potential role agriculture can play in the global climate change mitigation effort is now well known. Some improvements in the emissions intensity of agricultural output have already been made as a result of increased resource use efficiency and regulations to lower nitrogen and phosphorous emissions. Still, identifying technically effective, economically efficient, and socially acceptable mitigation options remains a challenge. The cost-effectiveness of mitigation practices is often highly variable, being very dependent on location, weather, existing farm practices, etc. This section reviews the international literature on the cost-effectiveness of GHG mitigation measures, focusing on supply-side technical measures to be implemented on farm.
2.2 Methodology
A literature review was carried out to analyse the cost-effectiveness estimates of agricultural mitigation measures published within the past 15 years. The review included studies which assessed a set of mitigation measures at the same time as opposed to evaluating a single mitigation measure. Studies varied in terms of their geographical scope and sectoral scope, some being multi-sectoral, others analysing agriculture only. The list of the 37 studies reviewed is presented in Appendix 1: List of studies reviewed.
The following characteristics of the studies were recorded: - geographical scope (e.g. global, EU-15, the Netherlands)
- geographical resolution (e.g. world regions, countries, sub-national regions, farms) - boundaries of emission sources (on-farm versus life cycla analysis (LCA))
- interactions between measures considered or not
- MACC methodology (using the classification of Vermont and De Cara (2010), i.e. equilibrium models, micro-economic modelling, bottom-up cost-engineering MACCs) - Cost-effectiveness (CE) results for individual measures are available or not
262 agricultural activities were identified as mitigation measures. This list was based on the long mitigation measure list compiled in Moran et al. (2008), complemented with any additional mitigation measure found in the studies reviewed. The mitigation measures were aggregated into 8 categories, and 22 sub-categories were also introduced to give a better overview of the measures. The categories were the following (the number of subcategories within each category is in brackets): cropland management (6), grazing land management (3), management of organic soils (0), restoration of degraded lands (0), livestock management (5), livestock housing and manure (3), land use change (0) and energy efficiency (5).
To avoid duplication, mitigation measures which were applicable both to cropland and grazing land were allocated to cropland management (in most cases these measures are not disaggregated in the studies). Due to the difference in the scope of the mitigation measures between studies, in some cases aggregate mitigation measures are listed alongside the more specific ones, for example both ‘Dietary additives in general’ and ‘Ionophores’ are measures. The list of the mitigation measures is presented in Appendix 2: Long list of mitigation measures.
8 The mitigation measures included in each of the studies were recorded to obtain a frequency table, showing in how many studies each mitigation measure was included. In some specific cases a mitigation measure analysed in a study was a composite of two or three different, though related mitigation measures. In this case it was recorded under all of the relevant mitigation measures, assuming that the CE value, if provided, applied to all mitigation measures.
To obtain the range of the CE results for mitigation measures, those studies had to be selected which reported data on the CE of individual mitigation measures. Due to the methodological differences, mitigation measure specific CE estimates were only available from bottom-up cost-engineering studies. Those mitigation measures for which three or more studies made CE estimates available were selected for further data collection, whereby the CE values were recorded. If a study provided more than one CE estimate for a mitigation measure, then the lowest and highest estimates were recorded. Otherwise the single value was recorded as both the lowest and the highest value. Finally, the CE data were converted to a common metric (EUR/tCO2e). From this part of the analysis the rice cultivation measures
were excluded, as they have very low relevance to the regions the AnimalChange project was looking at (i.e. Europe, Sub-Saharan Africa and South America).
2.3 Results
From the 37 studies reviewed, 10 were global, 17 targeted the European Union or European countries, three the United States, four Australia or New Zealand, two reviewed Kyoto Annex I countries and one reported on Asian countries (see Appendix 3: Overview of the studies). Regarding the geographical resolution, most of the studies (21) were reporting at a country or sub-national level, while 10 studies presented results at the global and regional scale and 6 other studies were farm-level work. The majority of the studies (30) considered on-farm emissions only. About half of the studies (19) addressed the issue of interactions between the measures (i.e. when the mitigation potential and/or cost of a measure changes either positively or negatively if another mitigation measure is also implemented on the farm), either accounting for the synergies and trade-offs directly (13 studies), or allocating the mitigation measures so that they are assumed not to be implemented simultaneously on the same farms (6 studies). Seven studies did not take into account interactions, and a further 11 did not specify if or how interactions had been dealt with.
Five studies used equilibrium models to calculate the mitigation potential, 8 applied supply-side micro-economic models, and the rest (24) used some form of bottom-up cost-engineering method (this category included studies relying on cost estimates produced by whole-farm bio-economic models and also studies drawing from expert opinion). CE estimates of individual mitigation measures were only available in 11 bottom-up cost-engineering studies, as the rest presented results in an aggregated way, so CE data on individual measures could not be derived from it. Those eleven studies (see their characteristics Table 1) were used to analyse the range of CE estimates for selected mitigation measures.
Table 1 Overview of the eleven studies where CE data were available for individual mitigation measures
ID Scope Resolution Emission
boundariesa Interactions
b GHG gases/sinks
considered
2 Global World region On-farm Yes N2O and CH4
10 NW Germany Farm On-farm Not specified N2O, CH4 and CO2
11 EU-27 Country On-farm No simultaneous
implementation N2O and CH4
14 New Zealand Country On-farm Not specified N2O and CH4
15 UK Country On-farm Yes N2O, CH4, CO2and
9
ID Scope Resolution Emission
boundariesa Interactions
b GHG gases/sinks
considered
18 EU-27 World region On-farm Not specified N2O and CH4
22 Global World region On-farm Yes N2O and CH4
23 Kyoto Annex I
countries Country
Some LCA
elements Yes N2O and CH4
28 Ireland Country On-farm and
LCA Yes
N2O, CH4, CO2and
soil C
32 USA Farm On-farm Not specified N2O, CH4, CO2and
soil C
33 France Country Some LCA
elements Yes
N2O, CH4, CO2and
soil C
a
‘On-farm’: emissions within the farm gate are considered, On-farm + other: some off-farm emissions are considered, ‘LCA’: off-farm emissions (usually pre-farm or up to the retailers) are considered
b
‘Yes’: interactions between mitigation measures are taken into account, ‘Measure allocation’: mitigation measures are allocated so that simultaneous implementation of measures do not happen, ‘No’: interactions are not taken into account, ‘Not specified’: the study does not specify whether interactions are considered
The eleven selected studies reported on 9 to 26 mitigation measures each, all combined assessing 100 different mitigation measures out of the 262 identified measures. The mitigation measures’ frequency table (Table 2) shows how many mitigation measures within a category or sub-category were evaluated by a particular study. It also shows how many mitigation measures a category/sub-category contained (column ‘MM all’) and how many of these measures were mentioned in the studies (column ‘MM assessed’). The one but last column (‘Total frequency’) presents the number of mitigation measures assessed across the eleven studies, i.e. the sum of the eleven study columns. The last column (‘Relative frequency’) shows how well a category/sub-category is represented (Relative frequency = Total frequency / MMs all). For example, the sub-category ‘Agronomy’ contains 13 different mitigation measures (‘MM all’); out of these 13 measures 8 appeared in at least one of the eleven studies (‘MM assessed’). Five studies assessed measures belonging to ‘Agronomy’: Study 11, Study 15, Study 28, Study 32 and Study 33 (e.g. Study 11 evaluated one, Study 33 evaluated three). Altogether, the sub-category ‘Agronomy’ appeared 9 times in the studies (‘Total frequency’), so the representation of this sub-category is 1.1.
There is a wide range in how well categories and sub-categories are represented. The most frequently appearing sub-category is ‘Nutrient management’ on croplands: from its 36 mitigation measures 22 are included in the eleven studies, altogether assessed 52 times. Another three well-represented sub-categories are ‘Feeding practices’, ‘Anaerobic digestion and CH4 capture’ and ‘Rice management’; the mitigation measures within these
sub-categories appear 22, 19 and 18 times, respectively, across the studies. On the other end of the spectrum are categories and sub-categories which are not at all, or just marginally explored in these studies: ‘Structural and management changes’ (Cropland), ‘Orchards’, ‘Fire management’, ‘Management of organic soils’, ‘Restoration of degraded lands’, ‘Animal health’, ‘Housing’, ‘Land use change’ and ‘Energy and waste’.
Particular mitigation measures were popular and appeared in multiple studies, like measures in the sub-category ‘Anaerobic digestion and CH4 capture’: the four mitigation measures
listed there were together assessed 19 times (‘On-farm AD’ was evaluated in all of the eleven studies, and ‘Centralised AD’ were assessed in six studies), thus the relative frequency of this sub-category was 3.8. Also popular were measures from the sub-categories ‘Nutrient management’, ‘Grazing intensity and timing’, ‘Rice management’ and ‘Feeding practices’. However, almost two thirds of the mitigation measures (62 out of the 100) were assessed only in a single study. 18 measures were assessed in two studies and another 18 in three to six studies, while two measures appeared in 10 or 11 out of the eleven studies (these measures were ‘Nitrification inhibitors’ and ‘On-farm AD’).
10 Table 2 Frequency table of the mitigation measures as they appear in the eleven selected studies
Mitigation category / sub-category MM alla
MM assessedb
Frequency of MMs within each category/sub-category by studyc Total frequencyd
Relative frequency ID: 2 10 11 14 15 18 22 23 28 32 33
Cropland management total 81 47 9 5 7 1 15 4 15 7 6 9 12 90 1.1
Agronomy 13 8 0 0 1 0 2 0 0 0 1 2 3 9 0.7
Nutrient management 36 22 3 4 4 1 11 4 6 4 4 4 7 52 1.4
Structural and management changes 4 2 0 1 0 0 0 0 0 0 0 1 0 2 0.5
Soil and water management 11 4 0 0 1 0 2 0 1 0 1 2 2 9 0.8
Rice management 15 11 6 0 1 0 0 0 8 3 0 0 0 18 1.2
Orchards 2 0 0 0 0 0 0 0 0 0 0 0 0 0 0.0
Grazing land management total 21 11 1 1 0 2 1 3 0 0 2 2 5 17 0.8
Grazing intensity and timing 7 6 1 1 0 1 0 2 0 0 1 0 3 9 1.3
Increased productivity 13 5 0 0 0 1 1 1 0 0 1 2 2 8 0.6
Fire management 1 0 0 0 0 0 0 0 0 0 0 0 0 0 0.0
Management of organic soils total 6 1 0 0 1 0 0 0 0 0 0 0 0 1 0.2
Restoration of degraded lands total 9 0 0 0 0 0 0 0 0 0 0 0 0 0 0.0
Livestock management total 76 24 11 3 1 5 7 4 2 1 2 0 4 40 0.5
Feeding practices 21 10 6 3 1 1 3 2 0 1 0 0 3 20 1.0
Specific agents and dietary additives 25 5 1 0 0 2 1 0 2 0 0 0 1 7 0.3
Animal health 5 0 0 0 0 0 0 0 0 0 0 0 0 0 0.0
Structural and management changes 10 3 2 0 0 1 0 1 0 0 0 0 0 4 0.4
Animal breeding, genetics, herd structure 15 6 2 0 0 1 3 1 0 0 2 0 0 9 0.6
Housing and manure total 36 13 2 5 2 1 3 3 4 2 1 5 3 31 0.9
Housing 10 1 0 1 0 0 0 0 0 0 0 0 0 1 0.1
Manure storage and handling 21 9 0 3 0 0 1 1 2 0 0 3 1 11 0.5
Anaerobic digestion and CH4 capture 5 3 2 1 2 1 2 2 2 2 1 2 2 19 3.8
Land use change total 13 2 0 0 0 0 0 0 0 0 1 1 0 2 0.2
Energy and waste 20 2 0 0 0 0 0 0 0 0 0 0 2 2 0.1
Transport 2 1 0 0 0 0 0 0 0 0 0 0 1 1 0.5
Heating and electricity 7 1 0 0 0 0 0 0 0 0 0 0 1 1 0.1
Waste 2 0 0 0 0 0 0 0 0 0 0 0 0 0 0.0
Electricity generation 8 0 0 0 0 0 0 0 0 0 0 0 0 0 0.0
Other energy and waste 1 0 0 0 0 0 0 0 0 0 0 0 0 0 0.0
TOTAL 262 100 23 14 11 9 26 14 21 10 12 17 26 183 0.7
a
Number of mitigation measures grouped into the category/sub-category; MM: mitigation measure b
Number of mitigation measures in the category/sub-category mentioned at least once across the eleven studies c
Number of mitigation measures within a category or sub-category which were evaluated by a particular study d
11
Figure 1 Cost-effectiveness of mitigation measures (dotted line: notional carbon price, n: number of studies providing information)
Figure 2 Cost-effectiveness of mitigation measures (dotted line: notional carbon price, n: number of studies providing information)
-4 -3 -2 -1 0 1 2 3 4 5 6 Catch/cover crops (n=2) Precision farming (n=4) Avoiding N excess (adjusting yield targets) (n=4) Full allowance of manure N supply (n=2) Reduce N fertiliser (n=5) Improved timing of manure application (n=3) Improved timing of mineral N application (n=3) C o st -e ff e ct iv e n e ss ( € /t C O2 e ) -4 -3 -2 -1 0 1 2 3 4 5 6 Placing N precisely in soil (n=3) Nitrification inhibitors (n=10) Biological N fixation (legumes in rotations) (n=2) Improved maintenance of fertiliser spreaders (n=3) Fertiliser free zone on field edges (n=3) Reduced tillage (n=4) No-till (n=3) C o st -e ff e ct iv e n e ss ( € /t C O2 e ) 106 105 104 1,000 100 10 0 -10 -100 -1,000 -104 106 105 104 1,000 100 10 0 -10 -100 -1,000 -104
12
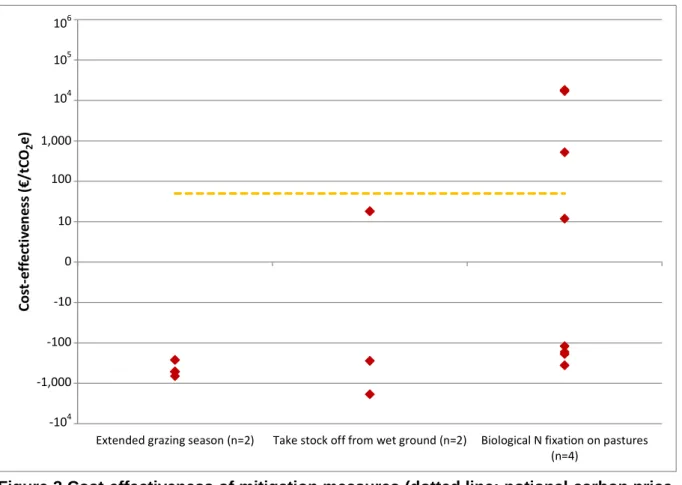
Figure 3 Cost-effectiveness of mitigation measures (dotted line: notional carbon price, n: number of studies providing information)
Figure 4 Cost-effectiveness of mitigation measures (dotted line: notional carbon price, n: number of studies providing information)
-4 -3 -2 -1 0 1 2 3 4 5 6
Extended grazing season (n=2) Take stock off from wet ground (n=2) Biological N fixation on pastures (n=4) C o st -e ff e ct iv e n e ss ( € /t C O2 e ) -4 -3 -2 -1 0 1 2 3 4 5 6 Feeding more concentrates (n=3) High starch diet (n=3)
High fat diet (dietary lipids) (n=4) Improved feed intake (n=3) Bovine somatotrophin (n=2) Ionophores (e.g. monensin) (n=2) Propionate precursors (n=2) C o st -e ff e ct iv e n e ss ( € /t C O2 e ) 106 105 104 1,000 100 10 0 -10 -100 -1,000 -104 106 105 104 1,000 100 10 0 -10 -100 -1,000 -104
13
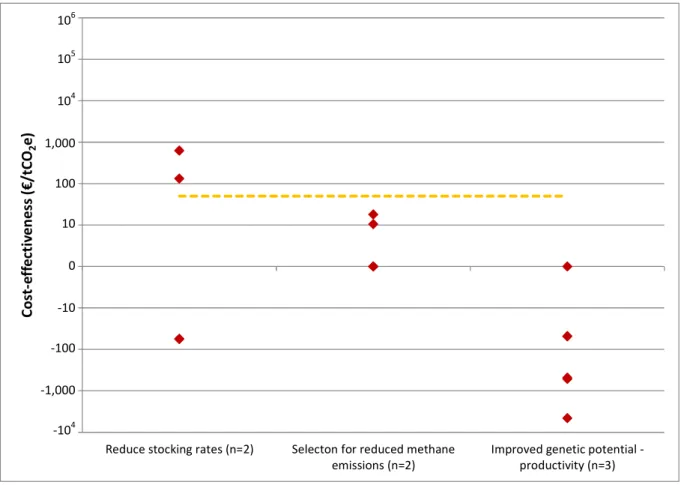
Figure 5 Cost-effectiveness of mitigation measures (dotted line: notional carbon price, n: number of studies providing information)
Figure 6 Cost-effectiveness of mitigation measures (dotted line: notional carbon price, n: number of studies providing information)
-4 -3 -2 -1 0 1 2 3 4 5 6
Reduce stocking rates (n=2) Selecton for reduced methane emissions (n=2)
Improved genetic potential -productivity (n=3) C o st -e ff e ct iv e n e ss ( € /t C O2 e ) -4 -3 -2 -1 0 1 2 3 4 5 6
Covering slurry stores (n=3)
Centralised AD (n=6) On-farm AD (n=11) Methane capture and combustion (n=2) C o st -e ff e ct iv e n e ss ( € /t C O2 e ) 106 105 104 1,000 100 10 0 -10 -100 -1,000 -104 106 105 104 1,000 100 10 0 -10 -100 -1,000 -104
14 Lowest and highest cost-effectiveness estimates were recorded for those mitigation measures (less rice cultivation related measures) which appeared at least in two studies, i.e. for 31 mitigation measures. These estimates are presented on Figure 1 – Figure 6 (note the log scale on the y axis). The dotted horizontal line represents a notional carbon price of € 50 tCO2e-1, and the number of studies providing estimates for each measure is indicated in the
legend under the x axis. The range of cost-effectiveness estimates for almost all mitigation measures is strikingly wide; the majority of the mitigation measures have both positive and negative values (negative values meaning cost savings), and in most cases the estimates can differ by two or three orders of magnitude or more. There are a number of reasons for the variability between studies. One is the differences in the modelling and calculation approaches the studies use. For example, LCA calculations might attribute very different GHG mitigation potential to certain measures than on-farm GHG calculations do. Another methodological difference which can result in high variability in the cost-effectiveness estimates is the way the interactions are considered. In some studies the mitigation potentials of the measures targeting the same emission source are reduced cumulatively, thus increasing the cost-effectiveness of the measures. An example is the measure ‘Biological fixation’ in Moran et al. (2008), which has a cost-effectiveness of £43 tCO2e-1 in
2022 if considered on its own (‘stand-alone cost-effectiveness’), but becomes very expensive (€13,435 tCO2e-1) if other measures targeting soil N2O emissions are implemented prior to it.
In studies where the issue of interactions is dealt with an allocation assumption (i.e. assuming that one each farm only one mitigation measure is implemented to tackle a particular emission source) the mitigation potential of the measures and therefore their cost-effectiveness is not affected. Other drivers of the variability between studies are the difference in geographical locations they cover, the different farm sizes they might use as an average, and further differences in key assumptions about the biophysical efficiency and the financial implications of the measure.
All of the studies reports more than one cost-efficiency estimates for at least one-third of the mitigation measures. In 4 studies all the mitigation measures have more than one cost-effectiveness estimate. The disaggregation is most often done on a spatial basis, e.g. for world regions in global studies (Graus et al. 2004, Hasegawa and Matsuoka 2010), for countries in EU studies (Amann et al. 2008, Bates et al. 2009, Hoglund-Isaksson et al. 2010) or for states in the case of United States (Biggar et al. 2013). It is also common to differentiate – at least for some mitigation measures, like those related to animal feeding – between livestock types, e.g. dairy versus beef cattle (Bates et al. 2009, Graus et al. 2004, Moran et al. 2008, Pape et al. 2008, Pellerin et al. 2013). Some further bases for disaggregation include farm types (Weiske and Michel 2007), crop type (Biggar et al. 2013), year of mitigation (Moran et al. 2008), discount rate (Moran et al. 2008, Pape et al. 2008), GHG accounting methodology (Schulte et al. 2012). Pellerin et al. (2013) also reports a range for some of the cost-effectiveness estimates, though the origin of this range is not well explained. Interestingly, the range between the lowest and highest estimates can be wide even within a study, for example, out of the ten mitigation measures recorded from (Biggar et al. 2013) the lowest range of cost-effectiveness estimates is €77 tCO2e-1 (‘Covering slurry
stores’), while the widest range is close to €5,000 tCO2e-1 (‘Nitrification inhibitors’). The
widest range within one study is €7,800 tCO2e-1 for the mitigation measure ‘Reduced tillage’
(Moran et al. 2008).
The mitigation measures can be grouped into three categories according to the range their cost-effectiveness estimates cover:
1. Negative and/or small positive cost-effectiveness: these measures are estimated to have either negative cost-effectiveness (providing savings to the farmers), or have a positive cost-effectiveness which is still lower than a threshold carbon price, meaning that though their implementation would cost money, it would be still a cost-effective way to reduce GHG emissions. Here a carbon price threshold of €50 tCO2e-1 is used
15 2. Small positive and high positive cost-effectiveness: these measures are estimated to cost money to the farmers, and while in some cases still they can be a cost-effective, they might have cost-effectiveness beyond the threshold carbon price, indicating that their implementation might not only be expensive, but would not be economically efficient – though further consideration of additional impacts might make them desirable.
3. Cost-effectiveness estimates in the whole range (negative, small positive, high positive): the cost-effectiveness values reported for these measures span across the whole range, though for some mitigation measures there is a visible tendency with the estimates falling more into one or the other part of the range.
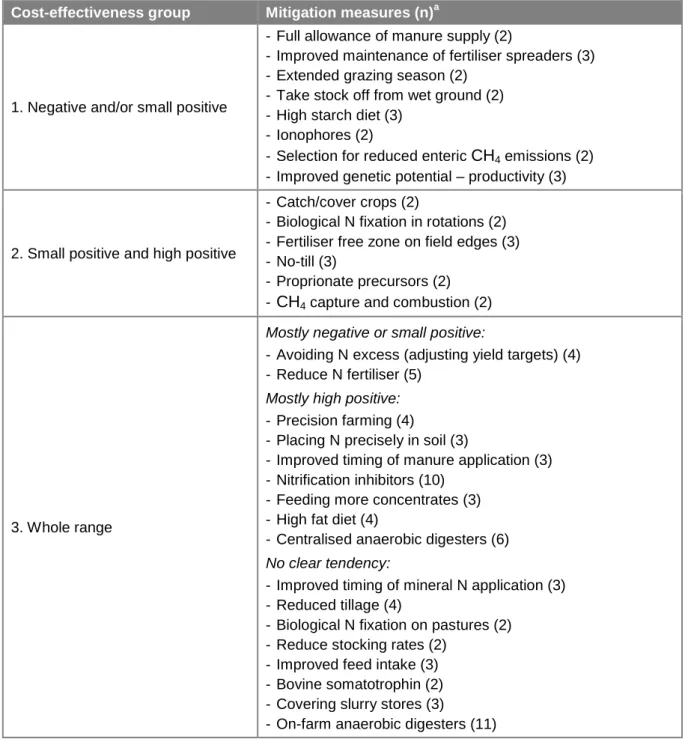
Table 3 Grouping of the mitigation measures according to their cost-effectiveness estimates
Cost-effectiveness group Mitigation measures (n)a
1. Negative and/or small positive
- Full allowance of manure supply (2)
- Improved maintenance of fertiliser spreaders (3) - Extended grazing season (2)
- Take stock off from wet ground (2) - High starch diet (3)
- Ionophores (2)
- Selection for reduced enteric CH4 emissions (2) - Improved genetic potential – productivity (3)
2. Small positive and high positive
- Catch/cover crops (2)
- Biological N fixation in rotations (2) - Fertiliser free zone on field edges (3) - No-till (3)
- Proprionate precursors (2) - CH4 capture and combustion (2)
3. Whole range
Mostly negative or small positive:
- Avoiding N excess (adjusting yield targets) (4) - Reduce N fertiliser (5)
Mostly high positive: - Precision farming (4)
- Placing N precisely in soil (3)
- Improved timing of manure application (3) - Nitrification inhibitors (10)
- Feeding more concentrates (3) - High fat diet (4)
- Centralised anaerobic digesters (6) No clear tendency:
- Improved timing of mineral N application (3) - Reduced tillage (4)
- Biological N fixation on pastures (2) - Reduce stocking rates (2)
- Improved feed intake (3) - Bovine somatotrophin (2) - Covering slurry stores (3)
- On-farm anaerobic digesters (11)
a
16 Approximately half of the mitigation measures’ cost-effectiveness does not spread very wide, seemingly defining clearly whether the measure provides savings (Group 1), or costs money but can be cost-effective (Group 2). The remaining measures have cost-effectiveness estimates in the whole range (Group 3). Among these latter two seem the be mostly cost-effective: ‘Avoiding N excess (adjusting yield targets)’ and ‘Reduce N fertiliser’, while four are usually estimated to be too expensive (‘Precision farming’, ‘Placing N precisely in the soil’, ‘Nitrification inhibitors’, ‘Centralised anaerobic digesters’). The remaining seven measures in this group show no clear tendency.
Important to note that those mitigation measures which fall into Group 1-2 have only a very limited number of estimates recorded, as they are represented only in two, maximum three studies. On the other hand, the mitigation measures which have been assessed in four or more studies all belong to Group 3, i.e. the range of estimates always spreads from negative to high positive.
2.4 Discussion
This review reveals that there are three important areas and issues which are often neglected in studies on the marginal abatement costs and cost-effectiveness of agricultural GHG mitigation. First, mitigation in developing countries have hardly been assessed so far, only a few studies offered estimates for developing countries as part of a global assessment, and one study reported on mitigation in rice production in three Asian countries (Wassmann and Pathak 2007). Still, a significant growth in agricultural production and related GHG emissions are likely to occur in developing nations (Steinfeld et al. 2006), and currently the emission intensity of production in these countries is often higher than in developed countries (MacLeod et al. 2013, Opio et al. 2013). At the same time, food security and poverty alleviation in the face of changing climate and growing population is of utmost importance in these regions (Foresight 2011). Thus, assessing opportunities for mitigating GHG emissions in these regions is a pressing need.
Second, the majority of the studies looked at impacts on emissions within the farm gate, even though changes on farm can have effects on emissions from other parts of the supply chain (like emissions from fertiliser or livestock feed production). Admittedly, exploring sectoral emissions is an important part of planning national and international emission budgets, and by keeping the analysis within the farm gate double-counting of mitigation can be avoided in such an exercise. However, ignoring off-farm emissions poses the risk of emission leakage, for example reducing on-farm enteric methane emissions on a cattle farm by increasing the amount of grains in the feed might result in a net emission increase due to the increased CO2 emissions from related land-use change (Vellinga and Hoving 2011).
Similarly, as demonstrated by Schulte et al. (2012), the cost-effectiveness of the mitigation measures can be very different with different system boundaries; increasing emphasis on cost-effectiveness work done by LCA approaches in the future would help to raise awareness to this problem at the policy level.
Finally, not all agricultural emission sources and sinks are considered equally across the studies. Possibly because of the dominance of N2O and CH4 emissions in the agricultural
sector of the national inventories many studies focus only on these two gases, ignoring CO2
emissions and C sequestration effects. Some studies look at CO2 emissions as well, and a
growing number of studies also take into account long term changes in soil C stock. CO2
emissions related to agricultural energy use are important, specifically within some farm types, like dairy cattle and horticulture. Even more important is the soil C stock change related to agricultural activities, and very often mitigation measures targeting soil C have positive effects on soil structure and climate change adaptation. Agricultural MACCs cannot be complete without these effects and mitigation measures.
17 As presented in Table 2, certain categories and subcategories of mitigation measures are very much favoured across the bottom-up cost-engineering agricultural MACCs, e.g. cropland nutrient management, rice management, grazing intensity and timing, livestock feeding practices, and, particularly, anaerobic digestion and CH4 capture. Others, like organic
soils, animal health, waste and energy use have been very much neglected so far. The popularity of the subcategories is only partly a consequence of the perceived efficacy of the mitigation measures, it is also a function of historic research focus (e.g. many nitrogen related measures have been earlier identified as ways of reducing ammonia emissions and nitrogen leaching) or perceived novelty of the measure (e.g. anaerobic digestion and nitrate feeding). The research gaps highlighted in this review highlight the need for further research. Animal health related mitigation measures can be addressed in bottom-up cost-engineering approaches within the boundaries of the farm gate, while work on organic soils and degraded land necessitates looking beyond current agricultural areas, and waste reduction measures can be best addressed by methods looking at the whole supply chain (cradle to grave LCA analysis).
The cost-effectiveness estimates of the mitigation measures vary greatly both within and between studies. Many drivers of the variability can be explored by comparing the results and the methodologies of the studies, but most of these differences are not clearly stated in the methodology sections of the studies. Beyond the need for clearer description of the studies boundaries and methodologies, an important omission should also be addressed in the future: the lack of uncertainty analysis and sensitivity analysis (though disaggregation by the discount factor can be considered as a sensitivity analysis to the discount factor).
Two measures were identified which showed consistently favourable cost-effectiveness estimates across more than three studies: ‘Avoiding N excess (adjusting yield targets)’ and ‘Reduce N fertiliser’. The latter measure refers to a combination of suboptimal fertilisation (i.e. reducing the N fertiliser amount below the economic optimum) and proportional fertiliser reduction (e.g. 10%, 20%), where the study did not specify whether this reduction is a reduction only in the excess N or beyond that. Admittedly there is a difficulty in drawing clear boundaries between the mitigation measures in general, particularly in some sub-categories, like ’Nutrient management’. The difficulty is exacerbated by the often inaccurate description of the mitigation measures and the assumptions related to them.
On the other side of the spectrum, still amongst the measures where data are available at least in four studies, are four measures (‘Precision farming’, ‘Nitrification inhibitors’, ‘High fat diet’, ‘Centralised anaerobic digesters’) which, though have a wide cost-effectiveness estimate range, but most often are estimated to have too high cost-effectiveness to be considered economically efficient. All of them have either high upfront costs or high running costs. Examples are the machinery and computer system in ‘Precision farming’, the extended slurry storage for ‘Improved timing of manure application’, the significant investment required for a ‘Centralised anaerobic digesters’, the annual cost of chemicals used as ‘Nitrification inhibitors’, or the increased feed costs in ‘Feeding more concentrates’ and in ‘High fat diet’.
However, many measures with high upfront or running costs still have estimates indicating that the measure can be cost-effective and, in some cases, might provide financial savings. Examples of such measures were ‘Reduced tillage’, ‘No-till’, ‘Covering slurry stores’, and, most notably, ‘On-farm anaerobic digester’.
The limitation of this review is that it considers only those studies which look both at the environmental and economic effects of mitigation, thus it narrows down the evidence base considerably. This means that potentially cost-effective measures (currently in Group 1 and Group 2) might be failed to be identified as consistently cost-effective measures or
18 consistently non-cost-effective measures, due to the current lack of information. The same applies to the long list of measures which are not assessed in any of these studies.
The range of the cost-effectiveness estimates is so large that, on the global scale, no firm conclusions can be drawn on which mitigation measure is better than the other. Mitigation measures which are assessed in more than three studies show a wide range of cost-effectiveness estimates, and vice versa, the low number of observations for many measures can be the main reason why they can be categorised more easily. At the same time, the low number of studies limits conducting analysis at a smaller spatial scale or disaggregating the studies in other ways. However, a meta-analysis of the estimates could shed light on some of the drivers of the variability in the estimates. Also, it can be possible to draw some conclusions about individual mitigation options at a regional level. This might be possible by looking at the accumulating evidence on the biophysical effects as analysed in meta-analyses and, at the same time, exploring the private and public cost elements and non-financial barriers in more detail.
The range of estimates is driven only partly by the variability in the systems studied: uncertainty also has an important role. Unfortunately, this uncertainty has not been explored in any of the reviewed studies. Therefore it is of paramount importance that the results of any single study have to be considered only as an indicative value. Additionally, as the cost-effectiveness metric only integrates two features of a mitigation measure (namely costs and mitigation potential), a range of other aspects have also to be considered in a policy development process, for example positive and negative co-effects, the cost and complexity of policy instruments needed to promote uptake and the behavioural barriers to uptake. Going further, beyond filling in the research gaps identified above, there is a need for developing regional and tailored policy instruments. This could include increasing the availability of farm-specific advice, equipping the farmers and advisors with regionally appropriate information and decision support tools, and, at the same time, promoting the development of monitoring and verification mechanisms, like the use of proxies and simple modelling tools.
However, the value of these studies lies mostly in drawing up an inventory of the likely consequences of the GHG mitigation on farms, discussing possible policy instruments to promote behavioural change and raising awareness among stakeholders by contributing to the public discourse on GHG mitigation.
19
3. Marginal
abatement
cost
curves
for
beef
production in the Brazilian Cerrado
This section is a brief summary of Oliveira Silva et al. (2015), attached in Appendix 4: Marginal abatement cost curves for beef production in the Brazilian Cerrado.
3.1 Introduction
The expected growth in livestock production poses significant additional pressure on natural resources. Sustainable management will require increasing yields and efficiency in existing ruminant production systems, minimizing competition of land used for food and feed, while maximizing ecosystem services, including mitigation of greenhouse gas (GHG) emissions (Gerber et al. 2013, Soussana et al 2013, Thornton and Herrero 2010). Brazil is the second world’s largest beef producer of the world, with a production predominantly based on pastures mostly in humid and sub-humid tropical climate.
Tropical regions are implicated as potentially offering major opportunities to increase beef productivity and emissions mitigation, as current productivity levels are still relatively low and emission intensities correspondingly high (Gerber et al. 2013, Opio et al. 2013). More productive pastures can increase soil carbon stocks, providing one of the largest terrestrial carbon sinks (Follett and Reed 2010, Neely et al. 2009). In addition, increasing productivity through feed supplementation may significantly reduce direct methane emissions (Berndt and Tomkins 2013, Ruviaro et al. 2014).
This paper investigates the cost-effectiveness of livestock mitigation measures applicable in the Cerrado core (Central Brazilian Savannah). The paper offers the first MACC analysis using an optimization model for Brazilian beef production. The evaluated measures are pasture restoration, feedlot finishing, supplement concentrates and protein, nitrification inhibitors and pasture irrigation. The analysis uses the outputs of a multi-period Linear Programming model (the Economic Analysis of Greenhouse Gases for Livestock Emissions model- EAGGLE (Oliveira Silva 2013)) to develop a bottom-up or engineering MACC. The analysis accounts for both the private and social costs and benefits (e.g. including avoided deforestation) and provides new insights for regional policy intervention.
3.2 Methodology
In our analysis we use a marginal abatement cost curve (MACC) approach to rank the cost-effectiveness of a range of mitigation measures. Agricultural MACCs are used to compare the relative costs of implementing these measures and the amount of mitigation they offer under average farm conditions. MACCs can be used to determine the relative cost-effectiveness of each measure in terms of cost per tonne of CO2 mitigated. With this
information it is possible to define the lowest cost ways to achieve a given GHG reduction target. In our case, the MACC is derived using output from a multi-period linear programming model. We represent the Cerrado region as a single production unit (or farm) and seek to maximize production value subject to economic and biophysical constraints.
Overview: The EAGGLE model (Oliveira Silva 2013) is a multi-period linear programming
model that represents the complete production cycle (cow-calf, stocking and finishing) on a beef farm. The model allocates farm resources optimally to meet demand projections while maximizing profit. In this analysis, the Cerrado beef production system is treated as a single farm.
20
Outputs: Profit (gross margin) and net GHG emissions are obtained by running the model
for a given beef demand projection and associating the resulting animal numbers with standard emissions coefficients, land use conversion emissions (i.e. loss of biomass in terms of CO2e) and changes in soil organic carbon stocks.
Building the MACC: By assuming the adoption of a mitigation measure ‘m scenario’, the
values of the outputs (profit and net emissions) are evaluated relative to a baseline without measure adoption. The abatement potential is calculated as the difference between GHG emissions under the two scenarios. Cost-effectiveness is calculated as the difference between profit, divided by the difference between emissions under the ‘m scenario’ and the baseline.
3.3 Results and discussion
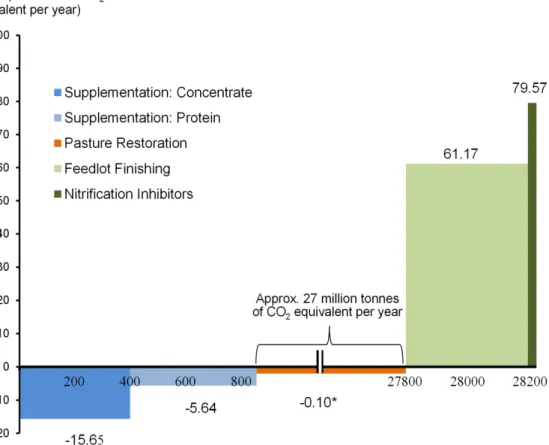
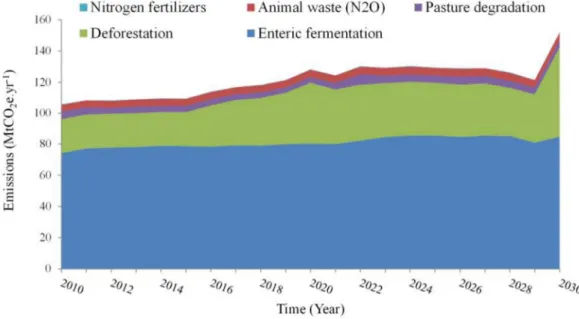
Figure 7 Estimated marginal abatement cost schedule for mitigation measures in Cerrado livestock production, 2006 to 2030
*
Not in scale
By implementing negative-cost measures identified in the MACC, by 2030, regional emissions could be reduced by 27.8 Mt CO2e yr-1, while the abatement potential of all
measures shown by the MACC is 28.2 Mt CO2e yr-1. Pasture restoration, involving avoided
deforestation, offers the largest contribution to these results.
The results who that pasture restoration is a very promising mitigation measure, with a total annual abatement potential of 27 Mt CO2e at negative costs, i.e. providing savings to
livestock farmers. Increasing the amount of concentrates and protein in the feed can, similarly, generate savings on the beef farms. Adopting these measures could reduce the Cerrado beef production emissions by 23.7% by 2030.
21
4. Cost-effectiveness
assessment
of
mitigation
options on model farms
4.1 Introduction
Component 3 (Work Packages 9-11) of the AnimalChange project was assessing mitigation options on model and showcase farms in Europe, South America and Africa both from the GHG emission perspective and from their financial performance. The work included the following steps (more details of these steps can be found in research deliverables indicated in brackets):
- Development of FarmAC (Deliverables 9.1, 9.2, 9.3, 9.4)
- Selection of model farms and showcase farms (Deliverables 10.1 and 10.5) - Selection of mitigation measures (described below)
- Detailed description of mitigation measures for biophysical and economic modelling (described below)
- Biophysical modelling of mitigation measures in FarmAC (Deliverables 10.4 and 10.3) - Development of the economic assessment tool (described below)
The section is reporting on the selection and description of the mitigation options and on the development of the economic assessment tool. For the latter the methodology is explained, with a future prospect of using this tool to gain deeper insight into the differences in the economic efficiency of GHG mitigation on European farms.
4.2 Identification and description of the mitigation options
for modelling
4.2.1 Initial selection for modelling
Work reported in D8.1 ‘Qualitative overview of mitigation and adaptation options and their possible synergies & trade-offs’ developed a list of mitigation and adaptation options, containing 42 mitigation options. On a workshop attended by whole-farm GHG modelling experts 27 of these mitigation options were selected for consideration for biophysical modelling (Table 4), based on three criteria:
- High GHG abatement,
- Whole farm effect as opposed to isolated effect on a single emission source and - Low perceived difficulty in modelling.
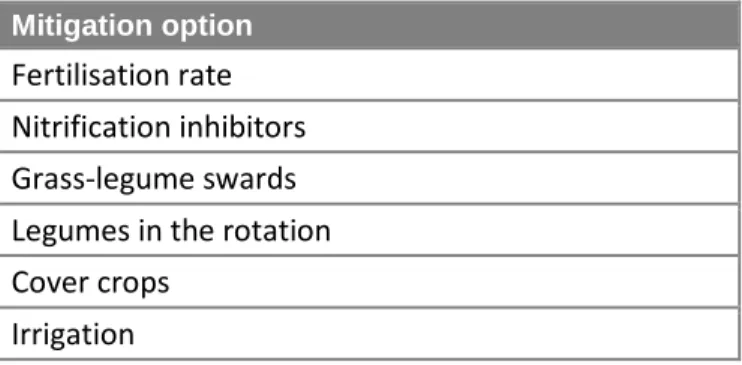
Table 4 Mitigation options initially selected for modelling
Mitigation option
Fertilisation rate Nitrification inhibitors Grass-legume swards Legumes in the rotation Cover crops
22
Mitigation option
Restoring degraded lands Improving pastures
Improving roughage quality Feeding more maize and less grass Feeding more fat
Additive nitrate
Balancing amino acids and reduce CP Increasing housing (grass constant) Replacement rate cattle
Cover slurry stores Manure acidification Anaerobic digestion Agroforestry
Genetic improvement in dairy cattle
Start the feedlot fattening period at a younger age Change the grazing management
Clean the pasture from unwanted species Integrate livestock and crop production Reducing age at first calving
Optimising calving dates Using enzymes (phytase)
4.2.2 Selection of five best mitigation options by farm experts
The next step was a further selection, whereby showcase and model farm experts (i.e. researchers in AnimalChange Component 3 with in-depth knowledge of regional farming systems) picked the best five options out of the 27 options listed above, considering how they perceive the mitigation options in relation to the following criteria for their particular farms:
- High GHG abatement - Low cost
- High likely uptake
Farm experts were asked not to consider other criteria at this stage, like scientific relevance to the project, modelling capabilities or data availability. The rankings are presented on Table 6 and Table 7, for European and for South American and African farms, respectively.
Out of the 27 options only one option was not selected by any expert, and that was ‘Nitrification inhibitors’. 21 options were selected for at least two farms, and the most popular choices were the following:
23
Table 5 Most popular mitigation options from the ‘5 best’ exercise
Overall Additionally in Europe Additionally in South America and Africa
Improving pastures Feeding more maize and less
grass Change grazing management
Improving roughage quality Feeding more fat Restoring degraded lands Fertilisation rate Reducing age at first calving Agroforestry
Legumes in the rotation Grass-legume swards Replacement rate cattle
The majority of the most popular mitigation options increase the production efficiency of farms, either by more efficient use of nutrient in crop and livestock production (‘Improving pastures’, ‘Improving roughage quality’, ‘Fertilisation rate’, ‘Legumes in rotation’, ‘Grass-legume swards’), or by higher productivity at the herd level (‘Replacement rate cattle’, ‘Reducing age at first calving’). Note that in the option ‘Fertilisation rate’ was usually understood differently in the regions, in Europe it was considered as decreasing the fertilisation rate while in South America and Africa the opposite was assumed, as current fertilisation rates are very low, and increasing them would increase area-based productivity more than the area-based GHG emissions. All of these options are generally regarded to have low costs, mostly requiring a change in management approach rather than additional investment or annual expenses. The mitigation options most popular in South America and Africa but not in Europe were those which benefit soil quality and soil C stocks – corresponding to the existing agronomic problems in these areas. Interestingly, two mitigation options which are usually estimated to incur increased annual costs were also selected, albeit only in Europe: ‘Feeding more maize’ and ‘Feeding more fat’. Though the first is regarded to result in productivity benefits, which might be higher than the increased costs, the second is mostly considered as an option rather to decrease GHG emissions than to increase productivity. On the other hand, the mitigation option ‘Nitrification inhibitors’ were not selected by any experts, even though it is commonly considered to have a high mitigation potential – though at an increased annual expense.
24 Table 6 The best five the mitigation options by farm as selected by farm experts in Europe
F e rt ili sa ti o n r a te N it ri fi ca ti o n in h ib it o rs G ra ss -l e g u m e s w a rd s Le g u m e s in t h e r o ta ti o n C o v e r cr o p s Ir ri g a ti o n R e st o ri n g d e g ra d e d la n d s Im p ro v in g p a st u re s im p ro v in g r o u g h a g e q u a lit y F e e d in g m o re m a iz e a n d le ss g ra ss F e e d in g m o re f a t A d d it iv e n it ra te B a la n ci n g a m n o a ci d s a n d r e d u ce C P In cr e a si n g h o u si n g ( g ra ss c o n st a n t) R e p la ce m n t ra te c a tt le C o v e r sl u ry s to re s M a n u re a ci d if ic a ti o n A n a e ro b ic d ig e st io n A g ro fo re st ry G e n e ti c im p ro v e m e n t in d a ir y c a tt le S ta rt t h e f e e d lo t fa tt e n in g p e ri o d a t a y o u n g e r a g e C h a n g e t h e g ra zi n g m a n a g e m e n t C le a n t h e p a st u re f ro m u n w a n te d s p e ci e s In te g ra te li v e st o ck a n d c ro p p ro d u ct io n R e d u ci n g a g e a t fi rs t ca lv in g Op ti m iz in g c a lv in g d a te s U si n g e n zy m e s (P h y ta se )
Mixed dairy Europe Maritime x x x x x
Mixed dairy Europe Maritime x x x x x
Mixed dairy Europe Continental x x x x
Mixed dairy Europe Mediterranean x x x x x
Mixed beef Europe Maritime x x x x
Mixed beef Europe Continental x x x x x
Grassland dairy Europe Maritime x x x x x
Grassland beef Europe Maritime x x x x x
Grassland beef Europe Continental x x x x x
Grassland beef Europe Mountain x x x x x
Grassland sheep Europe Mountain x x x x x
Grassland sheep Europe Mediterranean x x x x x
Grassland sheep Europe Mediterranean x x x x x
Grassland sheep Europe Mediterranean x x x x
Pig Europe N-Eu x x x x x
25 Table 7 The best five the mitigation options by farm as selected by farm experts in South America and Africa
F e rt ili sa ti o n r a te N it ri fi ca ti o n in h ib it o rs G ra ss -l e g u m e s w a rd s Le g u m e s in t h e r o ta ti o n C o v e r cr o p s Ir ri g a ti o n R e st o ri n g d e g ra d e d la n d s Im p ro v in g p a st u re s im p ro v in g r o u g h a g e q u a lit y F e e d in g m o re m a iz e a n d le ss g ra ss F e e d in g m o re f a t A d d it iv e n it ra te B a la n ci n g a m n o a ci d s a n d r e d u ce C P In cr e a si n g h o u si n g ( g ra ss c o n st a n t) R e p la ce m n t ra te c a tt le C o v e r sl u ry s to re s M a n u re a ci d if ic a ti o n A n a e ro b ic d ig e st io n A g ro fo re st ry G e n e ti c im p ro v e m e n t in d a ir y c a tt le S ta rt t h e f e e d lo t fa tt e n in g p e ri o d a t a y o u n g e r a g e C h a n g e t h e g ra zi n g m a n a g e m e n t C le a n t h e p a st u re f ro m u n w a n te d s p e ci e s In te g ra te li v e st o ck a n d c ro p p ro d u ct io n R e d u ci n g a g e a t fi rs t ca lv in g Op ti m iz in g c a lv in g d a te s U si n g e n zy m e s (P h y ta se )
Livestock Brazil, AmazonSub-humid/humid x x x x x
Intensive dairy Brazil Sub-humid/humid x x x x x x
Intensive beef Brazil Sub-humid/humid x x x x x x
Crop livestock Burkina Faso Semi-arid grassland x x x x x x
Crop livestock pastoral Burkina Faso Sub-humid x x x x x x
Extensive / semi-intensive French GuianaSub-humid/humid x x x x x x
Extensive beef Brazil Sub-humid/humid x x x x x
Extensive beef South Africa Semi-arid grassland x x x x x
Extensive beef Brazil, CerradoArid x x x x x
Livestock Brazil, AmazonSub-humid/humid Livestock Senegal Semi-arid grassland
26
4.2.3 Selection for modelling across farm types
The objective of this step was to suggest a combination (matrix) of mitigation option x farm for subsequent modelling, based on:
- Experts’ choices of five best options
- Maximising the overlap of mitigation options between farm type - Reducing possible modelling and data availability difficulties - Considering time and resource constraints
Two additional criteria were also considered: in the final combination one option (‘Fertilisation rate’) should be modelled on all farms, and two farms (maritime grass-based dairy, maritime mixed dairy) will be modelled with a high number of mitigation options, thus achieving a horizontal and a vertical cross-section. The aim was to achieve a balance in the matrix, trying to keep the experts’ choices as far as possible while increasing overlap between farms, and balancing this with the modelling (time and effort) constraints.
4 different mitigation option x farm combinations were developed and evaluated at a workshop by the farm experts and the model developers (Table 8):
- ‘7 best’ was aiming to retain the most from the farm expert’s ‘five best’ choices and proposed to evaluate 7 mitigation options on each farm.
- ‘4 best local’ was proposing to evaluate 4 options on each farm with an emphasis on keeping the expert’s original choices.
- ‘4 best overlap’ was also proposing to evaluate 4 options/farm, but with a focus on maximising the overlaps between the farms, i.e. to have more options evaluated on multiple farms.
- ‘3 best easy’ was suggesting to assess 3 options on each farm aiming for those which are relatively easier to model.
The final matrix was agreed by the CP3 farm experts and modellers. It was based on the ‘4 best local’ and ‘4 best overlap’ combinations, proposed to have 20 options evaluated, on average 6.5 options/farm (ranging from four to nine options/farm), achieving a good overlap of mitigation options on farms, though at the expense of high total number of modelling runs and the inclusion of a number of the more complex mitigation options. This final matrix is presented on Table 9, and served as the starting point for the farm assessment work. The farm experts used it as a starting point in their modelling and had a choice of adding or leaving out options if needed. The final list of modelled options x farms can be found in Deliverable 10.3.
27
Table 8 Evaluation of mitigation option x farm combinations
Europe
Number of options to be
modelled
Modelled on at least three farms
Number of difficult measures Total number of runs (farm type X option) Overlap with '5 best options' 7-local 24 15 7 108 77 4-local 20 9 6 64 54 4-overlap 13 8 3 64 46 3-easy 8 5 1 48 29 Final 16 13 3 112 50
South America and Africa
Number of options to be
modelled
Modelled on at least three farms
Number of difficult measures Total number of runs (farm type X option) Overlap with '5 best options' 7-local 17 10 8 63 50 4-local 11 6 6 36 31 4-overlap 9 7 5 36 29 3-easy 5 4 1 27 21 Final 10 8 6 51 35 Overall Number of options to be modelled Modelled on at least three farms
Number of difficult measures Total number of runs (farm type X option) Overlap with '5 best options' 7-local 25 23 8 171 127 4-local 22 15 7 100 85 4-overlap 17 13 6 100 75 3-easy 11 7 2 75 50 Final 20 18 6 163 85
28 Table 9 Final mitigation option x farm combination (x: mitigation option for that farm to be assessed)
FINAL SET F e rt ili sa ti o n r a te N it ri fi ca ti o n in h ib it o rs G ra ss -l e g u m e s w a rd s Le g u m e s in t h e r o ta ti o n C o v e r cr o p s Ir ri g a ti o n R e st o ri n g d e g ra d e d la n d s Im p ro v in g p a st u re s im p ro v in g r o u g h a g e q u a lit y F e e d in g m o re m a iz e a n d le ss g ra ss F e e d in g m o re f a t A d d it iv e n it ra te B a la n ci n g a m n o a ci d s a n d r e d u ce C P In cr e a si n g h o u si n g ( g ra ss c o n st a n t) R e p la ce m n t ra te c a tt le C o v e r sl u ry s to re s M a n u re a ci d if ic a ti o n A n a e ro b ic d ig e st io n A g ro fo re st ry G e n e ti c im p ro v e m e n t in d a ir y c a tt le S ta rt t h e f e e d lo t fa tt e n in g p e ri o d a t a y o u n g e r a g e C h a n g e t h e g ra zi n g m a n a g e m e n t C le a n t h e p a st u re f ro m u n w a n te d s p e ci e s In te g ra te li v e st o ck a n d c ro p p ro d u ct io n R e d u ci n g a g e a t fi rs t ca lv in g O p ti m iz in g c a lv in g d a te s U si n g e n zy m e s (P h y ta se )
Mixed dairy Europe Maritime x x x x x x x x x
Mixed dairy Europe Maritime x x x x x x x x x
Mixed dairy Europe Continental x x x x x x x x x
Mixed dairy Europe Mediterranean x x x x x x x x x
Mixed beef Europe Maritime x x x x x x x x x
Mixed beef Europe Continental x x x x x x x x x
Grassland dairy Europe Maritime x x x x x x x x
Grassland beef Europe Maritime x x x x x x x x x
Grassland beef Europe Continental x x x x x Grassland beef Europe Mountain x x x x x Grassland sheep Europe Mountain x x x x x
Grassland sheep Europe Mediterranean x x x x x
Grassland sheep Europe Mediterranean x x x x x
Grassland sheep Europe Mediterranean x x x x
Pig Europe N-Eu x x x x x x
Pig Europe S-Eu x x x x x x
Livestock Brazil, Amazon Sub-humid/humid x x x x x x x
Intensive dairy Brazil Sub-humid/humid x x x x x x x
Intensive beef Brazil Sub-humid/humid x x x x x x x
Crop livestock Burkina Faso Semi-arid grassland x x x x Crop livestock pastoral Burkina Faso Sub-humid x x x x
Extensive / semi-intensive French Guiana Sub-humid/humid x x x x
Extensive beef Brazil Sub-humid/humid x x x x x x
Extensive beef South Africa Semi-arid grassland x x x x x x
Extensive beef Brazil, Cerrado Arid x x x x x x
Livestock Brazil, Amazon Sub-humid/humid Livestock Senegal Semi-arid grassland