HAL Id: hal-00691686
https://hal.archives-ouvertes.fr/hal-00691686
Submitted on 27 Apr 2012
HAL is a multi-disciplinary open access
archive for the deposit and dissemination of
sci-entific research documents, whether they are
pub-lished or not. The documents may come from
teaching and research institutions in France or
L’archive ouverte pluridisciplinaire HAL, est
destinée au dépôt et à la diffusion de documents
scientifiques de niveau recherche, publiés ou non,
émanant des établissements d’enseignement et de
recherche français ou étrangers, des laboratoires
High-Pressure Sodium Lamp
Labo Chhun, Pascal Maussion, Sounil Bhosle, Georges Zissis
To cite this version:
Labo Chhun, Pascal Maussion, Sounil Bhosle, Georges Zissis. Characterization of Acoustic Resonance
in a High-Pressure Sodium Lamp. IEEE Transactions on Industry Applications, Institute of Electrical
and Electronics Engineers, 2011, 47 (2), pp.1071-1076. �10.1109/TIA.2010.2102993�. �hal-00691686�
Characterization of Acoustic Resonance in a
High Pressure Sodium Lamp
L. CHHUN1,2, P. MAUSSION1,2, S. BHOSLE1,2 and G. ZISSIS1,2
1Université de Toulouse; INPT, UPS; LAPLACE (LAboratoire PLAsma et Conversion d’Energie)
ENSEEIHT, 2 rue Charles Camichel, BP 7122, F-31071 Toulouse cedex 7, France
2
CNRS; LAPLACE; F-31071 Toulouse, France E-mail : pascal.maussion@laplace.univ-tlse.fr Tel: 33 (0)5.61.58.84.64 Fax: 33 (0)5.61.63.88.75
Abstract-In the last decades, the high pressure sodium (HPS)
lamp has been supplied in high frequency in order to increase the efficacy of the lamp/ballast system. However, at some given frequencies, standing acoustic waves, namely acoustic resonance (AR), might develop in the burner and cause lamp luminous fluctuation, extinction and destruction in the most serious case. Two main characteristics of the acoustic resonances in a 150W HPS lamp are presented in this paper and we seek for a control method to avoid the lamp AR. The first one is the characteristic of the lamp AR threshold power, and the second one is the differences between forward and backward frequency scanning effects. Both characteristics allow us to further understand the AR and to better control the lamp.
Index Terms-Acoustic resonance, AR threshold power, AR
detection, forward and backward frequency sweeping
I. INTRODUCTION
he HPS lamp has been developed in the last decades to be supplied in high frequency in order to improve its lifetime, power efficiency, colour and reduce ballast weight and size. However, at high frequency some acoustic resonances (AR) can develop in the lamp, which may lead to lamp instability such as discharge arc fluctuation, extinction and even lamp destruction in the most severe case [1]. From the theoretical point of view, it is provoked by the propagation of an acoustic wave in the closed volume of the burner. Basically, it generally occurs when the lamp harmonic power frequency is equal to the AR eigenfrequency of the lamp and its amplitude is higher than a threshold value [2]. The intensity of AR can be classified into three degrees, slightness, seriousness and extinction [3]. Furthermore, it can also be different from lamp to lamp of the same type from the same manufacturer due to the manufacturing tolerance. Presently, the problem of AR is still not completely understood. Certain literatures deal with the effect of lamp tube and electrode shape on the acoustic resonance [4][5]. Some physical models of lamp AR have also been developed to predict the eigenfrequencies [2][6]. However, the AR power threshold is still determined experimentally. The study of threshold power is an important part of lamp characterization in order to choose the convenient lamp supply. This issue will be presented in section II in this paper.
In addition, the possibility of AR detection by the variation of lamp parameters will be also discussed in section III. Another main feature of the AR is that it behaves differently according to the direction of sweeping frequency of the power supply. The study of backward frequency sweeping has revealed lamp electrical parameters before arc extinction and under what conditions an HPS lamp should be operated. This will be discussed later in part IV.
These characteristics of AR allow us to further understand the AR properties in order to improve the control of the lamp under high frequency operation.
II.THRESHOLD VALUE OF AR POWER
The AR power threshold indicates the excitation condition of the lamp power for the AR to take place at a given frequency. Many researches have been carried out to find an appropriate supply waveform for the lamp in order to avoid the AR, such as square wave low frequency supply [7], square wave high frequency supply [9], amplitude modulation [8], frequency modulation [10], and the third voltage harmonic injection strategy [11]. The basic idea of all methods is to have the distribution of power harmonic components below the AR threshold value. In our study, we focus on the determination of this power threshold which is a main factor in the choice of lamp supply. As illustrated in Fig. 1, a 150W HPS lamp is supplied by an inverter powered by a DC current source in parallel with a cascade connection of sinusoidal supply through an amplifier with a transformer and a blocking capacitor C.
Fig. 1 AR excitation circuit for experimentation type 1
T
C Amplifier I Ilamp Ulamp RlampTo evaluate the lamp AR threshold, the lamp instantaneous power produced by both DC and sinusoidal supplies is considered, leading to expression (1):
PLamp(t) = Ulamp(t). Ilamp(t)
= ( Uc + Usm.sin(wt) ).(Ic + Ism.sin(wt) ) = (Uc.Ic+Usm.Ism/2) + (Uc.Ism+Usm.Ic).sin(wt)
- Usm.Ism/2. cos(2wt)
= P0 + Pthr.sin(wt) - P2 cos(2wt) (1)
Uc and Ic are the voltage and current amplitude of the square wave supply, respectively while Usm and Ism are the voltage and current amplitude of the sinusoidal supply.
Thus, the lamp instantaneous power is composed of a DC component P0, the first harmonic component of amplitude Pthr at frequency w, and the second harmonic component P2 at frequency 2w.
Pthr is used to excite the AR to determine the AR power
threshold. Otherwise, according to [2], when the AR occurs at the excitation frequency w, P2 has only maximum value of 15% of fundamental Pthr. As a result, the AR is only excited by the first power harmonic.
By considering that the resistance of the lamp supplied by the square wave and sinusoidal source has the same value, the power expression can be derived as:
Pthr = Uc.Ism + Usm.Ic
= IcRlampUsm/Rlamp + Usm.Ic
= 2.Usm.Ic (2)
From (2), the power threshold at a given excitation frequency can simply be determined by measuring the sinusoidal voltage amplitude and the square wave current amplitude in the inverter. Our experiments were conducted with a Philips 150 W high pressure sodium lamp which was also aged with conventional ballast for more than 100 hours to reach its nominal characteristics, before being tested in formal experiments.
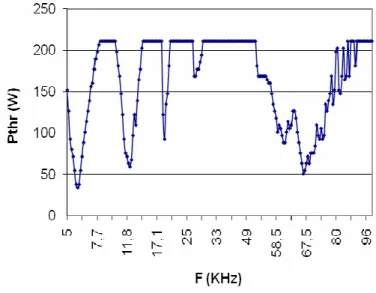
In our investigation, for each excitation frequency, the sinusoidal voltage amplitude is increased from 0 V to a value where the arc distortion is found inside the lamp tube. The square wave current, voltage amplitude and frequency were set to 1.5 A, 90 V and 20 Hz, respectively. The frequency of sinusoidal voltage source was varied from 5 kHz to 100 kHz, while its amplitude was limited to 50 Vrms corresponding to a maximum AR excitation power of 210 W. It should be noticed that in this configuration the power frequency is equal to the frequency of sinusoidal voltage supply.
The experimental results of AR power thresholds Pthr
plotted in Fig. 2 present several local minimums at the eigenfrequencies. The global minimum AR threshold value of 35W is found around the eigenfrequencies of 6 kHz where the AR state is very unstable.
Fig. 2 AR power thresholds
In the second experimental phase, the HPS lamp is supplied by a sinusoidal power source, realized by a successive connection of an adjustable sinusoidal voltage source, a transformer in series with a blocking capacitor Cb and a
resistive ballast Rb of 70 Ω (Fig. 3). The lamp harmonic
power will be compared to the AR power thresholds obtained in the previous experiment, in order to study the AR compatibility in both supply. The supply frequency is varied from 2 kHz to 50 kHz; thus contrary to earlier experiment, the lamp power frequency in this configuration is twice the supply frequency. Fig. 4 (a) and (b) show the lamp AR power threshold, harmonic power, voltage, current, resistance and the AR window over the supply frequency, from 2 kHz to 10 kHz and from 20 kHz to 50 kHz, respectively. The AR was not found in the experiment from 10 kHz to 20 kHz, and is not presented here. In addition, the discontinuous region refers to lamp arc extinction. As shown in the figure, as soon as the lamp power is higher than the threshold value, the acoustic resonance appears. Its fluctuation at each excitation frequency depends also on the injected voltage amplitude. We can see that the acoustic resonance is more intense on the left side of the AR window and gradually decreases with frequency increment.
Fig. 3 Lamp sinusoidal supply circuit for experimentation type 2 Amplifier Cb Ulamp Rlamp Ilamp US Rb
(a)
(b)
Fig. 4 Phillips 150W HPS lamp harmonic power, threshold power, voltage, current and resistance (a) from 2 kHz to 10 kHz (b) from 20 kHz to 50 kHz
Meanwhile, on the left side of the AR window is usually observed an important discharge arc distortion at low spatial frequency and, on the contrary, a moderate arc bending at high spatial frequency on the right side. It should also be noticed that on the right side of AR windows, where the power harmonic and AR threshold powers are equal, the parameter variations are very low which. This can reduce the AR detection sensibility if they are used as AR indicators. As a result, the supply frequency should be further increased to ensure the avoidance of AR.
III. LAMP ARDETECTION
It can be seen from earlier experiment results that lamp electrical parameters variation inside the AR window can be interpreted by the disturbances of acoustic resonance. Thus, the lamp voltage, current or resistance can be used to evaluate the occurrence of AR. According to the experiment with sinusoidal supply on a Phillips HPS lamp 150W, when an acoustic resonance occurs, the lamp current decreases while its voltage increases. Fig. 5 (a) and (b) show the voltage and current waveform in an HPS lamp Philips 150W in healthy state at 5.5 kHz and in an AR in serious state at 6 kHz, respectively. It can be noticed that the lamp peak voltage increases from 96 V to 120 V and peak current decreases from 1.7 A to 1.45 A which results in a resistance increased up to 50%. In our experiment, the resistance variation gives the most sensibility among other parameters. In summary, the variation of these parameters can be classified in this order:
∆P < ∆I < ∆U < ∆R.
Several methods of AR detections have been found in literatures that employ different strategies to predict AR occurrences. According to [3], when the lamp suffers from the AR, its output voltage was found to have a waveform similar to a signal of double side band amplitude modulation due to discharge arc instability. The detection method was based on lamp voltage amplitude variation.
0 1 2 3 4 5 6 x 10⁻⁴ -200 -150 -100 -50 0 50 100 150 200 t (s) u (V) i*100 (A) (a) 1 2 3 4 5 6 x 10⁻⁴ -200 -150 -100 -50 0 50 100 150 200 t (s) u (V) i*100 (A) (b)
In [12], during the AR, low frequency ripples (5-20 Hz) are present in lamp current. The FFT method could be applied for AR measurement. The above AR detection methods may require several ripple periods in order to evaluate the AR occurrence. In paper [13], the standard deviation of lamp current and voltage was used as an indicator of AR occurrence in MH lamp. It was also given that the standard deviation of voltage presented more significant variation than that of current when the AR happened. This method is similar to the calculus of lamp Rms voltage. Paper [14] have shown that the resistance variation present better sensibility than voltage and current variation.
Some investigation deals with the detection of arc path distortion by optical measurement with photodiodes which gives good detection sensibility [15]. However, this method is still complex for implementation. Several procedures of AR detection can also be found in [16].
It can thus be concluded that resistance measurement is the most practical method in AR detection which provides good sensibility among the other electrical parameters.
IV.ARHYSTERESIS IN FORWARD AND BACKWARD FREQUENCY SWEEPING
The study of AR hysteresis is related to the response of AR behavior to the variation of certain parameters of the input power when the acoustic resonance occurs. In our experiment, we also noticed that the AR behaves differently according to the frequency sweeping direction. As previously mentioned in Fig. 3, the Phillips 150W HPS lamp was supplied by the sinusoidal supply.
To evaluate this AR hysteresis characteristic, the supply frequency was increased from 2 kHz to 45 kHz and decreased back to 2 kHz so as to compare the lamp AR in both forward and backward frequency sweeping modes. Fig. 6 (a) and (b) show the lamp forward and backward voltage (Ufwd, Ubwd) and resistance (Rfwd, Rbwd) variations over the supply frequency. From the obtained results, it can be pointed out as following:
A. The AR behaves differently depending on the orientation of frequency sweeping,
B. In backward sweeping mode, the AR windows are larger, and present more significant variation than in forward mode. Most of them lead to lamp extinction at the left side of AR windows, as illustrated by the discontinuous regions in Fig. 6. Consequently, this can provoke some overlaps of acoustic resonances when a lamp has several AR eigenfrequencies close to each other,
C. The discontinuous regions of Rdecr and Vdecr waveforms in Fig. 6 represent lamp arc extinguishing points. Their highest points indicate the critical values of lamp parameters before the discharge arc extinction. Besides, it is important to notice that in backward sweeping, the AR state progresses smoothly from slightness to seriousness.
(a)
(b)
Fig. 6: Evolution of the lamp characteristics with forward (Ufwd and
Rfwd) frequency sweeping (a) and backward (Ubwd and Rbwd)
frequency sweeping (b).
Thus, it could be easy to determine the critical extinction parameters in this configuration. In our experiment, as soon as the voltage and current attained these values, the lamp extinguished in about one or two seconds. Consequently, in the lamp control procedure, it is important to effectively modify the lamp supply frequency before it reaches this critical state,
D. Otherwise, when the lamp encounters the AR, it is highly risky to avoid it by decreasing the supply frequency. On the contrary, it is possible to increase the supply frequency through the AR window to reach a region free from AR, without extinguishing the lamp arc [9].
The significant differences in AR comportment due to the hysteresis may lead to a main problem in real-time
Arc extinction Arc extinction
AR control. Most of the control methods presented in literatures propose an off-line solution to AR avoidance, assuming that its occurrence was already found under previous lamp operating condition.
Our future work will also deal with the backward frequency sweeping for the detection of acoustic resonances by lamp electrical parameter variations in lamp control.
V.CONCLUSION
The study of two main AR characteristics in HPS lamp was presented in this paper in order to seek for appropriate control methods to avoid the acoustic resonance. The first part concerns the AR threshold power of the lamp and its electrical parameter variations in the AR windows. Since the AR threshold value is known, any suitable lamp harmonic powers can be injected in the lamp. In addition, the study of AR detection is also included. The second part is related to behavior of AR in forward and backward sweeping. The analysis of backward frequency sweeping could provide the limited conditions for a lamp to be operated safely, and especially the lamp electrical parameter values before its extinction which can be used to control the lamp extinction when the AR occurs. This study will be useful for ballast designers to seek for suitable control strategies in order to avoid the acoustic resonance in an HID lamp operating at high frequency.
REFERENCES
[1] J. de Groot and J. Van Vliet, “The high pressure sodium lamp” Kluwer Technische Boeken B.V. Deventer, 1986.
[2] Sylvain EPRON, « Etude et effets des oscillations acoustiques dans les lampes à décharge haute pression », Phd thesis, CPAT, UPS, Toulouse, France, 1999.
[3] Chin S. Moo, Chunk K. Huang, Ying N. Hsiao, « High-Frequency Electronic Ballast with Auto-Tracking Control for Metal Halide Lamps », Industry Applications Conference, 2003, 38th IAS Annual Meeting. Conference Record of the Volume 2, 12-16 Oct. 2003, Page(s):1025 – 1029. [4] J. M. Davenport and R. J. Petti, “Acoustic resonance phenomena in low wattage metal halide lamps”, Journal of IES, April, Page(s): 633-642. [5] S. Wada, A. Okada, S. Morii, “Study of HID lamps with Reduced Acoustic Resonances”, Journal of the Illuminating Engineering Society, Winter 1987, Page(s): 162-175.
[6] Attila Vagvolgyi, Agoston Borocski, Szabolcs Gyimothy and Imre Sebestyen, “Modeling acoustic resonance in high-pressure discharge lamp arc chambers”, International journal of applied electromagnetic and mechanics 13, 2001-2002, Page(s): 427-430.
[7] Miaosen Shen, Zhaoming Qian and Fang Zheng Peng, « Design of a Two-Stage Low-Frequency Square-Wave Electronic Ballast for HID Lamps », Industry Applications, IEEE Transactions on Volume 39, Issue 2, March-April 2003, Page(s): 424 - 430.
[8] Lenin Martins Ferreira Morais, Pedro Francisco Donoso-Garcia, Seleme Isaac Seleme, Jr., et Porfírio Cabaleiro Cortizo, “Acoustic Resonance Avoidance in High Pressure Sodium Lamps Via Third Harmonic Injection in a PWM Inverter-Based Electronic Ballast”, Power Electronics, IEEE
Transactions on Volume 22, Issue 3, Part Special Section on Lighting Applications, May 2007, Page(s): 912 - 918.
[9] Jorge Garcia-Garcia, Jesus Cardesin, Javier Ribas, Antonio J. Calleja, Manuel Rico-Secades, Jose M. Alonso and Emilio L. Corominas, “Minimization of Acoustic Resonances in HID Lamps: Analysis and Comparison of Power Harmonics Content in High Frequency Non-Resonant Inverters”, Power Electronics, IEEE Transactions on Volume 20, Issue 6, Nov. 2005, Page(s):1467 – 1479.
[10] J. Correa, M. Ponce, J. Arau and J. M. Alonso, « Evaluation of frequency modulation techniques to avoid acoustic resonances in electronic ballast for HID lamp: Analysis and Methodology », Power Electronics Congress, CIEP, 9th IEEE International 17-22 Oct. 2004, Page(s):245 – 250. [11] L.M.F. MORAIS, P.F. DONOSO-GARCIA and I.SELEME JR, P. C. CORTIZO “Electronic Ballast for High Pressure Sodium Lamps without Acoustic Resonance via Controlled Harmonic Injection Synthesized with PWM”, Power Electronics Specialists Conference, 2005. PESC '05. IEEE 36th, 16-16 June 2005, Page(s):1107 – 1112.
[12] Yan Jiang, Miaosen Shen, Hua Li and Zhaoming Qian, « An Adaptive Acoustic Resonance Free Electronic Ballast for HID Lamps », Industry Applications Conference, 2003, 38th IAS Annual Meeting, Conference Record of the Volume 2, 12-16 Oct. 2003, Page(s):1020 – 1024.
[13] Yao C. Hsieh, Chin S. Moo, Hsien W. Chen and Ming J. Soong, « Detection of acoustic resonance in metal halide lamp », Industrial Electronics, 2001, Proceedings, ISIE 2001, IEEE International Symposium on Volume 2, 12-16 June 2001, Page(s):881 – 885.
[14] H. Peng, S. Ratanapanachote, P. Enjeti, L. Laskai and I. Pitel, “Evaluation of Acoustic Resonance in Metal Halide (MH) Lamps And an Approach to Detect Its Occurence”, Industry Applications Conference, 1997. Thirty-Second IAS Annual Meeting, IAS '97., Conference Record of the 1997 IEEE, Volume 3, 5-9 Oct. 1997, Page(s):2276 – 2283.
[15] Juan C. Álvarez Antón, Cecilio Blanco, Francisco J. Ferrero, Juan Carlos Viera,Nerea Bordel, Antonio Martín, and Georges Zissis, “An Acoustic Resonance Band Detection Workbench for HID Lamps”, Industry Applications, IEEE Transactions on Volume 43, Issue 5, Sept.-oct. 2007, Page(s):1191 – 1198.
[16] J. C. Anton, C. Blanco, F. Ferrero, A. Martin, N. Bordel, G. Zissis, S. Bhosle, « Acoustic Resonance Effects in High Pressure Sodium Lamps », Industry Applications Conference, 2007, 42nd IAS Annual Meeting, Conference Record of the 2007 IEEE, 23-27 Sept. 2007, Page(s):479 – 483.