Cerebral Hemodynamic Response to Faces and Emotions in
Infants at High Risk for Autism
by
Sharon Elizabeth Fox
M.D., Harvard Medical School, 2008 ARCHIVS Submitted to the Harvard-MIT Division of Health Sciences and Technology
in partial fulfillment of the requirements for the degree of
MASSACHUSETTS INSTfrE
DOCTOR OF PHILOSOPHY IN MEDICAL ENGINEERING OFTECHNOLOGY
at the
MASSACHUSETTS INSTITUTE OF TECHNOLOGY MAR
13
2012
February, 2012LIBRARIES
@ 2012 Massachusetts Institute of Technology. All rights reserved
The author hereby grants to MIT permission to reproduce and distribute publicly paper and electronic copies of this thesis document in whole or in part in any
medium now known or hereafter created.
A u th o r ... . ... . ...
Harvard-MIT Division of Health Sciences and Technology
February 2"d , 2012
Certified
Charles A. Nelson, Ill, PhD Professor of Pediatrics and Neuroscience, Harvard Medical School Richard David Scott Chair of Pediatric Developmental Medicine Research Thesis Supervisor
A cc e p te d b y ... . .. . ... ... Ram Sasisekharan, PhD Edward Hood Taplin Professor of Health Sciences & Technology and Biological
Engineering Director, Harvard-MIT Division of Health Sciences and Technology
Cerebral Hemodynamic Response to Faces and Emotions in
Infants at High Risk for Autism
by
Sharon Elizabeth Fox
Submitted to the Harvard-MIT Division of Health Sciences and Technology on February 2, 2012 in Partial Fulfillment of the Requirements for the Degree
Doctor of Philosophy in Medical Engineering
ABSTRACT
The incidence of autism spectrum disorders (ASD) has risen alarmingly in the
United States, and is now thought to affect approximately 1 in 110 live births. Early
diagnosis and intervention is the only treatment proven effective in cases of autism, however the behavioral tests currently available cannot make this diagnosis until at least two years of age. A lack of normal attention to faces and abnormal face processing is a cognitive deficit common to nearly all individuals with autism spectrum disorder, and this deficit is likely present from a very early age. The primary goal of this dissertation is therefore to characterize the specific neural response of face processing in infants with near-infrared spectroscopy (NIRS), and to then apply these measures to the study of abnormal face processing in infants at high risk for autism.
In order to achieve these objectives, the work described herein aims to: 1) characterize the hemodynamic response to faces in normal infants at six months of age as measured by the Hitachi ETG-4000 functional Near-Infrared Spectroscopy (fNIRS) system; 2) Simultaneously measure orbitofrontal hemodynamic responses to
social/emotional engagement and the response to faces in infants at high risk for autism as compared to low risk controls; and 3) Utilize a novel method of condition-related component selection and classification to identify waveforms associated with face and emotion processing in 6-7-month-old infants at high risk for ASD, and matched low-risk controls.
Our results indicate similarities of response waveforms, but differences in both the spatial distribution, magnitude, and timing of oxy-hemoglobin and deoxy-hemoglobin responses between groups. Our findings represent the first identification of
neuroimaging markers of a functional endophenotype at six months of age that may be associated with high risk of ASD. These results support a model of altered frontal lobe structure through evidence of altered hemodynamic response and/or functional activity in the high risk infant group, and these changes may, in turn, contribute to the development of ASD in specific individuals.
Thesis Supervisor: Charles A. Nelson, Ill, PhD
Title: Professor of Pediatrics and Neuroscience, Harvard Medical School Richard David Scott Chair of Pediatric Developmental Medicine Research
Acknowledgements
A centuries old Nigerian proverb states that, "It takes a village to raise a child." My
version of that wisdom will be: "It takes one village to raise a child, another to write a thesis, and an entire county to do both at the same time." This project represents the hard work of many individuals, and the continued support of an even greater number who chose to help me achieve what often seemed like an impossible goal.
I would first like to thank all the members of the Infant Sibling Project, as well as the
members of the LCN who worked beside me, led me to this project, and were there for all of life's extra challenges. I am especially grateful to Jen, Rhiannon, Alissa, Vanessa (both of you!), and Kerri for your help with this work - it would never have been possible without each one of you. I also owe a special thanks to my undergraduate student, Christine, whose attention to detail and tireless work ethic kept our analyses on track.
I would also like to thank my thesis committee, Emery Brown and David Boas, for their
careful consideration of my work, their time spent in meetings and edits, and for their willingness to mentor a somewhat atypical graduate student. I would particularly like to thank Emery Brown along with his post-doctoral fellow, Kevin Wong, for their development of the Bayesian methods employed in our analyses. To my thesis advisor, Chuck Nelson, I owe not only the experience of this project, but a wealth of wisdom that I can take with me throughout life. I hope to continue to learn from you all well beyond my time spent at MIT.
Many thanks are also due to my advisors and staff at HST. Thank you to Roger Mark for guiding me through a graduate education and into the next phase of my career. To Julie, Laurie, and Traci, I give many thanks for helping me to achieve my goals within the HST system. In addition, my graduate education would never have been possible without the generosity of the Hugh Hampton Young Memorial Foundation, and both the Neuroimaging Training Program and the Advanced Multimodal Neuroimaging Training Program.
I am ever grateful to the participants and families involved in these studies. I hope that
this work will one day give back to you in the ways that you have given to us.
Finally, I am forever indebted to my family for their love and support over the course of my education. Thank you to my brother, Jonathan, for always being there when it counts - I
promise that I will take my turn visiting you once I'm a little less busy. Thank you to my fellow HSTer and soon-to-be brother-in-law, Steve, for giving me sage advice about tackling the thesis while fixing every crooked door or leaky pipe in my home. Thank you to my sister, Michelle, for
being my maid of honor, and my best friend in the happiest and saddest of times. While it is probably rare to find reference to a mother-in-law in an acknowledgement section, I am forever indebted to mine - Winifred Lau - for traveling from Saudi Arabia to care for me, my husband, and my daughter during the last two months of this dissertation. I would also like to thank my parents, for seeing the purpose in my never-ending education, and for being such naturally gifted grandparents. A special thank-you to my mom, also an HST grad - when I was little, I horrified you by saying that my only aspiration was to be a "mommy." Little did you know that in my mind, a "mommy" was a doctor, a scientist, and also an expert at loving, feeding, and caring for
everyone around her. I don't know if I will ever be able to do it as well as you, but I am grateful for the role model you have been, and for your ability to add the juggling of a grandchild to your busy life in order to help me succeed.
A big thank-you to my husband, Frank, for understanding, and for supporting me in every
way possible during graduate school. You kept me on task and focused when I needed it, and I'm so lucky to have you in my life. We make a great team.
Finally, my biggest thank-you goes to my daughter, Evalina. Your good-nature and inclination to sleep at night are true gifts, and every morning is made better by your infectious smile. You have given me purpose, and the determination to achieve my goals if only to one day show you that it can be done, and through the course of it I have taken away from you what is most precious to us both: time. I hope that one day I can give it back to you when you need it most, and that as you near your six-month birthday, you are still able to tell the difference between mother and stranger.
Table of Contents
A b s tra c t...3
A cknow ledgem ents... . 4
T a b le o f C o n te n ts ... 5
List of F ig ures a nd T a bles ... 6
Chapter 1: Introduction to the Infant Sibling Project and Context of this Dissertation...7
1.1 T he Infant Sibling Project... 7
1.2. Overview of the Present Study...8
Chapter 2: Current Neurodevelopmental Studies of Autism and the Role of Face Perception...10
2.1. Defining Autism Spectrum Disorders... 10
2.2. Clues to Autism Spectrum Disorders: Molecular to Anatomic...11
2 .3. Infant Face P erception ... ... 17
2.4. Atypical Face Processing in Autism... 23
2.5. Conclusions... ... ... ... 24
Chapter 3: Localization and Characterization of the Infant Hemodynamic Response to Faces Using Near-infrared Spectroscopy...26
3 .1 . In tro d u c tio n ... 2 7 3.2. Research Design and Methods...29
3 .3 . R e su lts ... . . 34
3.4. Discussion... ... 40
Chapter 4: The Processing of Facial Identity and Facial Emotions in Infants at High Risk for A utism S pectrum D isorders... 43
4 .1. Introductio n ... ... ... 44
4.2. Research Design and Methods...46
4 .3 . R e su lts ... . . 5 3 4.4. Discussion... ... ... 61
Chapter 5: An Analysis of Connectivity of Face and Emotion Processing in Infants at High Risk for A utism S pectrum D isorders... 69
5 .1. Introd uctio n ... . . 70
5 .2 . M e tho d s ... . . 7 5 5 .3. R e sults ... . . 79
5.4. Discussion... ... 88
Chapter 6: General Discussion and Future Directions...91
6.1. Summary of Experiments... ... ... 91
6.2. The Infant Response to Faces as Measured by NIRS ... . ... 93
6.3. Face Responsiveness and Recognition in Infants at High Risk for ASD... 95
6.4. The Processing of Facial Emotions in Infants at High Risk for ASD... 98
6.5. Conclusions and Future Directions.... ... ... 101
A p p e n d ix A ... 1 0 4
A p p e n d ix B ... 1 0 7
List of Figures
Figure 3.1: Stim uli and Paradigm ... ... . ... .. ... 32
Figure 3.2: A schematic representation of our probe placement...36
Figure 3.3: The difference in the posterior distribution of response to upright and inverted face conditions at each timepoint... ... ... 39
Figure 4.1: Video Stim uli and Probes...49
Figure 4.2: LRC Oxy-Hemoglobin Responses to Face Identity and Emotion...55
Figure 4.3: Channels significant for main effects and interactions... ....60
Figure 5.1: ICA Data A nalysis Diagram ... 74
Figure 5.2: Centroid Waveforms of Component Clusters... 81
Figure 5.3: Com ponents w ithin Clusters... 84
Figure 5.4. Spatial Distribution of Oxy-hemoglobin Waveform 2... ... 86
Figure 5.5. Spatial Distribution of Deoxy-hemoglobin Waveform I... ... 87
Figure Al: NIRS Probes and Detectors...106
List of Tables Table 4.1: High Risk Autism (HRA) Group and Low Risk Controls (LRC)...47
Table 4.2A: Results of Face Identity x Emotion x Group Anova by Channel...58
Chapter 1: Introduction to the Infant Sibling Project and Context of this Dissertation
1.1. The Infant Sibling Project
This dissertation describes a portion of a larger, collaborative study of risk markers for autism known as the Infant Sibling Project. In recent years, public concern has risen surrounding the apparent increase in the prevalence of autism spectrum disorder (ASD), with current estimates of a rate of one in 110 live births (Kim et al., 2011). Autism often goes unrecognized in children from
disadvantaged backgrounds until they reach school age, though evidence has accumulated for the effectiveness of early intensive behavioral interventions for ASD (Dawson, 2008; Dawson et al., 2010). It is therefore increasingly necessary to develop methods for early diagnosis of autism - both for the purposes of studying those events correlating with the apparent onset of the disease, and for early intervention to improve cognitive outcomes. Zwaigenbaum et al. (2007)
provide the rationale for employing prospective longitudinal studies of infants at high risk, usually defined on the basis of an older, diagnosed sibling. These infants, along with age-matched controls, are studied at a series of timepoints until 2-3 years of age, at which time approximately 20-30% meet criteria for an ASD (Ozonoff et al., 2011; Zwaigenbaum et al., 2005).
No studies to date have used neuroimaging methods to distinguish between high and low risk infants as young as 6 months of age, however studies of 4-6 month olds have found subtle differences in low-level visual processing (McCleery et al., 2007), as well as attentional or affective response to faces
(Cassel et al., 2007; Yirmiya et al., 2006). Both behavioral and imaging measures have shown promise as markers as early as 9-12 months of age (Bosl, 2011; McCleery, 2010). By 12 months, infants at risk show atypical patterns of object exploration, and can even show signs of autism as measured by standardized diagnostic behavioral tests (Ozonoff et al., 2008; 2011). These tests cannot be administered below one year of age, however, so our knowledge of the development of ASD during infancy must rely upon additional research tools.
It is important to note that differences between high risk infants and low risk controls may reflect familial traits, or endophenotypes (Szatmari et al., 2008), which do not necessarily predict the onset of the disease. The goal of the Infant Sibling Project is to identify a set of behavioral and brain measures that serve as a set of risk marker endophentypes during infancy. In addition, we hope that the profiles defined by aggregates of specific risk markers will differentiate between infants with and without clinical outcomes. Finally, the identification of endophentypes may inform personalized intervention programs aimed at halting disease development in infants at risk for ASD.
1.2. Overview of the Present Study
Over the past 15 years, mounting evidence has supported the human development of a face schema within the first few months of life (Carey & Diamond, 1994; de Haan and Nelson, 1997, 1999, & 2002; Mondloch, 2002). Face perception and discrimination is a key component of normal human cognitive development and may be significantly altered in cases of abnormal
development. It has been demonstrated, for example, that a lack of normal attention to faces, and abnormal face processing, are cognitive deficits common to nearly all individuals with autism spectrum disorder (Zwaigenbaum et al., 2007). Furthermore, it has been shown that deficits in face processing are
present from an early age in autistic children and may be one of the first signs of ASD (Zwaigenbaum et al., 2007).
As part of the Infant Sibling Project, the primary goals of this dissertation are therefore to characterize and quantify the specific neural response of face
processing in infants with near-infrared spectroscopy (NIRS), and to then apply these measures to the study of abnormal face processing in infants at high risk for autism spectrum disorders. The experiments described herein will
characterize the infant response to faces using functional near-infrared
spectroscopy, and then apply these findings to the study of face and emotion processing in the Infant Sibling Project. In addition, we will use novel methods of analysis to identify temporal waveforms associated with neural processing in each group, as well as the connectivity of these waveforms across brain regions. Our goal is to identify endophenotypes present in the high risk group at 6-7 months of age, which may later be combined with other markers of risk in the
Chapter 2: Current Neurodevelopmental Studies of Autism and the Role of Face Perception
2.1. Defining Autism Spectrum Disorders
The term "autism" was used in 1943 by Leo Kanner, a child psychiatrist, to define a disorder in which patients had difficulty with social interactions, difficulty processing and adapting to changes, good memory, developmental speech delay, sensitivity to sounds and other environmental stimulants, digestive issues, and good intellectual potential (Kanner, 1943). Over the subsequent decades, it was recognized that many children with autism were misdiagnosed on one extreme as "socially awkward," or on another, as mentally retarded. Further characterization of autistic traits led to the standardization of phenotypes that we now label as Autism Spectrum Disorders (ASD). In recent years, there has been an apparent increase in the prevalence of autism spectrum disorder, with current estimates of a rate of one in 110 live births (Kim et al., 2011). The diagnosis of autism is typically based on DSM-IV criteria, and standardized tools such as the Autism Diagnosis Observation Schedule (ADOS, Lord et al., 2000), and Autism Diagnostic Interview-Revised (ADI-R, Lord et al., 1994) are considered gold standards for research purposes. These tests are not standardized below the age of two years, however, which is currently the earliest age at which a definitive diagnosis of ASD can be made.
2.2. Clues to Autism Spectrum Disorders: Molecular to Anatomic 2.2.1. Genetics of Autism
The heritability of autism has led many investigators to explore the
genetics of this disorder (Abrahams & Geschwind, 2010; Geschwind, 2011; Pinto et al., 2010). From these studies, it is clear that the genetic and molecular
interactions involved in autism are complex, and it is unclear whether autism spectrum disorder (ASD) can be explained by single gene mutations or by multiple genetic or epigenetic interactions (Autism Genome Project Consortium et al., 2007; Cooper et al., 2011; Geshwind, 2011; Piggot et al., 2009; Weiss et al., 2009). Early twin studies revealed the heritability of autism to be more than 90%, and when only one identical twin is autistic, the other often has learning or social disabilities (Geschwind, 2011 a). For adult siblings, the risk of having one or more features of ASD are estimated to be as high as 20-30% (Ozonoff et al.,
2011), much higher than the risk in the general population (Kim et al., 2011; Zwaigenbaum et al., 2007). The distribution of autistic characteristics along a spectrum suggests the presence of "risk" alleles in the genome, which may interact with each other, or the environment, to cause a resulting phenotype. In addition, the effectiveness of early intervention for many individuals diagnosed with ASD suggests that the timing of these interactions throughout development may play a key role in the severity of the disease. Over thirty genes related to neural development have been implicated in the pathogenesis of ASD, and include SHANK3, PTEN, MET, neuroligins, and CNTNAP2 (Abu-Elneel et al., 2008; Autism Genome Project Consortium et al., 2007; Geshwind, 2009; Herbert,
2011; Mukamel et al., 2011; Pinto et al., 2010; Sanders et al., 2011; Scott-Van Zeeland et al., 2010; Smith et al., 2011; Voineagu et al., 2011;for recent review, see Geschwind, 2011 a). Recent work has also implicated rare copy number variations (CNVs) on multiple chromosomes in the disease process of individuals with autism (Glessner et al., 2009; Pinto et al., 2010; Sanders et al., 2011; Smith et al., 2011). One such CNV, associated with the ubiquitin protein-ligase, has recently been used to create a mouse model with behavioral characteristics that mimic human ASD (Smith et al., 2011).
2.2.2 Histologic Findings
The development of high-resolution neuroimaging methods, as well as the post-mortem examination of autistic brains, has revealed a mixed array of
abnormal histologic findings in individuals with ASD. Neuropathology findings have pointed to neuroinflammatory changes, as well as morphological changes in both neurons and glia during the development of autism (Pardo & Eberhart, 2007; Pickett & London, 2005). It has been suggested that astrocytes and microglia, which play important roles in neuroinflammatory and immune responses, may be overactivated and contribute to autistic neuropathology (Pardo, Vargas, & Zimmerman, 2005; Pardo & Eberhart, 2007; Vargas,
Nascimbene, Krishnan, Zimmerman, & Pardo, 2005). Yet another study found that cortical minicolulmns in Layer Ill of prefrontal, temporal, and cingulate cortex were more numerous in individuals with autism than controls, and contained smaller neuronal cell bodies (Casanova et al., 2006; Casanova, 2006). As Layer
Ill contains many commissural and connecting fibers it was suggested that this represents the proliferation of short-range fibers, perhaps with a reduction of long-range connections (Casanova, 2007). Additional studies have noted a decrease in the number of Purkinje cells within the cerebellum (Bailey et al., 1998), as well as more densely packed neurons in the frontal lobes (Bauman & Kemper, 2003; Courchesne et al., 2011).
2.2.3. Gross Anatomic Findings
Imaging methods have also proven useful in the study of brain structure of individuals with ASD throughout development. Autistic children between two and four years of age were found to have an increase in total brain volume, as well as a specific enlargement of dorsolateral and medial frontal cortex as compared to controls (Brambilla et al., 2003; Carper, Moses, Tigue, & Courchesne, 2002; Hardan et al., 2006; Hardan, Muddasani, Vemulapalli, Keshavan, & Minshew, 2006; Schumann et al., 2010). Greater head circumference was confirmed using direct measures in a large, prospective sample of high risk infants (Zwaigenbaum & Stone, 2008), suggesting that this atypical head growth may be a marker for ASD during infancy. This difference does not appear in adolescents (Courchesne et al., 2001), or in fetal ultrasound records (Hobbs et al., 2007), suggesting that
important markers of the disease process may be present only at specific developmental timepoints. Volume increases in autistic adolescents have been found, however, in the right fusiform, right temporo-occipital, and various frontal
regions (Hardan et al., 2006; Haznedar et al., 2006; Hollander et al., 2005; Langen, Durston, Staal, Palmen, & van Engeland, 2007; Waiter et al., 2004). Other studies have suggested an increased basal ganglia volume, and reduced corpus callosum and medial temporal lobe volumes (Eigsti & Shapiro, 2003; Palmen & van Engeland, 2004). A rightward hemispheric asymmetry bias has also been implicated both structurally and functionally in autism, with higher order association and language areas most frequently described (Herbert et al., 2002; Herbert et al., 2004; Herbert et al., 2005). Such volumetric measurements can be difficult to interpret, however, as both the age at imaging, and the method of calculating regional volume, differs widely across studies.
2.2.4. Structural Connectivity and Synaptic Abnormalities
It is clear that autism is a structurally complex disease, and as a
developmental disorder, it may involve multiple regions of the brain in a dynamic process of pathological change. The changes that have been observed may thus be due to a reorganization of brain networks (Muller et al., 2011), such that a focus on localized features may be insufficient to reflect the entire process of the disease. Mechanistically, it has been proposed that early overgrowth through aberrant neuronal migration and synaptogenesis, followed by errors in synaptic potentiation or neuronal apoptosis, may result in localized overconnectivity, whereas long-range connections, such as those integrating the frontal lobe with other structures in the brain, are underdeveloped (Courchesne et al., 2011;
Hendry et al., 2006; C. Schmitz & Rezaie, 2008). While both white and gray matter abnormalities have been found in autism (for reviews see Amaral,
Schumann, & Nordahl, 2008; Brambilla et al., 2003; Eigsti & Shapiro, 2003), the heterogeneity of structural findings likely reflects differences in the timing of neuronal development, or the formation of specific synaptic connections and compensatory networks. As ASD is a phenotypically heterogenous disorder, a broad range of anatomical abnormalities is not inconsistent with a neuroanatomic correlate of disease.
2.2.4. Correlations between Structure and Function in Autism
While anatomical studies provide the physical clues to diseases along the autistic spectrum, these findings require correlation with cognitive profiles in order to develop an understanding of the etiology of ASD. Behavioral and functional imaging measures have therefore proven necessary in both the characterization and study of autism as a developmental disease. For example, Bigler et al. (2007) found a positive correlation between superior temporal gyrus volume and behaviorally assessed receptive language in controls, but not in ASD. Frontal regions have often been studied with morphometry, and
performance on a reaction time task was positively correlated with frontal lobe volume and gray matter thickness in autistic individuals (N. Schmitz, Daly, & Murphy, 2007). Combined behavioral and structural measures have also been used to explore social cognitive function, with amygdala volume correlating with
social function in individuals with autism (Dziobek, Bahnemann, Convit, & Heekeren, 2010), and a reduction in frontal mirror neuron networks
corresponding to greater severity of disease (Hadjikhani, Joseph, Snyder, & Tager-Flusberg, 2006).
Given the specific constellation of cognitive features that describe autism, as well as the wide distribution of affected brain regions, it has been
hypothesized that autism is caused by an inability to integrate perceptual features into a whole (Frith & Happe, 1994). This is a theory known as "weak central coherence," and according to this top-down cognitive model, individuals with ASD will perform at a normal, or perhaps above normal, level on tasks
involving localized perceptual processes, but poorly on tasks requiring perceptual integration. More recently, it has been suggested that deficits in integration may be an outcome of increased local processing (Happe & Frith, 2006). Possible anatomical explanations for this theory include deficient magnocellular pathways (Milne et al., 2002), right hemisphere impairments (Herbert et al., 2005; Isler, Martien, Grieve, Stark, & Herbert, 2010; McCleery, Akshoomoff, Dobkins, & Carver, 2009), dorsal visual pathway deficits (Pellicano, Gibson, Maybery, Durkin, & Badcock, 2005), or increasingly supported models of altered
connectivity (Courchesne, Redcay, Morgan, & Kennedy, 2005; Hendry et al., 2006; Isler et al., 2010; Just, Cherkassky, Keller, & Minshew, 2004; Koshino et al., 2005; Muller et al., 2011; Scott-Van Zeeland et al., 2010). Brock et al. (2002) have proposed that reduced connectivity would result in deficits in
information. Similarly, Happe and Frith (2006) have suggested that "failure of early neural pruning" could cause a reduction in tuning by higher cognitive functions. In support of this theory, examination of long-range connections, such as the white matter tracts of the corpus callosum, has revealed decreased volume (Barnea-Goraly, Lotspeich, & Reiss, 2010; Casanova, 2007). At the same time, both examination of white matter tracts (Herbert et al., 2005), and cortical thickness (Hardan, Muddasani et al., 2006), have suggested a relative overgrowth of cortico-cortical short tracts as compared to long tract fibers.
Likewise, diffusion tensor imaging studies of children with autism have indicated a disruption of white matter tracts in the anterior cingulate, corpus callosum, and prefrontal regions (Alexander et al., 2007; Barnea-Goraly et al., 2010; Lange et al., 2010). Further studies of functional connectivity are required, however, to determine whether these differences in white matter tracts are a cause or effect of the development of ASD.
2.3. Infant Face Perception
2.3.1. Face Perception as a Developmental Process
One of the principle characteristics of ASD is difficulty with social interactions, which is manifested by such behaviors as reduced eye contact, decreased attention to faces, and problems with responses to emotional cues (Dawson, Meltzoff, Osterling, Rinaldi, & Brown, 1998). Retrospective studies of home videotapes of first birthday parties of infants who were later diagnosed with autism reveal an early failure to actively attend to other people's faces (Osterling
& Dawson, 1994; Werner, Dawson, Osterling, & Dinno, 2000). Impairments in face processing are well documented in autism (Dawson, Meltzoff, Osterling, & Rinaldi, 1998; Dawson et al., 2002; Dawson et al., 2004; Dawson, Webb, Carver, Panagiotides, & McPartland, 2004), and are likely to present early in the
development of the disease. An understanding of the typical infant development of face expertise is therefore necessary to study these effects in cases of ASD.
Faces are common, yet unique and highly complex visual stimuli in our environment from birth, producing both verbal and nonverbal communication, as well as information about emotion and identity. Human adults can rapidly classify a variety of facial features (Bruce & Young, 1986; Bruce, 1986; Valentine &
Bruce, 1986), and slight changes in features related to emotional intent are universally recognized (Ekman, 1993). The human development of expertise in face processing appears to occur rapidly over the first few months of life, with several studies supporting the theory that infants as young as 3 months of age have a face schema (Morton & Johnson, 1991). For example, Mondloch et al. (2002) and Carey and Diamond (1994), demonstrated the presence of "face inversion effects" in early infancy. Turati et al. (2004) demonstrated that 4-month-olds process faces differently when the faces are upright as opposed to when they are inverted. Event-related potential (ERP) studies in 3, 6, and 12 month old infants have shown that cortical activation differs between upright and inverted faces (de Haan & Nelson, 1997; de Haan & Nelson, 1999; de Haan, Pascalis, & Johnson, 2002; de Haan, Johnson, & Halit, 2003), suggesting the development of a face schema by 3 months of age.
The neural mechanisms by which infants learn to attend to faces is a topic of much research and debate. It has been hypothesized that infants are
"innately" attracted to stimuli that resemble faces, and that subcortical signals cause newborns to begin to orient towards face-like patterns (Johnson, 2005; Morton & Johnson, 1991). Alternatively, it has been theorized that faces contain optimal low-level features for visual development, and face expertise results from a tuning of the visual system to such stimuli (Kleiner & Banks, 1987). Finally, it has been suggested that the rise of face expertise results from an "experience-expectant" model (Nelson, 2001), similar to language development, in which cortical regions have the potential to become specialized for face processing, and are tuned and refined during specific developmental windows.
2.3.2. Infant Processing of Face Identity
Face perception involves the integration of many pieces of visual
information, including the features of a face that constitute individual identity. This element of face processing appears to be present as early as four days of age, when infants have shown signs of discriminating their mothers' faces from
strangers' (Pascalis, de Haan, Nelson, & de Schonen, 1998). By three months of age, facial recognition of the mother extends to multiple viewpoints - a
perceptual ability that challenges complex computer algorithms (B. J. Balas & Sinha, 2007; Pascalis et al., 1998), and infants begin to discriminate between features of face that signify both race (B. Balas, Westerlund, Hung, & Nelson lii, 2011) and gender (Quinn, Yahr, Kuhn, Slater, & Pascalils, 2002; Quinn et al.,
2008). Soon after these abilities are gained, it has been suggested that face
processing follows a trajectory of "perceptual narrowing" (Nelson, 2001).
Perceptual narrowing refers to the fact that by about six months of age, infants
are able to distinguish among a variety of facial categories, however by nine
months, this skill is only retained within categories in which the infant has
significant experience. For example, six-month-old infants can successfully
discriminate identities of monkey and human faces (Pascalis, de Haan, & Nelson,
2002). By nine months of age, however, infants cannot differentiate between the
monkey faces, while retaining the ability to discriminate among the human face
category with which they have significant experience (Pascalis et al., 1998;
Pascalis et al., 2002). During the process of perceptual narrowing, and perhaps
contributing to it, is a shift in the overall mechanism of face perception. Face
perception appears to begin as a "featural" process, in which individual elements
of a face are separately analyzed, and develops over infancy into relational face
processing, which utilizes relations between core features of faces (Carey &
Diamond, 1977; Carey & Diamond, 1994; Gathers, Bhatt, Corbly, Farley, &
Joseph, 2004; Joseph et al., 2006). The perception of face identity thus becomes
a complex discrimination among featural relationships, rather than comparisons
between individual components of a face.
2.3.3. Infant Processing of Facial Emotions
In addition to the development of face recognition, infants also learn to
discriminate between specific emotions in faces (de Haan & Nelson, 1997; de
Haan, Belsky, Reid, Volein, & Johnson, 2004; Nelson & Dolgin, 1985; Nelson & Salapatek, 1986). Newborns show evidence of being able to discriminate among happy, sad and surprised faces (Field, Woodson, Greenberg, & Cohen, 1982). Happy emotional expressions appear to be the most consistently differentiated from neutral faces within the first six months of life (de Haan et al., 2004; Farroni, Menon, Rigato, & Johnson, 2007; Leppanen, Moulson, Vogel-Farley, & Nelson, 2007). It has been hypothesized that during the first few months of life, infants may learn to discriminate among the expressions that they are frequently exposed to, such as smiling, and cannot yet discriminate among unfamiliar expressions (Farroni, Menon et al., 2007). By 7 months of age, however, infants show the ability to consistently discriminate fearful faces (Nelson & Dolgin, 1985) and demonstrate longer fixations towards this emotional expression (Leppanen
et al., 2007; Leppanen, Richmond, Vogel-Farley, Moulson, & Nelson, 2009; Peltola, Leppanen, Vogel-Farley, Hietanen, & Nelson, 2009).
2.3.4. Neuroimaging and the Study of Infant Face Perception
Event-related potentials (ERPs) have provided a relatively easy and noninvasive means of imaging the neural signatures of face processing in infants. Two components, the N290 and the P400, are infant responses thought to be related to the adult N170 in terms of face-responsiveness. The N290 and P400 have been linked to the featural analysis of faces, and both show an adult-like effect of inversion at about 6 months of age (de Haan et al., 2003; Halit, de Haan, & Johnson, 2003), while the P400 shows latency differences specific to
faces in infancy. The Nc component appears to be involved in facial recognition, suggesting a difference between the mother and stranger faces at six months of age (de Haan & Nelson, 1997). At the same time, the Nc component also
appears to be involved in the discrimination of fearful and happy faces (T. Grossmann & Johnson, 2007; Leppanen et al., 2007; Leppanen et al., 2009). While ERPs reveal differences in neuronal activity that correlate with cognitive function, they are limited in their ability to localize that activity to specific regions of the brain. It can therefore be difficult to determine whether the differences seen between infants and adults are related to local change in neural
responsiveness and connectivity, or developmental shifts in the location of face processing.
Near-infrared spectroscopy (NIRS) is a relatively new neuroimaging technique that is particularly well-suited to the study of infants (for a full
explanation of NIRS methods, refer to Appendix A; Lloyd-Fox, 2010 for review). The NIRS technique is based upon measurement of hemodynamic response to neural activity, and can therefore be likened to functional MRI. NIRS was first successfully used to examine face processing in infants by Taga et al. (2003), who demonstrated a response to faces in babies as young as two months of age. Face processing responses as measured by NIRS have tended to show a right-sided laterality (Honda et al., 2010; Nakato et al., 2011; Otsuka, Nakato,
Kanazawa, & Yamaguchi, 2007), and have demonstrated responses to inversion consistent with those found in ERP studies (Otsuka et al., 2007). Studies of infants' neural responses to social and non-social stimuli have also included
examination of face responsiveness, and suggest that right postero-lateral regions may show greater responses to social face stimuli as opposed to the non-social stimuli (Lloyd-Fox, Blasi, Volein, & Everdell, 2009). Further studies are
required to fully characterize the infant response to faces using NIRS, and the localization and examination of this response are therefore one of the primary goals of this project.
2.4. Atypical Face Processing in Autism
As previously mentioned, deficits in face processing are a common feature of autism (Carver & Dawson, 2002; Dawson, Meltzoff, Osterling, Rinaldi, &
Brown, 1998; Dawson et al., 2002), suggesting that the developmental processes previously described are perturbed during infancy. Significant effort has been made to understand the nature of these deficits in individuals with ASD, as the specific mechanisms affected may be the earliest indicators of the disorder (Carver & Dawson, 2002; Dawson et al., 2004; Schultz et al., 2000; Schultz, 2005; Zwaigenbaum et al., 2005), and may also signify means for early
intervention. The face processing deficits reported in ASD include both difficulties in recognizing facial identity (Boucher & Lewis, 1992; Boucher, Lewis, & Collis,
1998; Klin et al., 1999), as well as developmentally abnormal featural processing of faces (Behrmann et al., 2006; Gauthier, Klaiman, & Schultz, 2009; Schultz et al., 2000). In addition, it has been shown that autistic children have difficulty
processing facial emotions (Celani, Battacchi, & Arcidiacono, 1999; Corbett, Carmean, Ravizza, Wendelken, Henry, Carter, & Rivera, 2009a; Gross, 2004;
Monk et al., 2010; Pelphrey et al., 2002). The face processing differences noted in ASD have been linked to neural function and anatomy through a variety of imaging methods. ERP studies have shown that the scalp topography of face sensitive ERP components is less lateralized in individuals with ASD as compared to controls (McCleery et al., 2009). In addition, both children and adults with ASD show shorter latencies for objects compared to faces for the N170 component (Webb & Nelson, 2001). Hemodynamic responses, as measured by fMRI, have shown reduced right fusiform response to facial recognition (Dawson et al., 2002; Hadjikhani et al., 2004; Pierce, Muller, Ambrose, Allen, & Courchesne, 2001; Schultz et al., 2000). In addition, the
superior temporal sulcus, associated with the social processing of faces, has been shown to be hypoactive in autistic individuals (Hadjikhani, Joseph, Snyder, & Tager-Flusberg, 2007; Pelphrey, Morris, & McCarthy, 2005). Whether these findings are the result of the primary disease process, or effects of other
neurological abnormalities, remains to be determined, and requires further efforts to understand how these differences begin to emerge in early development.
2.5. Conclusions
Face identification and the recognition of facial expressions are key
processes in typical human cognitive development. Evidence suggests that these abilities begin to develop shortly after birth, and are constantly tuned over the course of infancy. Furthermore, it has been shown that impairments in face
processing are common among individuals with ASD, and may be the first sign of abnormal development. As it has been suggested that the abilities to discriminate facial identity and positive emotions are present by 5-7 months of age (de Haan & Nelson, 1997; Nelson, 2001; Leppanen, 2007), and perceptual narrowing is present by nine months of age, the focus of this project will be on the 5-7 month age range. We will characterize the response to faces in this infant population using NIRS, and will then determine whether differences in face recognition and face emotion processing can be seen at this early age in a population at high risk for autism.
Chapter 3: Localization and Characterization of the Infant Hemodynamic Response to Faces Using Near-Infrared Spectroscopy
Abstract:
Abnormal face processing is a cognitive deficit common to many individuals with
autism spectrum disorder, and this deficit is likely present from a very early age.
In order to examine this effect in infants at high risk for autism, the first aim of this
project was to characterize the hemodynamic response to faces in typically
developing infants at 5-6 months of age as measured by the Hitachi ETG-4000
functional Near-Infrared Spectroscopy (fNIRS) system. Recent work in early
human development has utilized near-infrared spectroscopy (NIRS) to reveal the
brain areas involved in face processing. The present work sought to extend this
pursuit by examining the face inversion effect in infancy. We hypothesized that
specific face-responsive brain regions could be isolated with NIRS in response to
the face inversion effect at five months of age. The data from fifteen subjects
were analyzed using a paired t-test to measure the hemodynamic response to
the face inversion effect at each channel location. As in previous reports,
inter-hemispheric differences were observed between the upright and inverted face
condition. The group pattern of channel activation differed slightly from reported
adult results, and with a novel use of Bayesian inference and random walk state
space modeling, we were able to produce the first characterization of the infant
hemodynamic response to an upright face condition as both laterally localized in
the right hemisphere, near the posterior suprasylvian gyrus, and with a
predictable and relatively short (2s) latency, and peak response (2-3s following
stimulus removal). These results provide new information distinguishing the way
infants may process faces from that of adults. These differences may be due to a
developmental shift from feature-specific face representation towards the use of
featural relationships in face processing, which is evidenced through distinct
patterns of cortical activity.
3.1. Introduction
The perception and recognition of faces is an important part of human cognition, and the development of this faculty is hypothesized to be impaired in children presenting with autism spectrum disorder (ASD) (for review see de Haan, 2008; Righi & Nelson, in press). In order to understand the development of atypical face processing in ASD, it is necessary to first examine the aspects of face recognition and encoding that are present during typical development. One example of an early development in face processing is the "face inversion effect"
(FIE), which reflects the decrease in face recognition performance in adults when faces are presented upside-down (Yin, 1969). Over the past decade, several studies have demonstrated the presence of face inversion effects in infancy
(Mondloch et al., 2002; Turati et al., 2004). Turati et al. (2004) determined that as early as 4-months of age, faces are processed differently when presented upright as opposed to inverted. This effect allows inverted faces to be used as
comparison stimuli that are perfectly matched to upright faces in all of their low-level visual properties. Event-related potential studies in 3, 6, and 12 month old infants have shown that cortical activation differs between upright and inverted faces (de Haan and Nelson, 1997, 1999, & 2002; Halit et al., 2003). Some have suggested that the pronounced effect of face inversion is due to the interference of inversion with the processing of visual relationships among facial features (Carey & Diamond, 1994; Mondloch, 2002; Nakato et al., 2009). Whether the processing of relational information changes over development is still a topic of much debate (Itier & Taylor, 2004; Mondloch, 2002), and one that can currently
be investigated with modern neuroimaging techniques. Gathers et al. (2004)
used functional magnetic resonance imaging (fMRI) to show that 5-8 year-old
children do not show face-preferential activation in the fusiform gyrus as adults
do, but rather activation in a more posterior visual association area in the lateral
occipital lobe. It has been suggested that an anterior shift in face-processing
regions may reflect a developmental change from featural face processing, in
which individual elements of a face are separately analyzed, to relational face
processing, which utilizes relations between core features of faces (Carey and
Diamond,1977; Gathers et al., 2004; Joseph, 2006).
Near-infrared spectroscopy (NIRS) has been increasingly used to examine
face processing in both adults and infants. Csibra et al. (2004) utilized a
two-channel NIRS system to detect differences in the occipital processing of face and
non-face stimuli. In addition, Taga et al. (2003) demonstrated significant
inter-hemispheric differences in the 2-4 month-old response to face-like stimuli. Such
effects have been shown to be dominant in the right hemisphere, and have
served as a particular focus in studies utilizing NIRS to examine the earliest
development of face processing (Otsuka et al. 2007; Honda et al., 2009; Nakato,
E., et al., 2009). The FIE can be elucidated with NIRS as the differential
hemodynamic response obtained from visual stimuli of upright versus inverted
faces. Otsuka et al. (2007) demonstrated significant inter-hemispheric differences
on the effect of face inversion, with greater change in total hemoglobin
concentration in right lateral regions of the brain. This initial study, however, did
not assess the timecourse of the hemodynamic response to upright and inverted
faces at individual channels, and it was noted that a posterior placement of the probes might in fact be more amenable to localizing specific regions involved in upright as compared to inverted face processing. The purpose of the first
experiment was therefore to validate the location of the normal infant
hemodynamic response to faces using NIRS, and to characterize the timecourse of these responses across individual channels. As future studies involving infants at high risk for ASD would begin at six months of age, we focused on the 5-6
month age range, and hypothesized that we would localize posterior regions specifically responsive to the FIE.
3.2. Research Design and Methods
3.2.1. Participants
Fifteen healthy 5-month-old infants (7 male, 8 female) (mean age = 5.38 months, age range: 5.02 to 6.13 months) participated in the study. An additional
15 infants were excluded from the analysis due to insufficient data (10 could not complete the required number of trials due to fussing, 3 did not maintain
sufficient fixation for inclusion of trials, and 2 had data in which significant motion artifacts precluded the use of the required number of trials). This attrition rate is
similar to that reported in other studies of infants involving NIRS (Taga, 2003; Otsuka et al., 2007). All infants included in the experiment were: 1) born after 36
weeks gestational age, 2) born weighing more than 2500 grams, and 3) born without a known neurological or uncorrected visual abnormality.
Experiments were conducted under approval by the Institutional Review Board at Children's Hospital Boston and Massachusetts Institute of Technology, and in accordance with the Declaration of Helsinki. Written informed consent was obtained from the parents of all infant participants.
3.2.2 Experimental Procedure
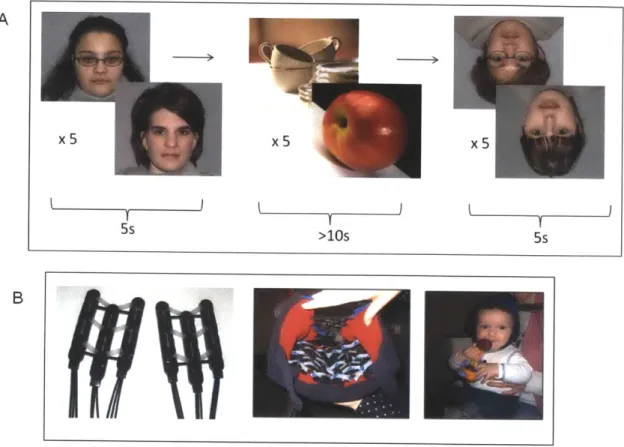
3.2.2a. Stimulus Presentation
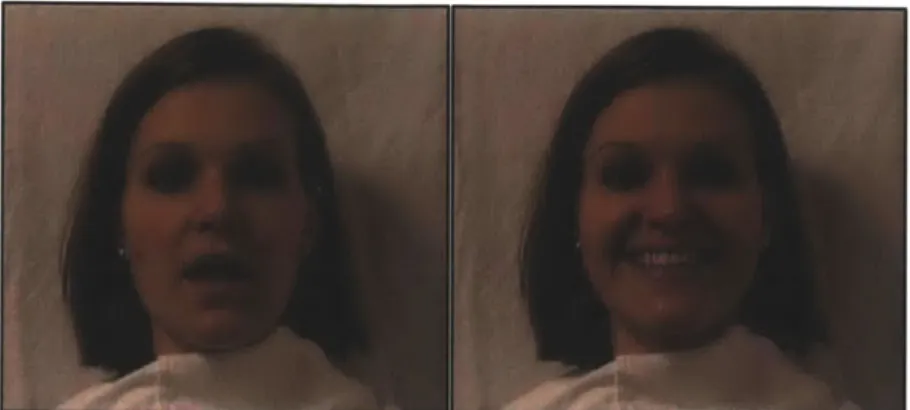
Face stimuli consisted of 20 chromatic images of female faces presented in a 13cm x 13cm square against a standardized gray background. Ten chromatic images of non-face objects with size, contrast and luminance similar to those of the face images were presented as baseline visual stimuli. Face stimuli were
presented in blocks of five different, randomly chosen faces for each condition (upright or inverted). The same faces were presented in both the upright and inverted conditions. Each stimulus presentation lasted approximately 800 milliseconds with a variable inter-stimulus interval of approximately 200ms in which a blank screen was present, yielding a total trial time of five seconds for each test block (Figure 3.1A). These blocks were followed by blocks of five, randomly chosen non-face object stimuli, which lasted for approximately two seconds each, ensuring that a minimum of ten seconds elapsed between presentations of face stimuli. Ten of the fifteen participants included in the
analysis viewed a presentation order of 20 face orientation blocks that was
pseudo-randomized within every ten blocks to include an equal number of upright and inverted face presentations. An additional five participants viewed a different presentation order that was pseudo-randomized to include at least eight blocks of each face orientation, but was not counterbalanced. The order of face orientation seen by each subject differed due to individual differences in subject looking time, but each subject viewed at least five blocks of each condition.
3.2.2b. NIRS Task Procedures and Equipment
Infants were seated on a parent's lap throughout the experiment. Infants passively observed the stimuli. Visual stimuli were presented on a 17-inch Tobii T-120 monitor at a distance of approximately 60cm from the infant. Video
recordings were used to monitor eye gaze throughout the experiment, and to present stimulus blocks only while infants were attending to the display. Trials were excluded if infants viewed fewer than four of the five faces presented.
A Hitachi ETG-4000 NIRS system with 24 simultaneously recording channels was used to collect hemodynamic response during stimulus
presentation. Details of the NIRS system can be found in Appendix A. A soft cap was designed for infants in order to affix the NIRS optical probes to the head (Figure 3.1 B). The flexibility of the silicone support, as well as the contour and design of the cap, allowed for a posterior placement of the probes that was not technically feasible in prior studies (e.g., Otsuka et al., 2007).
5s >10s 5s
B
Figure 3.1: Stimuli and Paradigm. A) Blocks of five faces (upright or inverted
condition) lasted five seconds each, and were interspersed with blocks of five
objects lasting for more than ten seconds. B) The chevron array of probes placed
Based on the light intensity detected through each channel, relative concentrations of oxygenated and deoxygenated hemoglobin were calculated from absorbance at each wavelength using the modified Beer-Lambert law. This conversion, as well as further data analyses, were implemented through a customized Matlab script (version 7.6, Mathworks Inc., Natick, MA, USA).
3.2.3. NIRS Data Analysis
For each participant, trials were included if at least four of the five faces in a given test block were viewed. Only infants who viewed five blocks of each test condition (upright and inverted) with no significant artifacts after initial filtering were included in subsequent analyses.
Timeseries corresponding to oxy- and deoxy-hemoglobin values were first processed using a 5th order Butterworth filter between 0.01 and 1.0Hz, and additional artifacts were identified and extracted if the raw signal exceeded a value of 4.95, or if total hemoglobin change exceeded 0.3 mM*mm within a 0.7s time window. For each subject, the data were parsed into ten second time windows with 0.1s time resolution beginning at stimulus onset, and ending five seconds after the end of the stimulus presentation. Ten second time windows corresponding to object presentation were also created, and were used to create a visual baseline condition. Face time windows were corrected to a baseline value at the onset of each stimulus. The correction to baseline for individual time windows was based upon the average oxy- and deoxy-hemoglobin values beginning three seconds before each face presentation, and ending at onset of
each trial. This value was subtracted from all values at each timepoint within a
trial to produce a timecourse originating from a baseline value. This correction
allowed standardization of the response at the onset of each stimulus, and thus
allowed for averaging across trials, and an accurate comparison between
conditions. Following this correction, trials were grouped by test condition and
averaged to obtain a mean value for each timepoint at individual channels. Mean
values at each timepoint from each subject were then pooled to produce a group
mean value by condition at each channel and timepoint. Channels from individual
subjects with low oxy-hemoglobin signal-to-noise (Mean/Standard Deviation <
1.0) were excluded from the group average. An oxy-hemoglobin response was
defined as the difference between the maximum value in the latter five seconds
of each ten second time window and the minimum value in the first two seconds
of a trial. This was based upon methods employed by Otsuka et al. (2007), and
measurement of fNIRS responses in infants (Taga et al., 2003). This method
accounted for the magnitude of the change in oxy-hemoglobin response if an
initial dip were to occur at stimulus onset. Statistical analyses were conducted on
the group average to determine the location and timecourse of responses to
faces, as well as responses specific to the FIE.
3.3. Results
Fifteen infants with data from at least 10 test blocks (5 or more upright blocks and 5 or more inverted blocks) were included in the group average (mean number of upright blocks = 7.8, mean number of inverted blocks = 6.1). An initial set of analyses aimed to identify channels that responded maximally to upright faces, as compared to the baseline. To this end, the responses to upright faces were averaged and compared with the baseline object condition using a paired t-test (Figure 3.2, T-value map). Significant face-specific activation was found in occipital areas bilaterally, as well as clustered in a postero-lateral region of the right hemisphere near the approximate location of the posterior suprasylvian gyrus (Figure 3.2, channels circled in white). The same seven channels showing significant face-specific activation demonstrated a significant difference in
oxy-hemoglobin response for the upright and inverted face conditions (Figure 3.2, channels circled in white). Channels significant for face inversion effects were found in both hemispheres (five channels in the right hemisphere, two in the left
hemisphere). The average change in oxy-hemoglobin concentration in response to upright faces in these channels was 0.162 mM*mm (SE = 0.025). The mean
difference in oxy-hemoglobin response between the upright and inverted face conditions was 0.083 mM*mm (95% Cl [0.011, 0.15]; p=0.0245, Bonf. corrected). No significant difference in deoxy-hemoglobin response was found between the two conditions. Subsequent analyses of the FIE focused on these seven
channels showing significantly higher responses for upright as compared to inverted faces.
15
10
-10
Tvalue
Figure 3.2: A schematic representation of our probe placement is shown on
the posterior infant head (red dots = emitter, blue dots = detector). Square
boxes between each emitter and detector indicate a channel, and are numbered
for each of the 24 channels. Colors within the channels indicate a T-value map
across fifteen subjects comparing oxy-hemoglobin response to the upright face
condition as compared to the object baseline at each channel location (color bar,
p=0.05, Bonf. corrected). Channels circled in white indicate those significant for
differences in response between the upright condition and object baseline, and
are also significant for differences in oxy-hemoglobin response to the upright
versus inverted face conditions (p<0.05, Bonf. corrected).
3.3.2. Examination of the Face Response using Bayesian Methods
In order to characterize the hemodynamic response over time for these seven channels, the combined oxy-hemoglobin timeseries describing the FIE (upright and inverted conditions) were analysed using Bayesian Markov Chain Monte Carlo (MCMC) methods. Bayesian methods have been employed in neuroscience for a wide range of electrophysiological and behavioral
experiments (Smith et al. 2005; Smith et al. 2007; Kaufman et al. 2005; Wood et al. 2006; Cronin et al. 2010), however they have not yet been used in the
analysis of NIRS response curves. Bayesian inference using Gibbs sampling (OpenBugs version 3; Lunn et al. 2009) was performed across the timeseries of all subjects, with 20,000 samples drawn after 10,000 burn-in samples. Given the original timeseries, the generation of samples via a random walk state space process yields values at each timepoint, which further allow the approximation of the joint posterior distribution at each timepoint (Metropolis et al. 1953; see Smith et al. 2007 for similar methods). The samples can therefore be used as an
approximation of the complete joint distribution of timepoints, and can be
referenced to determine the timecourse of differences in response to upright and inverted face conditions. The difference in the posterior distribution of response to upright and inverted face conditions at each timepoint is depicted (Figure 3.3). The global difference in response to upright as compared to inverted faces at each second was first significant at two seconds following the onset of stimulus
0.036]). The average maximal difference of the posterior distributions occurred between 7 and 8 seconds following stimulus onset, or between two and three seconds following stimulus removal (mean maximal difference = 0.14 mM*mm; 95% credibility interval [0.123, 0.157]). Maximal oxy-hemoglobin responses were noted to occur at varying times within the 5-8 second time period depending upon channel location, indicating that a 10 second time window was sufficient for capturing the infant response to faces as measured by NIRS.
E E E
0.2
0 0. U)i 0 0 -o -0.1 C 0 Q) - 0.2 -11-1U) 0TA.im (s) (10 secon inera in 0.1s inr ments)- .
-
-0.1-I
C:
C: -0.2
-50
2
4
6
8
10
Time (s) (10 second interval in 0.ls increments)
Figure 3.3: The difference in the posterior distribution of response to
upright and inverted face conditions at each timepoint. Density strips at each
timepoint represent the 95% credibility interval of the difference in the posterior
distribution of samples generated by MCMC methods. The difference in response
is first significant at two seconds following the onset of stimulus presentation
(mean difference = 0.019 mM*mm; 95% credibility interval [0.0027, 0.036]). The
maximal difference of the posterior distributions occurs between 7 and 8 seconds
following stimulus onset, (mean maximal difference = 0.14 mM*mm; 95%
3.4. Discussion
The goal of this study was to utilize NIRS to examine the infant
hemodynamic response to faces, and to elucidate specific regions of the infant
brain in which the FIE could be observed. Our findings are consistent with
previous studies of infants showing a larger right as compared to left hemispheric
response to face stimuli (Taga et al., 2003; Otsuka et al., 2007). The results,
however, are the first to demonstrate channel-specific responses to face
inversion over distinct regions of the brain, and reveal that the response to faces
in these regions follow a distinct timecourse that can be captured within a ten
second time window.
Although an early response to face inversion has been demonstrated,
these studies were limited to hemispheric comparisons that demonstrated
responses similar to those found in adults (Taga et al., 2003; Otsuka et al.,
2007). Our channel-specific findings in infants can now be compared to studies
of face perception in young children suggesting that the response may be
different from that seen in adults (Gathers et al., 2004; Aylward et al., 2005;
Joseph et al., 2006). We were able to demonstrate that the oxy-hemoglobin
response is greater in a region localized to the right posterior suprasylvian gyrus.
Similarly, Joseph et al. (2006) demonstrated that superior and lateral occipital
regions are engaged when 5-8 year-old children process upright faces, and
suggested that this may be similar to adult featural processing of inverted faces.
Gathers et al. (2004) also noted that 5-8 year-old children did not show a
hemodynamic response as measured by functional MRI in the fusiform face area when viewing faces versus objects, but rather activated lateral occipital cortex. Although NIRS cannot currently be used to assess deep structures such as the fusiform face area, our results suggest that brain regions involved in infant recognition of faces are similar to those activated in the earlier developmental stages of featural face processing as opposed to the adult networks involved in relational face processing. This finding has important implications for the study of typical and atypical development of face processing in infancy, and informs both our choice of face stimuli and probe placement in future studies.
In the present study, the timing of the average infant response to faces suggests a similar onset to adult hemodynamic responses (Taga et al., 2003; Huppert et al., 2004), with a rise lasting until just after the time of stimulus
removal. Lloyd-Fox et al. (2009) noted a similar finding in response to faces while examining social versus non-social stimuli. Infants' neural responses generally adapted to stimuli over successive trials, though this was not the case for
postero-lateral regions that demonstrated greater response to social face stimuli as opposed to the non-social stimuli (Lloyd-Fox, 2009).
The face inversion effect can be demonstrated as early as five months of age using near-infrared spectroscopy, though localized changes in response to upright versus inverted faces may differ from the patterns seen in adults. The results of this study support previous findings of an inter-hemispheric difference in infant responses to face inversion, and further identify a right suprasylvian oxy-hemoglobin response that is greatest to upright faces. In addition, we were able