HAL Id: inserm-02649160
https://www.hal.inserm.fr/inserm-02649160
Submitted on 29 May 2020
HAL is a multi-disciplinary open access
archive for the deposit and dissemination of
sci-entific research documents, whether they are
pub-lished or not. The documents may come from
teaching and research institutions in France or
abroad, or from public or private research centers.
L’archive ouverte pluridisciplinaire HAL, est
destinée au dépôt et à la diffusion de documents
scientifiques de niveau recherche, publiés ou non,
émanant des établissements d’enseignement et de
recherche français ou étrangers, des laboratoires
publics ou privés.
Staphylococcus aureus revealed by integrative structural
biology approach
Iskander Khusainov, Bulat Fatkhullin, Simone Pellegrino, Aydar Bikmullin,
Wen-Ti Liu, Azat Gabdulkhakov, Amr Al Shebel, Alexander Golubev, Denis
Zeyer, Natalie Trachtmann, et al.
To cite this version:
Iskander Khusainov, Bulat Fatkhullin, Simone Pellegrino, Aydar Bikmullin, Wen-Ti Liu, et al..
Mecha-nism of ribosome shutdown by RsfS in Staphylococcus aureus revealed by integrative structural biology
approach. Nature Communications, Nature Publishing Group, 2020, 11 (1), pp.1656.
�10.1038/s41467-020-15517-0�. �inserm-02649160�
ARTICLE
Mechanism of ribosome shutdown by RsfS in
Staphylococcus aureus revealed by integrative
structural biology approach
Iskander Khusainov
1,2,6,8
✉
, Bulat Fatkhullin
1,3,8
, Simone Pellegrino
2,7,8
, Aydar Bikmullin
1,8
, Wen-ti Liu
4
,
Azat Gabdulkhakov
3
, Amr Al Shebel
1
, Alexander Golubev
1,2
, Denis Zeyer
4
, Natalie Trachtmann
1,5
,
Georg A. Sprenger
5
, Shamil Validov
1
, Konstantin Usachev
1
, Gulnara Yusupova
2
✉
& Marat Yusupov
1,2
✉
For the sake of energy preservation, bacteria, upon transition to stationary phase, tone down
their protein synthesis. This process is favored by the reversible binding of small
stress-induced proteins to the ribosome to prevent unnecessary translation. One example is the
conserved bacterial ribosome silencing factor (RsfS) that binds to uL14 protein onto the large
ribosomal subunit and prevents its association with the small subunit. Here we describe the
binding mode of Staphylococcus aureus RsfS to the large ribosomal subunit and present a 3.2 Å
resolution cryo-EM reconstruction of the 50S-RsfS complex together with the crystal
structure of uL14-RsfS complex solved at 2.3 Å resolution. The understanding of the detailed
landscape of RsfS-uL14 interactions within the ribosome shed light on the mechanism of
ribosome shutdown in the human pathogen S. aureus and might deliver a novel target for
pharmacological drug development and treatment of bacterial infections.
https://doi.org/10.1038/s41467-020-15517-0
OPEN
1Laboratory of Structural Biology, Institute of Fundamental Medicine and Biology, Kazan Federal University, Kremlyovskaya Street 18, Kazan 420008, Russia. 2Department of Integrated Structural Biology, Institute of Genetics and Molecular and Cellular Biology, INSERM, U964, CNRS, UMR7104, University of
Strasbourg, 1 rue Laurent Fries, F-67400 Illkirch, France.3Institute of Protein Research, Russian Academy of Sciences, Institutskaya 4, 142290 Puschino, Moscow Region, Russian Federation.4NovAliX, BioParc, 850 bld Sebastien Brant, 67400 Illkirch, France.5Institute of Microbiology, University of Stuttgart, Allmandring 31, Stuttgart 70569, Germany.6Present address: Department of Molecular Sociology, Max Planck Institute of Biophysics, Max-von-Laue-Straße
3, 60438 Frankfurt am Main, Germany.7Present address: Cambridge Institute for Medical Research, Department of Haematology, University of Cambridge,
Cambridge CB2 0XY, UK.8These authors contributed equally: Iskander Khusainov, Bulat Fatkhullin, Simone Pellegrino, Aydar Bikmullin. ✉email:iskander. khusainov@biophys.mpg.de;gula@igbmc.fr;marat@igbmc.fr
123456789
U
pon transition to stationary phase or under stress
condi-tions, bacteria abate their metabolism, largely by
re-programming their protein synthesis apparatus through
the interactions with a number of small proteins (reviewed in
refs.
1,2). Recent high-resolution X-ray and cryo-electron
micro-scopy (cryo-EM) structures revealed the mechanisms of action of
some of these ribosome-bound proteins, including ribosome
rescue factors SsrA-binding protein (SmpB), alternative ribosome
rescue factor A (ArfA), alternative ribosome rescue factor B
(ArfB)
3–9, stringent factor RelA
10–12, ribosome hibernation
pro-moting factor (HPF), ribosome modulation factor (RMF),
ribosome-associated inhibitor A (RaiA/YfiA)
13–15, and ribosome
splitting factor HflX
16.
Most of the data available in the literature were obtained from
ribosomal complexes of Gram-negative bacteria, such as
Escher-ichia coli or Thermus thermophilus. However, only limited
high-resolution structural investigations have been performed so far on
ribosomes from gram-positive or/and pathogenic bacteria, such
as Bacillus subtilis
17,18, Staphylococcus aureus
19,20,
Mycobacter-ium smegmatis
21,22, and M. tuberculosis
23. The majority of these
structures were devoted to the understanding of how bacteria can
promote ribosome hibernation
24–28, and indeed demonstrated
the peculiar differences in the mechanism of function and
pro-teins required for different bacteria. Notably, although E. coli and
T.
thermophilus
promote
hibernation
by
using
distinct
pathways
29,30, the proteins from one bacteria can bind to the
ribosome of another
14.
Unlike HPF, the mechanism of stress response mediated by
RsfS is conserved in bacteria (but it is also found in the
mito-chondria and chloroplasts); nonetheless, the knowledge of its
mechanism of action and interaction with the ribosome is very
limited. RsfS is a stationary phase protein that binds to the
ribosomal protein uL14 on the large subunit (50S), and
subse-quently prevents its association with the small subunit (30S), thus
tuning down translation during stress
31–33. E. coli rsfS
knocked-out cells show reduced adaptation during the transition from rich
to poor media, with impaired viability during stationary phase
32.
Recently, a low-resolution (9 Å) cryo-EM reconstruction of RsfS
bound to M. tuberculosis 50S ribosome revealed its binding
region
22; however, at this resolution, molecular details of the
interaction interface and binding mode of RsfS with uL14 protein
can not be described.
In this article, we show that RsfS increases the ratio of free
ribosomal subunits under semi-dissociation conditions in S.
aureus due to its anti-association activity. In order to gain further
structural insights, we additionally obtained a 3.2 Å resolution
cryo-EM structure of the 50S–RsfS complex reconstituted from
70S ribosomes under semi-dissociation conditions. Most
impor-tantly, we solved the crystal structure of the uL14–RsfS complex
at a resolution of 2.3 Å and revealed the amino acids responsible
for RsfS binding to ribosomal protein uL14 of the large subunit.
Deciphering the interactions established by RsfS with the
ribo-some at high resolution provides an accurate perception about the
general mechanism of the bacterial stress response, which has
prominent clinical relevance in case of pathogens, such as S.
aureus.
Results
Effect of RsfS on ribosomal subunits re-association. To
eluci-date the binding mode of RsfS to the ribosome, we
first
deter-mined the conditions at which the intact 70S ribosome shifts to a
partially dissociated state. At these conditions, 70S ribosome and
its subunits, 50S and 30S, would exist in a dynamic equilibrium,
with a constant ratio between 70S and free subunits in solution.
Since the association of bacterial ribosomes is most sensitive to
the concentration of magnesium ions (Mg
2+)
34, we titrated Mg
2+while keeping the concentration of monovalent salts constant
(Fig.
1
a; Supplementary Fig. 1a). At 10 mM Mg
2+, the 70S
ribosome remains fully associated, whereas 2 mM causes full
dissociation into individual subunits. Fine Mg
2+titration
demonstrated that 3 mM and 2.5 mM Mg
2+lead to partial
dis-sociation of the ribosome, with a majority of 70S in the
first case
and a majority of subunits in the latter (Fig.
1
a; Supplementary
Fig. 1a, middle panel).
The addition of 2–5 times molar excess of RsfS to the 70S, at 3
mM Mg
2+, induced a remarkable shift of the equilibrium toward
dissociation (Fig.
1
b; Supplementary Fig. 1b, left and middle
panels). The RsfS protein co-sedimented with the 50S subunit on
a sucrose gradient, and in the absence of the 30S subunit, it
remained bound to the 50S even at 10 mM Mg
2+(Fig.
1
b–d).
Conversely, increasing Mg
2+concentration from 3 to 10 mM in
the 50S–RsfS + 30S mixture resulted in significant re-association
of the ribosome back to 70S particles (Fig.
1
e). At the same time,
the integrity of the 70S at 10 mM Mg
2+was not affected by
RsfS even using 15 times molar excess of the protein (Fig.
1
f, g).
These results demonstrate that RsfS binds to free 50S subunits
and prevents its association with the 30S; however, RsfS is
unable to trigger the 70S dissociation per se, and to prevent
subunits re-association under conditions of elevated magnesium
concentration.
In vitro reconstitution of 50S–RsfS complex. Reconstitution of
the 50S–RsfS complex was performed by mixing recombinant
RsfS protein with 70S ribosome under conditions of partial
dis-sociation followed by sucrose gradient-density centrifugation
(Fig.
1
b). This approach proved RsfS functional activity and
guaranteed that the resulting peak of the 50S would correspond to
the assembled complex rather than free 50S subunits. To
mini-mize the presence of the remaining 70S and 30S particles in the
sample, one additional step of sucrose gradient centrifugation was
performed (Fig.
1
c). In addition to western blot analysis (Fig.
1
d),
the presence of RsfS protein in the resulting 50S peak was
con-firmed by mass spectrometry (MS) (Supplementary Table 1).
Several 30S proteins were present as minor contaminants, and
others, e.g., bS1, uS10, uS14, uS15, uS18, and bS20, were absent.
Among 50S proteins, bL7/L12, bL9, bL32, and bL34 were not
detected by MS. In addition, the sample yet contained other
contaminants: translation factor EF-Tu, pyruvate dehydrogenase
complex E1 component alpha and beta subunits, and IgG-binding
protein (these are coming from the 70S ribosomes purification
procedure as described before
19).
Cryo-EM structure of S. aureus 50S–RsfS complex. Sample
homogeneity and particles distribution were confirmed by
nega-tive staining electron microscopy on a Tecnai F20 microscope
prior to data collection on a 300 kV Titan Krios microscope
(Fig.
1
h). The structure of the 50S–RsfS complex was resolved to
an overall 3.2 Å resolution (Fig.
2
a; Supplementary Fig. 2a). We
did not identify any small ribosomal subunit proteins or
non-ribosomal contaminants in the structure. As shown by local
resolution estimation, the core region was mainly resolved to
sub-3 Å resolution, with density for stacking nucleotides as well as
amino acid side chains clearly resolved (Supplementary Fig. 2b,
c). Peripheral regions, such as the 5S rRNA, as well as elements at
the intersubunit interface and central protuberance, were
dis-torted in the cryo-EM map probably due to extensive purification
procedure in low Mg
2+concentration, which led to a significant
drop of resolution in these areas (Fig.
2
c). To build the model into
these regions, we used a low-pass
filtered map to fit the chains
The binding site of RsfS on the 50S ribosomal subunit is in
overall agreement with the low-resolution cryo-EM
reconstruc-tion obtained for Mycobacterium
22, but is not consistent with an
earlier model exclusively inferred from genetic studies
32. The
complex formation is promoted by the interaction of the overall
negatively charged beta-sheets of RsfS with the positively charged
α-helices arrangement of uL14 (Fig.
2
f). The RsfS-binding cavity
also includes ribosomal protein bL19 and H95 of the 23S rRNA
(Fig.
2
g, f). More into details, RsfS potentially forms electrostatic
interactions with residues Arg39, Arg41, Gln43 of bL19, while its
additional anchoring point at the 50S may be mediated by
positively charged residues (Gln49, Arg53, and Lys56) that
interact with the negatively charged phosphate backbones of the
23S rRNA (Fig.
2
g, f).
Structural comparison of the presented 50S–RsfS structure with
the vacant S. aureus 70S structure
19shows that several elements
near the intersubunit interface, such as H35, H38, H67, H69 of the
23S rRNA, and uL5, bL15, bL31 ribosomal proteins are likely
destabilized by the absence of the 30S subunit, leading to a distorted
or completely absent signal in the cryo-EM map (Supplementary
Fig. 2d). RsfS-binding region on the 50S overlaps with intersubunit
bridge B8, which is formed by uL14 and h14 of the 16S rRNA
(Supplementary Fig. 2e). Structural analysis of the complex
suggested a critical dual role for amino acid Arg97 of uL14, which
mediates interaction with both A346 of the 16S rRNA and Tyr95 of
RsfS, depending on the context in which it is involved. In both
cases, the side chain of Arg97 interacts, through its amino groups,
with the backbone of the respective partner, however, adopting two
different conformations (Supplementary Fig. 2f).
Crystal structure of S. aureus uL14–RsfS complex. To interpret
the binding of S. aureus RsfS to 50S ribosomal subunit in more
details, we solved the crystal structure of RsfS bound to its
interacting partner uL14 at 2.3 Å resolution (Fig.
3
a). Expression
and purification of individual proteins were prone to aggregation;
thus, we co-expressed, purified, and crystallized S. aureus
uL14–RsfS as an entire complex. The crystal structure
demon-strates that the binding is mediated by a series of interactions,
both electrostatic and hydrophobic (Fig.
3
b). Importantly, the
primary contacts between amino acids such as Arg97, Arg107,
Lys113 of uL14, and Glu70, Asp81, Tyr98 of RsfS are conserved
across bacteria. Notably, the Arg97 (uL14)–Tyr98 (RsfS)
inter-action observed in the cryo-EM structure is consistent with what
we observe in the crystal structure. The complete list of
inter-acting amino acids and their conservation is summarized in
Supplementary Tables 2 and 3, and the full sequence alignments
are shown in Supplementary Fig. 3a, b.
Overall, the uL14–RsfS interaction pattern seen in the crystal
structure agrees well with the one identified in the cryo-EM
structure. Pairwise structure alignment of each protein
demon-strated their high structural similarity (C
αRMSD equals to 0.818
Å for 116 out of 122 pruned atom pairs of uL14 and 0.867 Å for
111 out of 112 pruned atom pairs for RsfS protein). However, the
close-up view on the 3D alignment of the two obtained complexes
onto uL14 protein shows that helices
α2 and α3 of RsfS do not
overlap well (Supplementary Fig. 4a). We speculate that such
differences at the solvent facing side of RsfS are probably due to
the fact that this region is, to some extent,
flexible in solution, but
stabilized in crystals. Nevertheless, the quality of the cryo-EM
0 0.2 0.4 0.6 0.8 1 1.2 1.4 Absorbance, 260 nm 70 S 50 S 30 S 70S + 5X RsfS 10 mM Mg2+ 10 mM Mg 2+ 3 mM Mg2+ 10 mM Mg2+ 3 mM Mg2+ 10 mM Mg2+ 3 mM Mg2+ 0 0.2 0.4 0.6 0.8 1 1.2 1.4 Absorbance 260 nm 70S + 15X RsfS 70 S 0 0.2 0.4 0.6 0.8 1 1.2 1.4 1.6 Absorbance 260 nm 70S + 5X RsfS 70 S
a
0 0.2 0.4 0.6 0.8 1 1.2 1.4 1.6 Absorbance 260 nm 70S 50S + 30S 70 S 50 S 30 Sb
c
d
f
g
e
h
RsfS Ladder 70S 70S+RsfS mix fr. 4 (1) fr. 6 (1) fr. 8 (1) fr. 10 (1) fr. 12 (1) fr. 14 (1) fr. 16 (1) fr. 18 (1) fr. 20 (1) fr. 8 (2) fr. 9 (2) 10 15 25 35 55 70 kDa 0 0.1 0.2 0.3 0.4 0.5 0.6 0.7 0 2 4 6 8 10 12 14 16 18 20 22 24 Absorbance, 260 nm 50S·RsfS Fraction number 0 0.2 0.4 0.6 0.8 1 1.2 1.4 1.6 1.8 0 2 4 6 8 10 12 14 16 18 20 22 24 26 28 30 Absorbance, 260 nm 70S + 5X RsfS x 50S·RsfS + 30S Fraction number 30 S 50 S 70 S 70 S 50 SFig. 1 RsfS protein binds to the 50S particles and prevents ribosomal subunits association. a Sucrose gradient (SG) profile of the 70S at semi-dissociation conditions (3 mM Mg2+) with the equilibrium shifted toward the association. Bold marker indicates the fraction“70S” taken for the western blot analysis.b, c Purification of the 50S–RsfS complex for cryo-EM studies. SG profile of the 70S at 3 mM Mg2+upon addition of 5X excess of RsfS (b), and subsequent centrifugation of the complex at 10 mM Mg2+(c). The gray square indicates the fractions pooled for purification. Bold markers indicate the fractions taken for the western blot analysis. The peak of the 50S–RsfS complex (c) was taken for cryo-EM grid preparation and MS analysis. d Western blot analysis of the selected fractions.e SG profile of 70S + RsfS mixture that was incubated at 3 mM and spun at 10 mM Mg2+.f–g SG profiles of the 70S mixed 5× (f) or 15× (g) molar excess of RsfS, incubated and spun at 10 mM Mg2+.h Typical electron micrograph of the 50S–RsfS sample. Scale bar represents 50 nm. Source data for panelsa–c and e–g are provided as a Source Data file.
reconstruction allowed to assign bulky side chains (i.e., Tyr36,
Trp77, His88, Phe90) and ensured reliable
flexible fitting of RsfS
(Fig.
2
c–e).
Discussion
In this work, we uncover the binding mode and describe the
detailed interactions that the stress protein RsfS establishes with the
50S ribosomal subunit in S. aureus using cryo-electron microscopy
and X-ray crystallography. Experiments on 50S–RsfS complex
formation under different magnesium concentrations proved that
RsfS does not promote subunits dissociation, but rather functions as
an anti-association factor. This means that the protein may prevent
the last step of the translation initiation process when the large
ribosomal subunit joins the 30S initiation complex. The binding site
of RsfS does not overlap with any translation factors, which
excludes the possibility of a competition mechanism. However, it
does not overlap with any known antibiotic’s binding site either;
thus, most probably, this stress factor can not protect bacteria under
antibiotics pressure. This grants to RsfS the role of a
fine modulator
of protein synthesis in cells upon entry in stationary phase, which
acts independently from other translation regulators such as
translation factors and other stress-induced proteins, such as HPF,
YfiA, RMF, or EttA
2. Therefore, a proper activity of this highly
conserved bacterial protein may be necessary for the survival of
bacterial cells under unfavorable conditions.
Our
cryo-EM
structure,
further
supported
by
mass-spectrometry data, shows that RsfS indeed binds to ribosomal
protein uL14 as previously suggested
22,32. However, the higher
resolution of our map, together with the crystal structure of the
uL14–RsfS complex, revealed the critical amino acids required for
this interaction to occur (Fig.
3
a, b). Multiple sequence alignment
of uL14 and RsfS proteins from 16 different species revealed that
the amino acids involved in binding of RsfS to the ribosome are
highly conserved (Supplementary Fig. 3a, b). The
first glimpse on
RsfS effect on 50S ribosome during stress was obtained from
mutagenesis studies of highly conserved amino acids in E. coli
uL14
32. This work led the authors to identify RsfS as a binding
partner of uL14
32, and to predict, although with high
approx-imation, the interactions that could have been involved.
Muta-tions T97A and K114A were found to be the most critical, while
R98A had less importance, and S117A did not affect uL14–RsfS
complex stability
32. In S. aureus, these amino acids correspond to
Thr96, Lys113, Arg97, and Ser116, respectively (Supplementary
c
d
Lys 56 Gln 49 Arg 53 Gln 43 Arg 41 Arg 39 Asp 32 Met 33 Asp 84 90° 90°b
a
g
e
Gaussian filter CP CP uL14 uL14 uL14 uL14 uL14 uL14 uL14 uL14 H95 H95 RsfS RsfS RsfS RsfS RsfS RsfS RsfS RsfS RsfS RsfS loop 2 loop 2 loop 4 loop 4 loop 10 loop 10 loop 8 loop 8 α1 α2 RsfS RsfS bL19 bL19 bL19 bL19 bL19 bL19 bL19 bL19 uL14 uL14 H95 H95 H95 H95 H95H95 H95 H95 RsfS RsfS RsfS RsfS RsfSRsfS β4 β2 β1 β2 β5 α2 β3 β5 β5 β2 α4 α3 β4 β3 β5 bL19 bL19 His 88 Trp 77 Phe 90f
–2.000 kT/e +2.000 kT/eFig. 2 Cryo-EM reconstruction of the 50S–RsfS complex and model interpretation. a The 3.2 Å cryo-EM density map. Ribosomal protein uL14 is colored in dark blue, bL19 in bright blue, 23S rRNA Helix 95 in white, and RsfS in orange. CP central protuberance.b A low-passfiltered map of the 50S–RsfS complex (Gaussianfilter with the width equal to 3.5 voxel size of the initial map) was used for the initial flexible fitting of the molecular model. c, d Density corresponding to the RsfS beta-sheet assembly and model isfitting. For representation reasons, a Gaussian filter with the width equal to one voxel size (outer mesh) was applied to the initial cryo-EM map (inner mesh).e The uL14–RsfS interaction interface as seen in the cryo-EM map (a Gaussian filter with the width equal to 1.5 voxel size applied).f Electrostatic potential of uL14 and RsfS (surface representation) calculated from the model; the structural elements involved in contacts formation are shown as ribbons and labeled.g The RsfS-binding cavity, including uL14, bL19, and H95. Molecules are shown in surface representation. Close-up sections demonstrate potential interacting residues of the proteins (represented as sticks).
Fig. 3a). In our crystal structure, Thr96 and Lys113 of uL14
indeed interact with RsfS; however, they form only a few
H-bonds, thus unlikely representing the most crucial interacting
interface. Interestingly, our structures suggest that Arg97
under-goes a structural rearrangement of its side chain to accommodate
either RsfS or the 16S rRNA (when RsfS is not present), becoming
a determinant of the transition to and from stress conditions.
Notably, Arg97 is conserved in evolutionary distant species
(Supplementary Fig. 3a), and its side chain mediates a direct
interaction with the backbone of Tyr98 of RsfS or the phosphate
backbone of A346 of the 16S rRNA (Supplementary Fig. 2f). We
thus suggest that such mechanism of binding partner
determi-nation is sequence-independent, and it might be universal across
bacteria. Furthermore, in agreement with the genetic data
pro-duced in E. coli
32, we show that in S. aureus Ser116 interacts with
RsfS via its backbone; therefore, replacement of Ser116 side chain
should not have a direct effect on complex formation and
stabi-lity. A previous low-resolution cryo-EM structure in M.
tuber-culosis allowed to visualize RsfS on the 50S more accurately
22. In
this work, the authors found that recombinant RsfS protein from
M. tuberculosis formed a homodimer in solution; in addition, the
replacement of the conserved Glu74 by alanine granted increased
solubility, but significantly decreased its affinity to 50S. In S.
aureus, this residue corresponds to Glu70, which is a prerequisite
for binding to uL14, well in agreement with M. tuberculosis data.
However, in our experiments, we co-expressed uL14 and RsfS,
and we did not observe RsfS homodimer neither in solution, as
seen from the gel
filtration profile (Supplementary Fig. 5a, b), nor
in the crystal structure. Thus, we suggest that S. aureus wild-type
RsfS does not tend to form homodimers in the presence of uL14
protein.
Conservation of uL14 and RsfS amino acid sequences from
different bacteria (Supplementary Fig. 3a, b) is translated in high
similarity also at the structural level. The structure of S. aureus
uL14 within the crystallographic complex with RsfS was almost
identical to the individually crystallized uL14 protein from
Geobacillus stearothermophilus
35, as well as to uL14 within the
ribosome of S. aureus, T. thermophilus, and M. tuberculosis
(Supplementary Fig. 4b). S. aureus RsfS from uL14–RsfS complex
shows high structural similarity (C
αRMSD of 0.877 Å for 93 out
of 112 pruned atom pairs) to the individually crystallized RsfS
from M. tuberculosis
22with the exception of the loop 4 and
α3-helix in Mycobacterium that separates into two individual helices,
α3-α4 in S. aureus (Supplementary Fig. 4c). Superposition of
uL14–RsfS complexes in our cryo-EM and crystal structure
shows that the structure of uL14 protein is identical in both
complexes, regardless of whether it is part of the ribosome or
individual protein in solution, whereas RsfS adopts a less
com-pact conformation in the cryo-EM structure (Supplementary
Fig. 4).
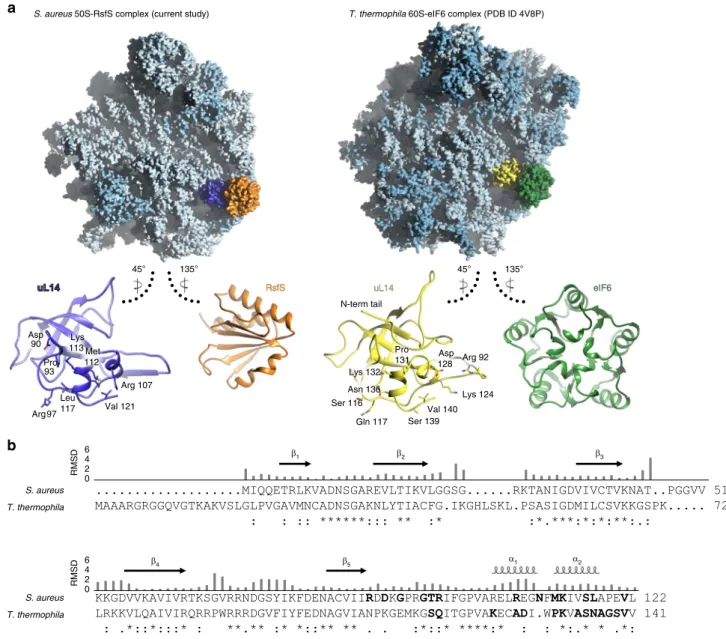
Notably, RsfS occupies the same binding site as initiation factor
6 (eIF6) in eukaryotes
36(Fig.
4
a), which possesses ribosome
anti-association activity to prevent the formation of cytoplasmic 80S
ribosome
37,38. In addition, eIF6 (TIF6 in yeast) is involved in 60S
biogenesis and its nuclear export
39,40. Similarly, RsfS homologs in
human mitochondria and plant plastids (C7orf30/MALSU1 and
Iojap, respectively) appear to be involved predominantly in
ribosome biogenesis
10,33,41–43, although some experiments also
demonstrated their activity to downregulate translation
32. To
date, there is no evidence that RsfS may participate in ribosome
biogenesis in bacteria, as well as the mechanism of dissociation of
RsfS from the 50S remains elusive. Considering that RsfS is
firmly
Met 112 Arg 107 Asn 110 Lys 113 Asp 90 Pro 93 Arg 97 Ser 116 Tyr 104 Tyr 98 Trp 77 Glu 70 Arg 68 Asp 81 Ala 83 Met 33 RsfS RsfS Arg 68 Arg 68 Glu 70 Glu 70 Trp 77 Trp 77 Tyr 104Tyr 104 Tyr 98 Tyr 98 Asp 81 Asp 81 Ala 83 Ala 83 Met 33 Met 33 uL14 uL14 Arg 107 Arg 107 Asn 110 Asn 110 Met 112 Met 112 Ser 116 Ser 116 Lys 113 Lys 113 Asp 90 Asp 90 Arg 97 Arg 97 Pro 93 Pro 93 N C C N 90° 90°
a
b
Fig. 3 The crystal structure of uL14–RsfS complex and their interaction interface. a Atomic coordinates of one of the two uL14–RsfS heterodimers from the asymmetric unit. The Cα root-mean-square deviation (RMSD) between the two heterodimers was calculated to be 0.585 Å, suggesting that these two copies are essentially identical. The uL14 is shown in cyan, RsfS in gold; N and C stand for N-terminus and C-terminus of the proteins.b Amino acids of uL14 and RsfS proteins involved in contact formation. Hydrophobic regions are shown as yellow surfaces, contacting amino acids as sticks. Yellow, red, and blue frames show the H-bonds-forming amino acids form the respective regions marked on surface representation. H-bonds are shown as black dashed lines; the water molecules are shown as red ball; the crystallographic electron density is shown in mesh at 1.5 sigma value.
bound to the 50S when the latter becomes available, it is plausible
that a source of energy and additional factors might be required
for its dissociation, as in the case of eIF6 release from the 60S
44,45.
It is known that in S. aureus, HPF dissociation from the ribosome
is based on GTP availability and performed by HflX GTPase
46.
We can speculate that an HflX-like mechanism may also be valid
for RsfS: upon transition to favorable conditions, accumulation of
GTP might trigger GTPase(s) to remove RsfS from the 50S.
However, based on the available data, it is more likely that,
despite the conservation of uL14 in all kingdoms of life and RsfS
in bacteria, mitochondria, and chloroplasts, in addition to an
overlapping binding site with eIF6, a functional divergence
occurred between these proteins during evolution.
In conclusion, our data provide a detailed structural interpretation
of one of the mechanisms of ribosome shutdown during stress
response in Staphylococcus aureus. Despite this mechanism is
con-served in bacteria, more biochemical data and perturbation
experi-ments will be required to fully understand the essentiality of RsfS for
the survival of S. aureus. The crystal structure and the detailed
comparative analyses we provide represent a groundwork for such
studies and will facilitate the design of mutagenesis experiments in S.
aureus and for analysis of stress survival rates upon disruption of
RsfS/uL14 interface. All this will shed new lights into the specificity
of these interactions in evolutionary distinct bacteria and lead to the
design of S. aureus-specific compounds aimed to decrease the
sur-vival of this multi-drug-resistant human pathogen.
0 2 4 6 β 1 β4 β5 α1 α2 β2 β3 S. aureus T. thermophila S. aureus T. thermophila 0 2 4 6 135° 45° 135° 45°
a
b
S. aureus 50S-RsfS complex (current study)
Val 121 Arg 97 Arg 107 Val 140 Gln 117 Lys 124 Ser 116 N-term tail RsfS
RsfS uL14uL14 eIF6eIF6
T. thermophila 60S-eIF6 complex (PDB ID 4V8P)
Leu 117 Pro 131 Arg 92 Asn 136 Lys 132 Asp 128 Lys 113 Pro 93 Asp 90 Met 112 Ser 139 RMSD RMSD
Fig. 4 Eukaryotic initiation factor eIF6 shares a similar binding site on universal ribosomal protein uL14, but has a different structure. a Localization of RsfS and eIF6 proteins on S. aureus 50S and Tetrahymena thermophila 60S, respectively. For a visual representation, the maps were simulated from the atomic coordinates of the models. Ribosomal RNAs are colored in light blue, ribosomal proteins in blue, S. aureus uL14 in dark blue, RsfS in orange, T. thermophila uL14 in yellow, and eIF6 in green. Individual proteins are shown in ribbon to represent their interaction interface, which displays the structural similarity of uL14 and the dissimilarity of the RsfS and eIF6 proteins in the two organisms. Residues of uL14 involved in the interaction with RsfS/eIF6 are shown as sticks, and labeled accordingly.b Pairwise sequence alignment of uL14 from S. aureus and T. thermophila demonstrates their high sequence similarity. Secondary structure elements are shown above the alignment. Residues interacting with RsfS (or eIF6) are highlighted in bold. The RMSD (given in Å) of 3D structure alignment is shown as bars above the sequence. An asterisk indicates a single, fully conserved residue (identity), colon indicates conservation between amino acids with substantial chemical similarity, while dot indicates conservation between amino acids with poor chemical similarity.
Methods
Ribosomes purification. The vacant 70S ribosomes were purified form the RN6390 strain of Staphylococcus aureus grown at 37 °C (180 rpm) to OD600= 1.0.
Cells were lysed in buffer A (20 mM HEPES–KOH pH 7.5, 100 mM NH4Cl, 21 mM
Mg-acetate, 1 mM EDTA, 1 mM DTT) containing 1× protease inhibitors solution (Roche), and lysostaphin (Sigma-Aldrich) 0.5 mg per gram of cells. After cen-trifugation 30,000 × g for 90 min, cell lysate was supplemented with 2.8% of PEG 20,000 (Hampton Research) spun 10,000 × g for 5 min. The PEG 20,000 con-centration was increased to 4.2% in the supernatant. After centrifugation 10,000 × g for 10 min, the ribosome pellet was dissolved in buffer A and passed through a sucrose cushion (10 mM HEPES–KOH pH 7.5, 500 mM KCl, 25 mM Mg-acetate, 1.1 M sucrose, 0.5 mM EDTA, 1 mM DTT) at 100,000 × g for 15 h using a Beck-man Type 45 Ti rotor. The pellet was resuspended in 10 mM HEPES–KOH pH 7.5, 100 mM KCl, 10 mM Mg-acetate, 0.5 mM EDTA, 1 mM DTT, and the ribosomes were separated on 7–30% sucrose gradients equilibrated in the same buffer and spun at 38,694 × g for 15.5 h using a Beckman SW28 rotor. The fractions corre-sponding to 70S particles were pooled, the concentration of Mg-acetate was adjusted to 25 mM, and PEG 20,000 was added to afinal concentration of 4.5% w/ v. Ribosomes were pelleted by centrifugation at 20,000 × g for 12 min, the pellet was gently dissolved in buffer G (10 mM HEPES–KOH pH 7.5, 50 mM KCl, 10 mM NH4Cl, 10 mM Mg-acetate, 1 mM DTT).
Sucrose gradient analysis. For magnesium titration experiments (Fig.1a; Sup-plementary Fig. 1a) 70S ribosomes were dialyzed in buffer H10K50N10(10 mM
HEPES–KOH pH 7.5 (at 25 °C), 50 mM KCl, 10 mM NH4Cl) containing the
respective Mg2+concentration for at least 3 h, and loaded onto sucrose gradients prepared in the same buffer. For RsfS-binding experiments, 70S ribosomes were incubated with 1×, 2×, 5×, or 15× molar excess of RsfS protein in buffer H10K50N10M3(M3stands for 3 mM Mg-acetate). Thefinal buffer conditions were
adjusted to H10K50N10M3, the mixture was incubated for 30 min at 37 °C, and
loaded onto sucrose gradients prepared in either H10K50N10M3buffer (Fig.1b;
Supplementary Fig. 1b) or H10K50N10M10buffer (Fig.1e). To evaluate RsfS
dis-sociation activity (Fig.1f, g), 70S+ RsfS mixture was incubated and applied similarly to sucrose gradients, but keeping always Mg2+concentration at 10 mM. All sucrose gradients performed in this study were prepared with a linear 0–30% gradient of sucrose in buffer H10K50N10supplemented with different
concentra-tions of Mg-acetate (2 mM, 2.5 mM, 3 mM, or 10 mM). All centrifugaconcentra-tions were performed using a Beckman SW41 rotor running at 53,000×g for 12.5 h at 4 °C. Fractions of 0.4 mL were collected and measured using Nanodrop 2000 (Thermo Scientific™) at 260 nm wavelength. Three different preparations of the 70S sample were used in the study.
Purification of 50S–RsfS complex. S. aureus RsfS with a six-histidines tag at the N-terminus was cloned into pET28 plasmid and recombinantly expressed in E. coli BL21 (DE3) pLysS cells. Cells were grown at 37 °C until an OD600of 1.0, and
protein expression was induced by the addition of 0.5 mM IPTG at 30 °C for 5 h. Collected cells were resuspended in lysis buffer (20 mM Tris-HCl, 300 mM NaCl, 10 mM imidazole, pH 7.5), and disrupted by sonication. The resulting lysate was cleared by 30 min centrifugation at 30,000×g and then passed through a Ni-NTA resin (Qiagen) equilibrated in lysis buffer, washed with the same buffer containing 20 mM imidazole and eluted with lysis buffer supplemented with 250 mM imi-dazole. Eluted fractions were precipitated by adding ammonium sulfate salt powder until 80% of saturation and stirring for 1 h at 4 °C. Prior to complex formation with the ribosome, RsfS precipitate was re-solubilized in H10K50N10buffer and purified
on Superdex 75 10/300 (GE-Healthcare) to remove aggregates. The peak fraction was collected for 50S–RsfS complex preparation.
To assemble the 50S–RsfS complex, vacant S. aureus 70S ribosomes were dialyzed in semi-dissociation buffer H10K50N10M3and mixed withfive times molar
excess of RsfS protein. The mixture was incubated at 37 °C for 30 min and loaded onto sucrose gradients prepared in the same buffer (Fig.1b). The fractions containing 50S–RsfS were buffer exchanged to H10K50N10M10. Afterward, the
sample was concentrated using a Centricon with a molecular weight cutoff (MWCO) of 30 kDa, andfinally layered onto another sucrose gradient prepared in the same buffer (Fig.1c). Sucrose was removed by buffer exchange, and the sample was concentrated using a Centricon MWCO 30 kDa. Peak fractions were used for MS analysis, negative staining and cryo-EM grids preparation.
Western blot analysis. From each selected sucrose gradient fraction (Fig.1b,c), 10 µL were mixed with equal volume of 2× loading buffer (120 mM Tris-HCl pH 7.5 (25 °C), 40% glycerol, 0.09% bromophenol blue, 20 mM DTT). As control samples, we used RsfS protein (0.1 µg), 70S ribosome (1.1 µg) fraction from sucrose gradient at 3 mM Mg2+(Fig.1a) and 70S+ 5X RsfS mixture (containing 1.5 µg 70S and 0.35 µg RsfS) before centrifugation in sucrose gradient. Proteins were separated on 15% polyacrylamide gel according to Leammli electrophoresis protocol47. The
proteins were transferred to a 0.45 µm nitrocellulose membrane at 10–11 V for 45 min at room temperature using the Trans-Blot Semi-Dry Transfer apparatus (BioRad). After incubation with 5% nonfat milk in TBST (10 mM Tris, pH 8.0 150 mM NaCl, 0.5% Tween 20) for 60 min at 37 °C, the membrane was washed once with TBST and incubated with monoclonal anti-polyhistidine-peroxidase
clone HIS-1 antibody (Sigma-Aldrich) at 1:2000 ratio at 37 °C for 1 h. Membranes were washed four times for 10 min and developed with Pierce™ ECL western blotting substrate, and detected by Thermo SuperSignal™ West Femto Maximum Sensitivity Substrate and the ECL system (Amer Biosciences) according to the manufacturer’s protocols.
Negative staining. For negative stain, 2.5 µL of the sample was placed on the top of a glow-discharged grid coated with continuous carbonfilm and incubated at room temperature for 10 s to allow the proper amount of particles to adsorb. The solution was then blotted away from the grid with afilter paper. A 2.5 µL droplet of uranyl acetate solution was afterward applied on the grid for 1 min to stain the particles. Excess of uranyl acetate solution was blotted away, and the grid was left to air dry before imaging. A Tecnai F20 electron microscope equipped with Falcon II detector operated at 200 kV was used to acquire a negative stain image at room temperature, with a pixel size of 1.69 Å/pix and a total electron dose of ~50 elec-trons/Å2.
Cryo-EM data collection. Cryo-EM grids were prepared with the Vitrobot (FEI Company) equilibrated at 4 °C and 100% relative humidity. Four microliters of the sample were applied onto the Quantifoil R2/2 holey carbon grid, which had been coated with thin carbonfilm and glow-discharged. After 30 s wait and subsequent blotting, the grids wereflash-frozen in liquid ethane. Data collection was per-formed on a Titan Krios electron microscope (FEI Company) at 300 kV, using the EPU software (FEI Company) for automated data acquisition. Data were collected with a defocus of−1.2 to −3 μm at a magnification of 96,000×, giving a nominal pixel size of 0.858 Å/px. The micrographs (1856) were recorded on Falcon III direct electron detector (FEI Company) as movie stacks. The exposure time for each movie stack was ~43 s, corresponding to an electron dose of ~0.6 electrons/Å2
fractionated into 41 frames (~1.02 s/frame). Drift, gain corrections, and dose-weighting were performed with MotionCor248using all frames on 1 × 1 patches.
Data processing and map calculation. All the data processing has been per-formed using the Scipion suite49. The contrast transfer function (CTF) was
cal-culated from motion-corrected and non-dose-weighted images using GCTF50.
After removing images having poor CTF quality (leaving a total of 1758 micro-graphs), ribosome particles were picked from motion-corrected and dose-weighted images using Xmipp as implemented in Scipion51. After extraction andfivefold
binning (4.29 Å/px) of 172,729 particles, reference-free 2D classification using RELION 2.152was performed with 120 classes. After the removal of non-ribosomal
particles, the remaining 163,765 particles were subjected to three-dimensional (3D) classification using ten classes. As an initial reference, low-pass filtered to 60 Å, we used the map of the Mycobacterium tuberculosis 50S ribosome in complex with RsfS (EMDB 6177)22. After classification, 127,598 selected particles were extracted,
unbinned to their initial pixel size, and subjected to 3D auto-refinement using the same reference as for the 3D classification job. Post processing of the resulting map using automatic B factor estimation as a sharpening procedure allowed to obtain a reconstruction estimated to be at a resolution of 3.26 Å using a FSC= 0.143 gold-standard threshold. To validate the resulting map and exclude any reference bias at the level of Rsf, we additionally generated an initial model using the set of particles derived from 2D classification, as implemented in Relion 3.053, which uses a
sto-chastic gradient-descent (SGD) algorithm to generate an ab initio map, without need for an external reference. The output was used as a reference to run 3D classification and 3D refinement jobs within Relion 3.0. The generated maps were analyzed and showed clearly no differences, revealing in all cases a density in the region where RsfS is suggested to bind (Supplementary Fig. 6). We additionally performed 3D classification and 3D refinement jobs using a model of the vacant S. aureus 50S (EMD-7870), and after visual inspection, the map displayed density for Rsf as for the two previous ones.
Afterward, we extracted the particles used for 3D refinement from all the 40 movie-frames using Xmipp51and performed movie-refinement and particle
polishing jobs in RELION 2.152. Thefinal resolution of the generated map at this
step was 3.16 Å, at a gold-standard FSC= 0.143, after post processing. The output map of the 3D refinement job was used to create two masks: one around the region where RsfS should be located, based on the previous low-resolution structure22,
and the other comprising the 50S ribosomal subunit excluding this region. The latter mask was used for signal subtraction job in RELION 2.152, and the resulting
subtracted particles were subjected to two consecutive cycles of focused 3D classification on the RsfS region, without image alignment and using the previously obtained 3D refined map from the shiny particles, low-pass filtered to 40 Å. We usedfive and two classes, respectively, to sort sample heterogeneity. The final full-size images of 83,885 particles were processed by 3D auto-refine, and the resulting overall average resolution of the map was 3.23 Å, at a gold-standard FSC= 0.143, after post processing. All maps were sharpened using auto-bfac option in RELION 2.152. Local resolution was estimated using Relion 3.053.
Model building and validation. For model building, 50S subunit was extracted from the S. aureus vacant 70S ribosome model (PBD 5LI0 [https://doi.org/10.2210/ pdb5LI0/pdb])19and rigid bodyfitted into Gaussian filtered cryo-EM density map
of 50S–RsfS complex (Fig.2b). uL14 from this model was replaced by the crystal NATURE COMMUNICATIONS | https://doi.org/10.1038/s41467-020-15517-0
ARTICLE
structure of uL14–RsfS complex (this study), and flexible regions of the model that could notfit into the density were deleted. The initial coarse fitting of the flexible elements at the intersubunit interface and periphery, as well as RsfS, into the density, was performed using the NAMDinator web service54, which implements
the algorithms of molecular dynamicsflexible fitting (MDFF55), and phenix.
real_space_refinement56. The default parameters (start temperature= 298 K;
G-force scaling factor= 0.3; minimization steps = 2000; simulation steps = 20,000) were used forflexible fitting, while real-space refinement was performed separately in phenix56, including simulated annealing (starting temperature= 800 K; cool
rate= 100 K) and global minimization. Model and map were visually inspected in Coot57. The secondary structure elements and bulky aromatic amino acids were
first docked during refinement of the RsfS model (Fig.2c–e). The densities that can
be attributed to solvent molecules have been interpreted as Mg2+ions, while in order to model K+ions the structure was aligned to T. thermophilus 70S model with experimentally assigned K+ions58. Final minimization of coordinates (global
minimization with hydrogen atoms) was carried out in Phenix real-space re fine-ment at default parameters55. For model validation, we used the MolProbity
webserver59and model-to-map correlation statistics from Phenix. Data and
refinement statistics are summarized in Table1.
Expression and purification of uL14–RsfS complex. The uL14 and RsfS of S. aureus were cloned into a modified pACYCDuet-1 plasmid with a six-histidine tag fused at the N-terminus of uL14 and co-expressed in E. coli BL21star(DE3) cells. Protein expression was induced by adding 0.5 mM IPTG to the cell culture when an OD600of 0.6 was reached. The cells were harvested after 4 h of induction at
37 °C. Upon cell disruption by sonication in buffer A (20 mM Tris-HCl, 500 mM NH4Cl, pH 8.0) supplemented with phenylmethylsulfonylfluoride (PMSF), cell
lysate was cleared by 30 min centrifugation at 30,000×g followed by 1 h ultra-centrifugation at 100,000×g. The heterodimer uL14–RsfS was further purified by
Ni-NTA chromatography and eluted in a buffer A containing 300 mM imidazole. Asfinal step of purification, the protein complex was applied to a size-exclusion chromatography HiLoad 16/600 Superdex 75 prep-grade column equilibrated in Buffer B (50 mM Na2HPO4/NaH2PO4, pH 7.0 and 0.2 M NaCl (Supplementary
Fig. 5a). Complex formation and purity was verified by SDS-PAGE (Supplementary Fig. 5b).
Crystallization, data collection, and structure determination. The uL14–RsfS complex was crystallized using the hanging drop vapor diffusion method. The drops were prepared by mixing 1.2μL of protein solution with 1.2 μL reservoir solution (0.1 M MES pH 6.0, 0.2 M lithium sulfate, 20% PEG 4000). Drops were equilibrated against 250μL reservoir solution at 20 °C. Crystals appeared after 5–7 days, and were cryo-protected directly before X-ray data collection by a custom-made cryoprotectant solution (0.17 M ammonium sulfate, 25.5% PEG 8000, 15% glycerol). Preliminary X-ray data (at 4.2 Å resolution) at 100 K were collected using a Cu K-alpha radiation from a PhotonJet-S microfocus sealed tube X-ray generator (Rigaku XtaLAB Synergy-S, Kazan Federal University) equipped with µ-CMF optics (Rigaku Oxford Diffraction) and an HyPix-6000HE detector. The high-resolution diffraction data set was collected from a single crystal on ID30B beamline at the European Synchrotron Radiation Facility (ESRF, France). Diffraction data were collected using a wavelength of 0.9762 Å on a PILATUS 6 M detector with parameters experimentally optimized based on crystal mosaicity. Data were processed with XDS program package60. The structure was solved by
molecular replacement using Phaser from the Phenix package61. Protein uL14 from
S. aureus, (PDB 5ND8 [https://doi.org/10.2210/pdb5nd8/pdb]) and protein Q9KD89 from Bacillus halodurans, (PDB 2O5A [https://doi.org/10.2210/ pdb2O5A/pdb]) were used as starting models. The initially obtained model was refined using phenix.refine62, followed by iterative manual building in COOT
(Emsley et al.57) and refinement cycles in phenix.refine. Refined model contained
94.37% Ramachandran favored, 5.63% Ramachandran allowed and 0% Rama-chandran outliers. Data and refinement statistics are summarized in Table2. All figures were prepared with Chimera and Pymol63,64.
Mass spectrometry. The 50S–RsfS sample was reduced, alkylated, and digested with trypsin at 37 °C overnight. Extracted peptides were then analyzed using an Ultimate 3000 nano-RSLC (Thermo Scientific, San Jose California) coupled in line with an Orbitrap ELITE (Thermo Scientific, San Jose California). Briefly, peptides were separated on a C18 nanocolumn with a linear gradient of acetonitrile and analyzed in a Top 20 CID (Collision-induced dissociation) data-dependent mass spectrometry. Data were processed by database searching against Staphylococcus aureus Uniprot Proteome database using Proteome Discoverer 2.1 software (Thermo Fisher Scientific). Precursor and fragment mass tolerance were set at 7 ppm and 0.6 Da, respectively. Trypsin was set as an enzyme, and up to two missed
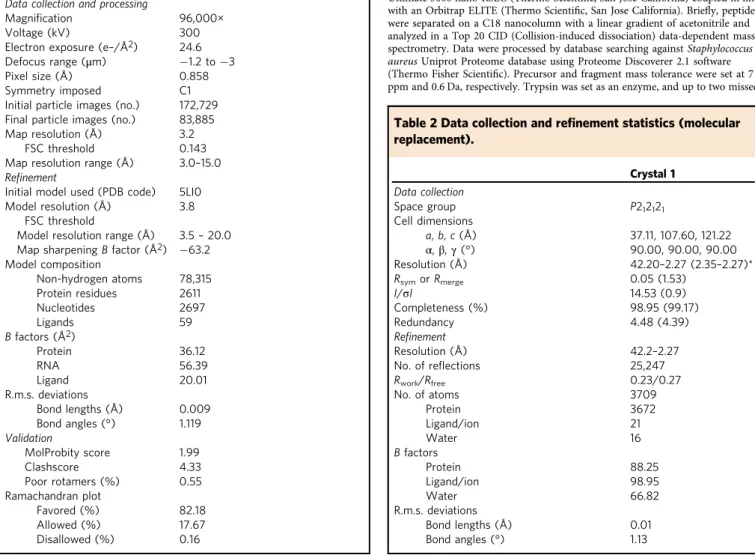
Table 1 Cryo-EM data collection, refinement, and validation
statistics.
50S–RsfS (EMD-10212) (PDB 6SJ6) Data collection and processing
Magnification 96,000× Voltage (kV) 300 Electron exposure (e–/Å2) 24.6 Defocus range (μm) −1.2 to −3 Pixel size (Å) 0.858 Symmetry imposed C1 Initial particle images (no.) 172,729 Final particle images (no.) 83,885 Map resolution (Å) 3.2
FSC threshold 0.143 Map resolution range (Å) 3.0–15.0 Refinement
Initial model used (PDB code) 5LI0 Model resolution (Å) 3.8
FSC threshold
Model resolution range (Å) 3.5– 20.0 Map sharpening B factor (Å2) −63.2
Model composition Non-hydrogen atoms 78,315 Protein residues 2611 Nucleotides 2697 Ligands 59 B factors (Å2) Protein 36.12 RNA 56.39 Ligand 20.01 R.m.s. deviations Bond lengths (Å) 0.009 Bond angles (°) 1.119 Validation MolProbity score 1.99 Clashscore 4.33 Poor rotamers (%) 0.55 Ramachandran plot Favored (%) 82.18 Allowed (%) 17.67 Disallowed (%) 0.16
Table 2 Data collection and re
finement statistics (molecular
replacement).
Crystal 1 Data collection Space group P212121 Cell dimensions a, b, c (Å) 37.11, 107.60, 121.22 α, β, γ (°) 90.00, 90.00, 90.00 Resolution (Å) 42.20–2.27 (2.35–2.27)* Rsymor Rmerge 0.05 (1.53) I/σI 14.53 (0.9) Completeness (%) 98.95 (99.17) Redundancy 4.48 (4.39) Refinement Resolution (Å) 42.2–2.27 No. of reflections 25,247 Rwork/Rfree 0.23/0.27 No. of atoms 3709 Protein 3672 Ligand/ion 21 Water 16 B factors Protein 88.25 Ligand/ion 98.95 Water 66.82 R.m.s. deviations Bond lengths (Å) 0.01 Bond angles (°) 1.13cleavages were allowed. Oxidation (M), N-term acetylation were set as variable modification and carbamidomethylation (C) as a fixed modification. Proteins were identified with a minimum of two unique peptides, and were filtered with false discovery rate <1%.
Reporting summary. Further information on research design is available in the Nature Research Reporting Summary linked to this article.
Data availability
The data supporting thefindings of this manuscript are available from the corresponding authors upon reasonable request. For the crystal structure of the uL14–RsfS complex, the coordinates and structure factors were deposited in the Protein Data Bank, PDB 6SJ5 [https://doi.org/10.2210/pdb6SJ5/pdb]. For the cryo-EM structure of the 50S–RsfS complex, coordinates were deposited in the Protein Data Bank, PDB 6SJ6 [https://doi. org/10.2210/pdb6SJ6/pdb], while the cryo-EM map was deposited in the electron microscopy database, EMD-10212. The source data underlying Fig. 1a–c, e, f and Supplementary Fig. 1a, b, Supplementary Table 1 are provided as a Source Datafile.
Received: 12 August 2019; Accepted: 5 March 2020;
References
1. Starosta, A. L., Lassak, J., Jung, K. & Wilson, D. N. The bacterial translation stress response. FEMS Microbiol. Rev. 38, 1172–1201 (2014).
2. Prossliner, T., Skovbo Winther, K., Sørensen, M. A. & Gerdes, K. Ribosome hibernation. Annu. Rev. Genet. 52, 321–348 (2018).
3. Rae, C. D., Gordiyenko, Y. & Ramakrishnan, V. How a circularized tmRNA moves through the ribosome. Science 363, 740–744 (2019).
4. Neubauer, C., Gillet, R., Kelley, A. C. & Ramakrishnan, V. Decoding in the absence of a codon by tmRNA and SmpB in the ribosome. Science 335, 1366–1369 (2012).
5. Gagnon, M. G., Seetharaman, S. V., Bulkley, D. & Steitz, T. A. Structural basis for the rescue of stalled ribosomes: structure of YaeJ bound to the ribosome. Science 335, 1370–1372 (2012).
6. James, N. R., Brown, A., Gordiyenko, Y. & Ramakrishnan, V. Translational termination without a stop codon. Science 354, 1437–1440 (2016). 7. Huter, P. et al. Structural basis for ArfA–RF2-mediated translation
termination on mRNAs lacking stop codons. Nature 541, 546–549 (2017). 8. Ma, C. et al. Mechanistic insights into the alternative translation termination
by ArfA and RF2. Nature 541, 550–553 (2017).
9. Demo, G. et al. Mechanism of ribosome rescue by ArfA and RF2. eLife 6, e23687 (2017).
10. Brown, A. et al. Structures of the human mitochondrial ribosome in native states of assembly. Nat. Struct. Mol. Biol. 24, 866–869 (2017).
11. Loveland, A. B. et al. Ribosome·RelA structures reveal the mechanism of stringent response activation. Elife 5, e17029 (2016).
12. Arenz, S. et al. The stringent factor RelA adopts an open conformation on the ribosome to stimulate ppGpp synthesis. Nucleic Acids Res. 44, 6471–6481 (2016). 13. Usachev, K. S. et al. Dimerization of long hibernation promoting factor from Staphylococcus aureus: structural analysis and biochemical characterization. J. Struct. Biol. 209, 107408 (2020).
14. Polikanov, Y. S., Blaha, G. M. & Steitz, T. A. How hibernation factors RMF, HPF, and YfiA turn off protein synthesis. Science 336, 915–918 (2012). 15. Vila-Sanjurjo, A., Schuwirth, B.-S., Hau, C. W. & Cate, J. H. D. Structural basis
for the control of translation initiation during stress. Nat. Struct. Mol. Biol. 11, 1054–1059 (2004).
16. Zhang, Y. et al. HflX is a ribosome-splitting factor rescuing stalled ribosomes under stress conditions. Nat. Struct. Mol. Biol. 22, 906–913 (2015). 17. Sohmen, D. et al. Structure of the Bacillus subtilis 70S ribosome reveals the
basis for species-specific stalling. Nat. Commun. 6, 6941 (2015). 18. Beckert, B. et al. Translational arrest by a prokaryotic signal recognition
particle is mediated by RNA interactions. Nat. Struct. Mol. Biol. 22, 767–773 (2015).
19. Khusainov, I. et al. Structure of the 70S ribosome from human pathogen Staphylococcus aureus. Nucleic Acids Res. 44, gkw933 (2016).
20. Belousoff, M. J. et al. Structural basis for linezolid binding site rearrangement in the Staphylococcus aureus ribosome. MBio 8, e00395-17 (2017). 21. Hentschel, J. et al. The complete structure of the Mycobacterium smegmatis
70S ribosome. Cell Rep. 20, 149–160 (2017).
22. Li, X. et al. Structure of ribosomal silencing factor bound to Mycobacterium tuberculosis ribosome. Structure 23, 1858–1865 (2015).
23. Yang, K. et al. Structural insights into species-specific features of the ribosome from the human pathogen Mycobacterium tuberculosis. Nucleic Acids Res. 45, 10884–10894 (2017).
24. Beckert, B. et al. Structure of the Bacillus subtilis hibernating 100S ribosome reveals the basis for 70S dimerization. EMBO J. 36, 2061–2072 (2017). 25. Khusainov, I. et al. Structures and dynamics of hibernating ribosomes from
Staphylococcus aureus mediated by intermolecular interactions of HPF. EMBO J. 36, 2073–2087 (2017).
26. Franken, L. E. et al. A general mechanism of ribosome dimerization revealed by single-particle cryo-electron microscopy. Nat. Commun. 8, 722 (2017).
27. Matzov, D. et al. The cryo-EM structure of hibernating 100S ribosome dimer from pathogenic Staphylococcus aureus. Nat. Commun. 8, 723 (2017). 28. Mishra, S., Ahmed, T., Tyagi, A., Shi, J. & Bhushan, S. Structures of
Mycobacterium smegmatis 70S ribosomes in complex with HPF, tmRNA, and P-tRNA. Sci. Rep. 8, 13587 (2018).
29. Beckert, B. et al. Structure of a hibernating 100S ribosome reveals an inactive conformation of the ribosomal protein S1. Nat. Microbiol 3, 1115–1121 (2018).
30. Flygaard, R. K., Boegholm, N., Yusupov, M. & Jenner, L. B. Cryo-EM structure of the hibernating Thermus thermophilus 100S ribosome reveals a protein-mediated dimerization mechanism. Nat. Commun. 9, 4179 (2018). 31. Jiang, M. et al. Identification of novel Escherichia coli ribosome-associated
proteins using isobaric tags and multidimensional protein identification techniques. J. Bacteriol. 189, 3434–3444 (2007).
32. Häuser, R. et al. RsfA (YbeB) proteins are conserved ribosomal silencing factors. PLoS Genet. 8, e1002815 (2012).
33. Wanschers, B. F. J. et al. C7orf30 specifically associates with the large subunit of the mitochondrial ribosome and is involved in translation. Nucleic Acids Res. 40, 4040–4051 (2012).
34. Spirin, A. S. On the equilibrium of the association-dissociation reaction of ribosomal subparticles and on the existance of the so-called‘60 S intermediate’ (‘swollen 70 S’) during centrifugation of the equilibrium mixture. FEBS Lett. 14, 349–353 (1971).
35. Davies, C., White, S. W. & Ramakrishnan, V. The crystal structure of ribosomal protein L14 reveals an important organizational component of the translational apparatus. Structure 4, 55–66 (1996).
36. Klinge, S., Voigts-Hoffmann, F., Leibundgut, M., Arpagaus, S. & Ban, N. Crystal structure of the eukaryotic 60S ribosomal subunit in complex with initiation factor 6. Science 334, 941–948 (2011).
37. Russell, D. W. & Spremulli, L. L. Purification and characterization of a ribosome dissociation factor (eukaryotic initiation factor 6) from wheat germ. J. Biol. Chem. 254, 8796–8800 (1979).
38. Valenzuela, D. M., Chaudhuri, A. & Maitra, U. Eukaryotic ribosomal subunit anti-association activity of calf liver is contained in a single polypeptide chain protein of Mr= 25,500 (eukaryotic initiation factor 6). J. Biol. Chem. 257, 7712–7719 (1982).
39. Sanvito, F. et al. Theβ4 integrin interactor p27 BBP/eIF6 is an essential nuclear matrix protein involved in 60S ribosomal subunit assembly. J. Cell Biol. 144, 823–838 (1999).
40. Basu, U., Si, K., Warner, J. R. & Maitra, U. The Saccharomyces cerevisiae TIF6 gene encoding translation initiation factor 6 is required for 60S ribosomal subunit biogenesis. Mol. Cell. Biol. 21, 1453–1462 (2001).
41. Walbot, V. & Coe, E. H. Nuclear gene iojap conditions a programmed change to ribosome-less plastids in Zea mays. Proc. Natl Acad. Sci. USA 76, 2760–2764 (1979).
42. Fung, S., Nishimura, T., Sasarman, F. & Shoubridge, E. A. The conserved interaction of C7orf30 with MRPL14 promotes biogenesis of the mitochondrial large ribosomal subunit and mitochondrial translation. Mol. Biol. Cell 24, 184–193 (2013).
43. Rorbach, J., Gammage, P. A. & Minczuk, M. C7orf30 is necessary for biogenesis of the large subunit of the mitochondrial ribosome. Nucleic Acids Res. 40, 4097–4109 (2012).
44. Finch, A. J. et al. Uncoupling of GTP hydrolysis from eIF6 release on the ribosome causes Shwachman-Diamond syndrome. Genes Dev. 25, 917–929 (2011).
45. Senger, B. et al. The Nucle(ol)ar Tif6p and Efl1p are required for a late cytoplasmic step of ribosome synthesis. Mol. Cell 8, 1363–1373 (2001). 46. Basu, A. & Yap, M.-N. F. Disassembly of the Staphylococcus aureus
hibernating 100S ribosome by an evolutionarily conserved GTPase. Proc. Natl Acad. Sci. USA 114, E8165–E8173 (2017).
47. Laemmli, U. K. Cleavage of structural proteins during the assembly of the head of bacteriophage T4. Nature 227, 680–685 (1970).
48. Zheng, S. Q. et al. MotionCor2: anisotropic correction of beam-induced motion for improved cryo-electron microscopy. Nat. Methods 14, 331–332 (2017).
49. de la Rosa-Trevín, J. M. et al. Scipion: a software framework toward integration, reproducibility and validation in 3D electron microscopy. J. Struct. Biol. 195, 93–99 (2016).
50. Zhang, K. Gctf: Real-time CTF determination and correction. J. Struct. Biol. 193, 1–12 (2016).
51. de la Rosa-Trevín, J. M. et al. Xmipp 3.0: an improved software suite for image processing in electron microscopy. J. Struct. Biol. 184, 321–328 (2013). 52. Kimanius, D., Forsberg, B. O., Scheres, S. H. & Lindahl, E. Accelerated
cryo-EM structure determination with parallelisation using GPUs in RELION-2. eLife 5, e18722 (2016).
53. Zivanov, J. et al. New tools for automated high-resolution cryo-EM structure determination in RELION-3. eLife 7, e42166 (2018).
54. Kidmose, R. T. et al. Namdinator—automatic molecular dynamics flexible fitting of structural models into cryo-EM and crystallography experimental maps. IUCrJ 6, 526–531 (2019).
55. Trabuco, L. G., Villa, E., Schreiner, E., Harrison, C. B. & Schulten, K. Molecular dynamicsflexible fitting: a practical guide to combine cryo-electron microscopy and X-ray crystallography. Methods 49, 174–180 (2009). 56. Afonine, P. V. et al. Real-space refinement in PHENIX for cryo-EM and
crystallography. Acta Crystallogr. Sect. D. Struct. Biol. 74, 531–544 (2018). 57. Emsley, P. & Cowtan, K. Coot: model-building tools for molecular graphics.
Acta Crystallogr. Sect. D. Biol. Crystallogr. 60, 2126–2132 (2004). 58. Rozov, A. et al. Importance of potassium ions for ribosome structure and
function revealed by long-wavelength X-ray diffraction. Nat. Commun. 10, 2519 (2019).
59. Chen, V. B. et al. MolProbity: all-atom structure validation for
macromolecular crystallography. Acta Crystallogr. Sect. D. Biol. Crystallogr. 66, 12–21 (2010).
60. Kabsch, W. XDS. Acta Crystallogr. Sect. D. Biol. Crystallogr. 66, 125–132 (2010).
61. McCoy, A. J. et al. Phaser crystallographic software. J. Appl. Crystallogr 40, 658–674 (2007).
62. Adams, P. D. et al. PHENIX: a comprehensive Python-based system for macromolecular structure solution. Acta Crystallogr. Sect. D. Biol. Crystallogr. 66, 213–221 (2010).
63. Pettersen, E. F. et al. UCSF Chimera? A visualization system for exploratory research and analysis. J. Comput. Chem. 25, 1605–1612 (2004).
64. The PyMOL Molecular Graphics System, Version 1.3 Schrödinger, LLC.
Acknowledgements
We thank, Liliya Nurullina, Natalia Garaeva and Daut Islamov from Kazan Federal University for their support in protein crystallization. We acknowledge the Proteomics Platform, IGBMC - CNRS UMR 7104 - Inserm U 1258 for performing mass-spectrometry analysis. We thank Hervé-William Rémigy for organizing Titan Krios microscope access in Thermofisher, Eindhoven and Warren lab (University of Cambridge) for the Anti-His tag antibody. This work was supported by the French National Research Agency grants ANR-15-CE11-0021-01 (to G.Y.); ANR-16-CE11-0007-01 RIBOSTAPH (to I.K. and M.Y.);“La Fondation pour la Recherche Médicale” DBF20160635745, France (to G.Y. and S.P.), the Russian Government Program of Competitive Growth of Kazan Federal Uni-versity (to I.K., B.F., A.B., S.V., K.U., and M.Y).
Author contributions
I.K., G.Y., and M.Y. conceived the project: A.B. cloned and purified recombinant RsfS protein under supervision of N.T. and G.A.S.; A.S. and S.V. prepared constructs for uL14 and RsfS co-expression. B.F. and K.U. purified, crystallized, collected X-ray data, solved and analyzed the crystal structure of uL14–RsfS under supervision of Az. G.; I.K. purified 70S, 50S–RsfS complex, performed modeling, and analyzed 50S–RsfS cryo-EM structure; Al.G. performed 50S–RsfS reconstitution and subsequent western blot analysis, S.P. performed cryo-EM image processing. W-T.L. and D.Z. coordinated electron microscopy experiments. I.K., B.F., and S.P. wrote the paper with input from G.Y. and M.Y.; all authors revised the paper.
Competing interests
The authors declare no competing interests.
Additional information
Supplementary information is available for this paper at https://doi.org/10.1038/s41467-020-15517-0.
Correspondence and requests for materials should be addressed to I.K., G.Y. or M.Y. Peer review information Nature Communications thanks Joaquin Ortega, and the other, anonymous, reviewer(s) for their contribution to the peer review of this work. Peer reviewer reports are available.
Reprints and permission information is available athttp://www.nature.com/reprints
Publisher’s note Springer Nature remains neutral with regard to jurisdictional claims in published maps and institutional affiliations.
Open Access This article is licensed under a Creative Commons Attribution 4.0 International License, which permits use, sharing, adaptation, distribution and reproduction in any medium or format, as long as you give appropriate credit to the original author(s) and the source, provide a link to the Creative Commons license, and indicate if changes were made. The images or other third party material in this article are included in the article’s Creative Commons license, unless indicated otherwise in a credit line to the material. If material is not included in the article’s Creative Commons license and your intended use is not permitted by statutory regulation or exceeds the permitted use, you will need to obtain permission directly from the copyright holder. To view a copy of this license, visithttp://creativecommons.org/ licenses/by/4.0/.