Supporting Information
1 2
Genomic footprints of repeated evolution of CAM
3
photosynthesis in a Neotropical species radiation
4 5
MARYLAURE DE LA HARPE1,2#, MARGOT PARIS1,2#*, JAQUELINE HESS1#, MICHAEL HARALD 6
JOHANNES BARFUSS1, MARTHA LILIANA SERRANO-SERRANO3, ARINDAM GHATAK4,5, PALAK 7
CHATURVEDI4,5, WOLFRAM WECKWERTH4,5, WALTER TILL1, NICOLAS SALAMIN3, CHING MAN 8
WAI6, RAY MING7, CHRISTIAN LEXER1,2 9
# Marylaure de la Harpe, Margot Paris and Jaqueline Hess should be considered joint first author 10
*Corresponding author: margot.paris@unifr.ch 11
12
1University of Vienna, Faculty of Life Sciences, Department of Botany and Biodiversity Research, Division of Systematic and Evolutionary
13
Botany, Rennweg 14, A-1030 Vienna, Austria, 2University of Fribourg, Department of Biology, Unit of Ecology & Evolution, Chemin du
14
Musée 10, CH-1700 Fribourg, Switzerland, 3University of Lausanne, Faculty of Biology and Medicine, Department of Ecology and
15
Evolution, Biophore, 1015 Lausanne, Switzerland, 4University of Vienna, Faculty of Life Sciences, Department of Functional and
16
Evolutionary Ecology, Division of Molecular Systems Biology (MOSYS), Althanstraße 14 (UZA I), 1090 Vienna, Austria, 5University of
17
Vienna, Vienna Metabolomics Center (VIME), Althanstraße 14 (UZA I), 1090 Vienna, Austria, 6Michigan State University, College of
18
Agriculture & Natural Resources, Department of Horticulture, 1066 Bogue Street, East Lansing, MI 48824, U.S.A, 7University of Illinois at
19
Urbana-Champaign, School of Integrative Biology, Department of Plant Biology, 265 Morrill Hall, MC-116, 505 South Goodwin Avenue,
20 Urbana, IL 61801, U.S.A. 21 22 23
Supplemental Text
241) Carbon isotope phenotyping
25
Whole tissue
carbon isotope ratios (
13C/
12C) can be used to characterize typical C
3
and CAM
26
plants, especially in combination with distinct morphological and anatomical features as are
27
present in bromeliads (Fig. 1). Carbon isotope ratios recovered for the studied species
28
indicate a continuum of values ranging from typical C
3to fairly strong CAM (Fig. 1),
29
following commonly used thresholds. Many species in our sample set displayed typical C
330
carbon isotope (δ
13C) phenotypes far beyond -20‰ and in fact reaching as far into the C
331
extreme as -30‰ (labelled green in Fig. 1). Tillandsia australis (Taust), our C
3reference
32
taxon also used for transcriptome-wide expression profiling (below), exhibited δ
13C values of
-26 to -29‰, clearly beyond the -20‰ threshold commonly used to classify C
3plants. This
34
species also exhibited all other phenotypic features expected for C
3bromeliads, including
35
tank-forming rosettes, no succulence, and absence of dense trichome cover. On the other end
36
of the C
3/CAM continuum, T. ionantha exhibited a δ
13C value of only -13.9‰, indicating it
37
represents a so-called ´strong´ CAM species (labelled in yellow in Fig. 1). The three CAM
38
taxa sampled for expression profiling in our study (below) exhibited a broad range of
CAM-39
like δ
13C values, from weak CAM in T. floribunda (Tflor, δ
13C = -18.6 to -20.3‰) to
40
relatively strong CAM in T. sphaerocephala (Tspha, δ
13C = 15.2 to -16.2‰) and T.
41
fasciculata (Tfasc, δ
13C = -14.5 to -18.3); species exhibiting pronounced, strong CAM
42
typically exhibit δ
13C values that are less negative than -20‰.
43
Although measuring night-time acidity under drought stress is preferable for
44
distinguishing true C
3species from inducible, facultative CAM species, we opted for carbon
45
isotope ratios based on clear restrictions presented by our study system. First, our sampling of
46
highly divergent phenotypic forms made it challenging to derive comparable ‘common
47
garden’ drought conditions across all species. Second, our work relied on precious living
48
collections in botanical gardens and experimentation thus required careful consideration to
49
avoid the loss of individual accessions. While we cannot exclude that some species classified
50
as C
3-like here include facultative CAM plants, we use isotopic ratios as a proxy to partition
51
species according to the extremes of the distribution of this continuous phenotypic trait for
52
our evolutionary analyses. This is a conservative and pragmatic strategy, since phenotyping
53
error would likely diminish the signal-to-noise ratio.
54
55
2) Phylogenetic analyses and ancestral state reconstruction (ASR)
56
A total of 177 Tillandsioideae species (203 accessions) were used for the ASR analyses. The
57
table below describes in detail the taxonomic distribution of the selected species. We used the
number
of
accepted
species
names
provided
by
Gouda
&
Butcher
59
(http://bromeliad.nl/bromNames/). This list is used for the 'Encyclopaedia of Bromeliads'
60
(http://bromeliad.nl/encyclopedia/) and is updated on a daily basis.
61
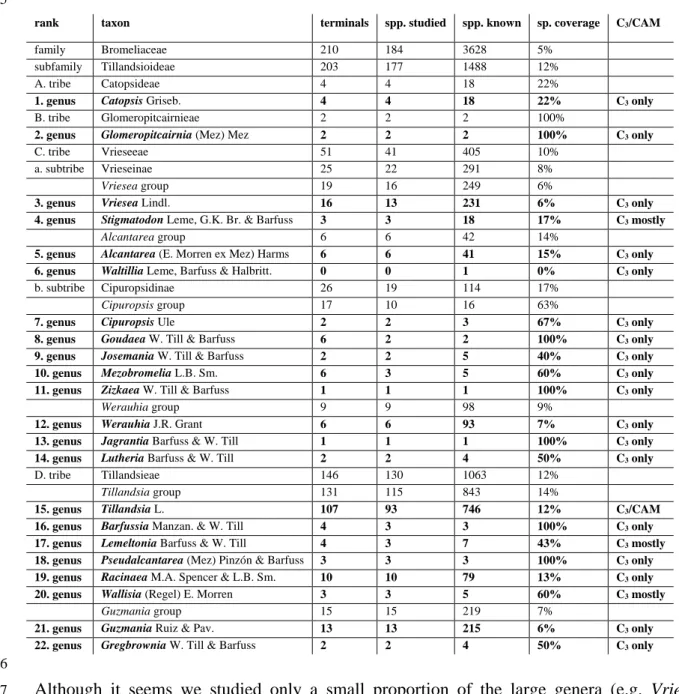
TABLE representing the number of terminals used, and species studied in comparison to known species. Most 62
recent species numbers are from: Gouda, E.J. & Butcher, D. (cont. updated) A List of Accepted Bromeliaceae 63
Names [http://bromeliad.nl/bromNames/]. University Botanic Gardens, Utrecht (accessed: 08-06-2020).
64 65
rank taxon terminals spp. studied spp. known sp. coverage C3/CAM
family Bromeliaceae 210 184 3628 5%
subfamily Tillandsioideae 203 177 1488 12%
A. tribe Catopsideae 4 4 18 22%
1. genus Catopsis Griseb. 4 4 18 22% C3 only
B. tribe Glomeropitcairnieae 2 2 2 100%
2. genus Glomeropitcairnia (Mez) Mez 2 2 2 100% C3 only
C. tribe Vrieseeae 51 41 405 10%
a. subtribe Vrieseinae 25 22 291 8%
Vriesea group 19 16 249 6%
3. genus Vriesea Lindl. 16 13 231 6% C3 only
4. genus Stigmatodon Leme, G.K. Br. & Barfuss 3 3 18 17% C3 mostly
Alcantarea group 6 6 42 14%
5. genus Alcantarea (E. Morren ex Mez) Harms 6 6 41 15% C3 only
6. genus Waltillia Leme, Barfuss & Halbritt. 0 0 1 0% C3 only
b. subtribe Cipuropsidinae 26 19 114 17%
Cipuropsis group 17 10 16 63%
7. genus Cipuropsis Ule 2 2 3 67% C3 only
8. genus Goudaea W. Till & Barfuss 6 2 2 100% C3 only
9. genus Josemania W. Till & Barfuss 2 2 5 40% C3 only
10. genus Mezobromelia L.B. Sm. 6 3 5 60% C3 only
11. genus Zizkaea W. Till & Barfuss 1 1 1 100% C3 only
Werauhia group 9 9 98 9%
12. genus Werauhia J.R. Grant 6 6 93 7% C3 only
13. genus Jagrantia Barfuss & W. Till 1 1 1 100% C3 only
14. genus Lutheria Barfuss & W. Till 2 2 4 50% C3 only
D. tribe Tillandsieae 146 130 1063 12%
Tillandsia group 131 115 843 14%
15. genus Tillandsia L. 107 93 746 12% C3/CAM
16. genus Barfussia Manzan. & W. Till 4 3 3 100% C3 only
17. genus Lemeltonia Barfuss & W. Till 4 3 7 43% C3 mostly
18. genus Pseudalcantarea (Mez) Pinzón & Barfuss 3 3 3 100% C3 only
19. genus Racinaea M.A. Spencer & L.B. Sm. 10 10 79 13% C3 only
20. genus Wallisia (Regel) E. Morren 3 3 5 60% C3 mostly
Guzmania group 15 15 219 7%
21. genus Guzmania Ruiz & Pav. 13 13 215 6% C3 only
22. genus Gregbrownia W. Till & Barfuss 2 2 4 50% C3 only 66
Although it seems we studied only a small proportion of the large genera (e.g. Vriesea,
67
Werauhia, Guzmania, Racinaea, Tillandsia), the samples provided in the analysis were
68
carefully selected and cover almost the whole taxonomic and morphological range within
We used two complementary methods for species tree estimation: ASTRAL, a
71
coalescent-based summary method (Fig. 1) and RAxML which infers maximum likelihood
72
(ML) based phylogenetic trees (SI Fig. 2). The ML tree was inferred using the program
73
RAxML v8.228 with a GTRGAMMA model and 100 bootstrap replicates to determine
74
branch support. For detailed settings used for estimation of the ASTRAL tree please refer to
75
Materials and Methods in the main text.
76
Both trees are identical, except for the position of Tillandsia disticha which in the
77
ASTRAL tree is placed sister to subgenus Tillandsia. In the RAxML tree the split involving
78
this species is inferred as basal to all main Tillandsia clades.
79
To establish the macro-evolutionary framework for this study, we used the R Package
80
diversitree (v.0.9-11) to reconstruct the ancestral states of photosynthetic syndrome on the
81
largest currently available phylogenetic tree for tillandsioid bromeliads (Barfuss et al. 2016).
82
This maximum likelihood (ML) tree comprised 210 taxa, representing roughly 30% taxon
83
sampling. We used the Multiple State Speciation and Extinction (MuSSE) algorithm
84
implemented in diversitree (FitzJohn 2012), coding photosynthetic syndrome as either 1 for
85
C
3photosynthesis, 2 for intermediate or ‘Winter Holtum Zone’ (WHZ, δ13C from -23.0‰ to
86
-19.0‰), and 3 for CAM photosynthesis. The three states were inferred from published data
87
(Crayn et al. 2015) and newly collected carbon isotope ratio values for a total of 27 species
88
(Fig. 1). Character states for all included species are listed in SI Table 6. The sampling.f
89
parameter in diversitree was used to represent the estimated fraction of species included in
90
the phylogeny for each photosynthetic state: for C
3, 112/524=0.213740458, for WHZ
91
30/107=0.280373832, for CAM 68/227=0.299559471. We used maximum likelihood to
92
compare the following models: null (all birth and death rates equal between states), full (all
93
rates of speciation and extinction depend on character state), lambda (diversification rate λ
94
varies between states), mu (extinction rate μ varies between states), lambda.mu (λ & μ vary,
but character transitions are ordered), and fit.unordered (λ & μ are constant, with full flexible
96
transition process). Lambda (variable λ between states) was inferred as the best model based
97
on likelihoods and AIC values (logLik= 829.6978, AIC= -1649.396), and ancestral states
98
were thus constructed within this model.
99
lnLik logLik() AIC()
fit.null 837.84 837.8432 (df=3) -1669.69 fit.full 874.3 874.2964 (df=12) -1724.59 fit.lambda 829.7 829.6978 (df=5) -1649.4 fit.mu 847.18 847.1797 (df=5) -1684.36 fit.lambda.mu 853.29 853.2904 (df=7) -1692.58 fit.unordered 857.52 857.5183 (df=8) -1699.04 100
3) CNV analyses: Detailed implementation of the CNVkit analysis
101
Relative copy numbers were estimated in a two-step approach: i) estimation of base copy
102
number (CN) state in Alcantarea trepida through comparison with Ananas comosus. ii)
103
estimation of CN in Tillandsia samples relative to A. trepida, scaling of Tillandsia CN with
104
A. trepida base CN. For both analyses we applied a stringent coverage-based filtering to
105
exclude unmappable regions since we cannot distinguish them from lost genes. Coverage
106
cutoffs were set as follows: filtered_exon_set_1 (Aco-Atre analysis) – retain only exons with
107
mean coverage of at least five, filtered_exon_set2 (Atre-Tillandsia analysis) – retain only
108
exons with mean coverage of at least five in five or more species. This resulted in a total of
109
19,298 discoverable genes in filtered_exon_set2 (roughly 2/3rds of the genome).
110
In order to derive meaningful log2 thresholds for CNV calling, we used deeply
111
conserved single-copy orthologs in the pineapple to estimate variation in coverage. To this
112
end, we used BUSCO v3
7to obtain the set of single-copy orthologs using the A. comosus
113
predicted proteome and the “embryophyta_odb9” database. To derive per-sample single copy
thresholds we calculated the weighted average log2 ratios across exon bins for each of the
115
BUSCO genes. The resulting distributions are shown below.
116
Species 1st Qu. Median Mean 3rd. Qu. 2.50% 97.50%
Tillandsia leiboldiana -0.1389 -0.02263 -0.01518 0.09641 -0.4906562 0.5907426 Tillandsia australis -0.08921 -0.003557 -0.004812 0.07833 -0.4050659 0.4650078 Tillandsia propagulifera -0.08921 -0.003557 -0.004812 0.07833 -0.3229344 0.3847263 Tillandsia floribunda -0.09287 -0.003627 -0.00184 0.07432 -0.3525346 0.3999353 Tillandsia latifolia ssp. latifolia -0.1014 -0.01013 -0.006266 0.08504 -0.4294942 0.6181706 Tillandsia trauneri -0.1078 -0.008357 0.005459 0.0832 -0.3475898 0.6060711 Tillandsia hitchcockiana -0.1047 -0.01453 -0.006099 0.07408 -0.3488612 0.5124046 Tillandsia sphaerocephala -0.09096 -0.009717 0.001125 0.07442 -0.3531745 0.4825815 Tillandsia adpressiflora -0.08112 -0.007189 -0.01488 0.06597 -0.3108748 0.4262556 Tillandsia somnians -0.08239 -0.005033 -0.005541 0.07851 -0.3314174 0.550001 Tillandsia stenoura -0.09341 -0.004734 0.02142 0.09441 -0.3748035 0.6693527 Tillandsia complanata -0.08054 -0.0008737 0.02569 0.08393 -0.2753471 0.568465 Tillandsia fasciculata -0.08956 -0.01163 0.007404 0.07773 -0.336556 0.5267081 Tillandsia juncea -0.09474 -0.007876 -0.004926 0.06462 -0.3213492 0.4067321 Tillandsia stricta -0.1053 -0.005714 -0.0399 0.0946 -0.4515171 0.4965152 Vriesea itatiaiae -0.09843 -0.01375 -0.01111 0.06589 -0.3339326 0.3725004
Based on these results, we settled to set cutoffs of log2(allele_count-0.5/alleles) for copy
117
number decrease and log2(allele_count+1/alleles) for copy number increase which
118
corresponds to log2(1.5/2) and log2(3/2) for a single-copy locus with two alleles. This
119
encompasses the empirically observed range of variation and is dynamically adjusted to
120
accommodate increasing variation we expect to be associated with CN > 1 in the reference
121
sequence A. trepida.
123
CAFÉ error model estimation and model selection
124
In order to account for inaccuracies in the CN estimates and differences in accuracy between
125
species, e.g. due to variation in coverage, we estimated an error model to be applied to each
126
species via a built-in estimator supplied with CAFÉ. This resulted in the following best-fit
127
error models:
128 129
Sample Name Error rate
Tillandsia fasciculata 0.03515625
Tillandsia trauneri 0.0309375
Tillandsia propagulifera 0.00140625
Tillandsia juncea 0.03515625
Tillandsia latifolia ssp. latifolia 0.01125
Tillandsia australis 0.00703125
Tillandsia hitchcockiana 4.34E-19
Tillandsia floribunda 0.00703125 Tillandsia leiboldiana 0.06328125 Tillandsia complanata 0.01125 Tillandsia somnians 0.00703125 Tillandsia adpressiflora 0.00140625 Tillandsia stenoura 0.00984375 130
We first ran CAFÉ using a single global rate model. Based on the observation of an apparent
131
increase in the rates of duplication and loss in the subgenus Tillandsia, we also tested a
two-132
rate model allowing for separate rates of evolution in this subgenus. Each model was run
three times to check convergence of ML estimates and significance was determined using the
134
Akaike Information Criterion (AIC) as below:
135
Global model Score
Run1 0.00101061203283 0.00027763568401 61203.9
Run2 0.00101060963310 0.00027763236492 61203.9
Run3 0.00101060978654 0.00027763425550 61203.9
Two-rate model Score
Run1 0.00079544338562 0.00284107269136 0.00023883871686 0.00086474231103 60340.4 Run2 0.00079544582304 0.00284121037836 0.00023883335117 0.00086475802060 60340.4 Run3 0.00079543765336 0.00284102919941 0.00023884156640 0.00086464833310 60340.4 136
Model testing using AIC with the best run of the one- and two rate models:
137
lnL #params AIC AIC
One rate -61203.9 2 122411 1727
Two rate -60340.4 4 120684
AIC = 2k - 2ln(L) where k = number of parameters.
Supplemental Figures
139
140
SI_Figure_1. Ancestral state reconstruction (ASR) of photosynthetic phenotype on the 210-taxa phylogenetic 141
tree by Barfuss et al. (2016). Green, C3; yellow, CAM; blue, Winter Holtum Zone. Taxa in red were subjected to 142
whole genome sequencing (WGS) in the present study. Ancestral states inferred from this tree were carried over 143
to the WGS tree presented in the main paper as described in the main text. 144
145 146 147
SI_Figure_2. Multispecies coalescent (ASTRAL) phylogenetic tree of 28 whole-genome sequenced tillandsioid 148
bromeliad taxa (species of Tillandsia and related genera), including Alcantarea trepida and Vriesea itatiaiae as 149
outgroups for phylogenetic analysis, and Ananas comosus, the species used to anchor most analyses presented in 150
this study. Posterior probabilities are indicated for all branches. 151
152 153
SI_Figure_3. Maximum likelihood (RAxML) phylogenetic tree of 28 whole-genome sequenced tillandsioid 154
bromeliad taxa (species of Tillandsia and related genera), including Alcantarea trepida and Vriesea itatiaiae as 155
outgroups for phylogenetic analysis, and Ananas comosus, the species used to anchor most analyses presented in 156
this study. Bootstrap values of 100 were observed for all branches. 157
158 159
SI_Figure_4. SplitsTree network based on whole genome sequencing (WGS) of all sampled taxa, with C3 and 161
CAM taxa labelled in green and yellow respectively. 162 163 164 165 166 167 168 169 170 171 172 173 174 175 176 177 178 179
SI_Figure_5. Multi dimensional scaling (MDS) plot of RNA-seq count data. Top axes from Multi Dimensional 180
Scaling (MDS) analysis of differential gene expression (DE) data. 181 182 183 184 185 186 187 188 189 190 191 192 193 194 195 196 197 198 199 200 201 202
SI_Figure_6: Day/night RNAseq comparisons. Results from transcriptome-wide analysis of differential gene 203
expression (DE) between two sampling time points, night (1AM) and day (11AM), referred to as “intraspecific 204
day/night” test throughout the text. Shown are results at FDR<0.05 for logFC values >1 or <1 (i.e. pruning away 205
logFC values close to zero). A, Venn chart depicting similarities and differences in temporal DE patterns 206
between the studied species. B, Clustering heatmap for transcripts shared by all taxa (35 genes), corresponding 207
to the central overlap field in the Venn chart. Red and blue colors in the heatmap indicate up- and down-208
regulation during the day, respectively. The key CAM enzyme PEPC kinase (PPCK; down-regulated during the 209
day) is highlighted in blue font. Species designations are Taust, T. australis - C3; Tspha, T. sphaerocephala – 210
CAM; Tfasc, T. fasciculata – CAM; Tflor, T. floribunda - CAM. Color labels for species are consistent with 211
figures relating to RNA-seq in the main text. 212 213 214 215 216 217
SI_Figure_7. Gene ontology (GO) enrichment results for interspecific CAM-C3 comparisons. Results of gene 218
ontology (GO) enrichment analysis for significant genes (FDR<0.05) from transcriptome-wide “interspecific 219
day/night” DE tests. Shown are the 10 most significantly enriched GO terms for each species, excluding GO 220
terms represented by less than two genes. The two subfigures entitled „DAY“ and „NIGHT“ are composed by 221
the same graphical elements. First, rosette plots for genes within each of the enriched GO terms are presented, 222
with red and blue dots indicating up- and down-regulation of single genes, respectively. Wedges in the inner 223
portions of the rosettes designate z-scores based on logFC values for each gene in each group, thus indicating 224
general trends of up- or down- expression in each group (red, increasing: blue, decreasing). Then, a table 225
indicates the identities and descriptions of the top GO terms, including their occurrence in each species. *: 226
significant enrichment at the 5% level; check-symbol: GO term found in a particular species but no significant 227
enrichment; X: GO term not found in a particular species. Colored cells in the tables correspond to those GO 228
terms depicted in the rosette plots. 229 230 231 232 233 234 235 236
SI_Figure_8. GO enrichment analysis on the subsets of overlapping significant genes for the tree CAM species 238
(see Figure 4, A). Enriched GO terms are presented for each of the three tested conditions: during the day (GO 239
terms n° 1 to n° 8), during the night (n°2, n°7, and n° 9 to n° 15), and a subset of night-specific genes after 240
pruning out the day-overlapping genes. For each subcategory (day, night, and night only) we depict the 8 most 241
significantly enriched GO terms, with emphasis on the photosynthesis-related day-specific (bold, n°3) and 242
night-specific (bold; n°10 to n°12) terms. Rosette plots highlight the relative contribution of up- and 243
downregulated genes to each term and the overall trend (middle circle). 244
245 246
SI_Figure_9. KEGG map for starch/sucrose metabolism (ko00500). 248
249 250
SI_Figure_10. Extended target gene list for interspecific C3/CAM differential gene expression analyses with pineapple expression data. Heatmaps depicting inter-specific 251
C3/CAM DE patterns for homologue clusters of genes with potential involvement in CAM photosynthesis and carbohydrates metabolism based on evidence from pineapple, 252
Ananas comosus (Ming et al. 2015; Wai et al. 2017). The original 65 CAM-related candidate genes used to identify the homologue clusters are underlined.
253 254
References
255
Aldous, S. H. et al. Evolution of the Phosphoenolpyruvate Carboxylase Protein Kinase Family in C3 and C4 256
Flaveria spp. Plant Physiol. (2014). doi:10.1104/pp.114.240283 257
Bräutigam, A., Schlüter, U., Eisenhut, M. & Gowik, U. On the Evolutionary Origin of CAM Photosynthesis. 258
Plant Physiol. 174, 473–477 (2017).
259
Crayn, D. M., Winter, K. & Smith, J. A. C. Multiple origins of crassulacean acid metabolism and the epiphytic 260
habit in the Neotropical family Bromeliaceae. Proc. Natl. Acad. Sci. 101, 3703–3708 (2004). 261
Gouda, E. J. & Butcher, D. (cont. updated) A List of Accepted Bromeliaceae
262
Names[http://bromeliad.nl/bromNames/]. University Botanic Gardens, Utrecht (accessed: 08-06-2020).
263
Males, J. Concerted anatomical change associated with crassulacean acid metabolism in the Bromeliaceae. 264
Functional Plant Biol. 45, 681–695 (2018).
265
Ming, R. et al. The pineapple genome and the evolution of CAM photosynthesis. Nat. Genet. 47, 1435–1442 266
(2015). 267
Mirarab, S. & Warnow, T. ASTRAL-II: Coalescent-based species tree estimation with many hundreds of taxa 268
and thousands of genes. Bioinformatics (2015). doi:10.1093/bioinformatics/btv234 269
O'Brien, T. P., Feder, N., & McCully, M. E. Polychromatic staining of plant cell walls by toluidine blue O. 270
Protoplasma, 59(2), 368-373 (1964).
271
Pierce, S., Winter, K. & Griffiths, H. Carbon isotope ratio and the extent of daily CAM use by Bromeliaceae. 272
New Phytol. 156, 75–83 (2002).
273
Kraus, J. E., de Sousa, H. C., Rezende, M. H., Castro, N. M., Vecchi, C., & Luque, R. Astra blue and basic 274
fuchsin double staining of plant materials. Biotech. Histochem. 73(5), 235-243 (1998). 275
Silvera, K. et al. Evolution along the crassulacean acid metabolism continuum. Functional Plant Biology 37, 276
995–1010 (2010). 277
Stamatakis, A. RAxML version 8: A tool for phylogenetic analysis and post-analysis of large phylogenies. 278
Bioinformatics (2014). doi:10.1093/bioinformatics/btu033
Wai, C. M. et al. Temporal and spatial transcriptomic and microRNA dynamics of CAM photosynthesis in 280
pineapple. Plant J. 92, 19–30 (2017). 281
Waterhouse, R. M. et al. BUSCO applications from quality assessments to gene prediction and phylogenomics. 282
Mol. Biol. Evol. 35, 543–548 (2018).
283
Winter, K. & Holtum, J. A. M. How closely do the d13C values of Crassulacean acid metabolism plants reflect 284
the proportion of CO2 fixed during day and night? Plant Physiol. 129, 1843–1851 (2002). 285
286 287
![[PDF] Formation pdf Arduino projet exemple | Cours Arduino](data:image/gif;base64,R0lGODlhAQABAIAAAP///wAAACH5BAEAAAAALAAAAAABAAEAAAICRAEAOw==)