HAL Id: hal-01637146
https://hal.archives-ouvertes.fr/hal-01637146
Submitted on 5 Apr 2019
HAL is a multi-disciplinary open access
archive for the deposit and dissemination of
sci-entific research documents, whether they are
pub-lished or not. The documents may come from
teaching and research institutions in France or
abroad, or from public or private research centers.
L’archive ouverte pluridisciplinaire HAL, est
destinée au dépôt et à la diffusion de documents
scientifiques de niveau recherche, publiés ou non,
émanant des établissements d’enseignement et de
recherche français ou étrangers, des laboratoires
publics ou privés.
In Situ and Real Time Observation of Microstructure
Formation during Directional Solidification of a
3D-alloy: Experiments in the DECLIC-DSI
Nathalie Bergeon, Fatima L. Mota, Jorge Pereda, Damien Tourret, Younggil
Song, Jean-Marc Debierre, Rahma Guerin, Alain Karma, Rohit Trivedi,
Bernard Billia
To cite this version:
Nathalie Bergeon, Fatima L. Mota, Jorge Pereda, Damien Tourret, Younggil Song, et al.. In Situ and
Real Time Observation of Microstructure Formation during Directional Solidification of a 3D-alloy:
Experiments in the DECLIC-DSI. International Journal of Microgravity Science and Application,
Japan Society of Microgravity Application, 2016, 33 (2), pp.330207. �10.15011/jasma.33.330207�.
�hal-01637146�
Int. J. Microgravity Sci. Appl., 0 (0) (0) 1
DOI:
In Situ and Real Time Observation of Microstructure Formation during
Directional Solidification of a 3D-alloy: Experiments in the DECLIC-DSI
Nathalie Bergeon
1,
Fatima L. Mota
1, Jorge Pereda
1, Damien Tourret
2, Younggil Song
2, Jean-Marc Debierre
1,
Rahma Guérin
1, Alain Karma
2, Rohit Trivedi
3and Bernard Billia
1Abstract
To analyze the fundamental mechanisms active in the formation of three-dimensional (3D) arrays of cells and dendrites under diffusive growth conditions, in situ monitoring of series of experiments on transparent model alloy was carried out in the DECLIC Directional Solidification Insert on-board the International Space Station, offering a very unique opportunity to in situ characterize the whole development of the microstructure in extended 3D patterns. Some of the most striking results are here presented. Microgravity environment provided the conditions to get benchmark data in diffusive transport conditions; the comparison with ground experiments will be performed to highlight the influence of convection in terms of primary spacing distributions. Oscillatory breathing modes observed for the very first time in bulk samples will also be described with the support of 3D-phase-field simulations.
Keyword(s): Solidification, DECLIC, microgravity, convection, oscillating patterns
1. Introduction
The study of solidification microstructure formation and selection is very important in the engineering and processing of advanced new materials 1). The interface patterns formed by solidification largely govern mechanical and physical properties of materials. The two most typical microstructures are cells and dendrites, and their characteristics profoundly influence the properties of a wide range of commercial metallic alloys. The correlation between microstructure and processing conditions can be best examined by directional solidification experiments in which all parameters can be accurately and independently controlled.
The evolution of the spatial pattern of cells or dendrites occurs under dynamic conditions of growth in which the forming pattern reorganizes into a rather periodic array so that in situ and real time observation of the solid-liquid interface is a precious tool to get a detailed knowledge of the entire
time-evolution of the interface pattern. This explains the extensive use of transparent organic analogs that behave like metallic alloys regarding solidification but are transparent to visible light so that classical optical techniques are sufficient for their observation 2).
A major impediment in the study of three-dimensional pattern evolution in ground-based experiments is the strong influence of convection on cellular and dendritic patterns. Extensive ground-based studies carried out in metallic and organic bulk samples have clearly established that fluid flow modifies the structure of the solute boundary layer that influences the pattern development 3, 4). Directional solidification experiments under low gravity conditions provide a unique setting to investigate microstructure development in spatially extended sample geometries with negligible convection and under well-controlled conditions of growth rate, temperature gradient and alloy composition. Consequently, those experiments provide unique benchmark
1 Aix Marseille Université, CNRS, IM2NP UMR 7334, 13397, Marseille, France 2 Physics Department, Northeastern University, Boston, USA
1–2
data to validate the predictions of theoretical and computational models in a purely diffusive growth regime. The study presented here was thus conducted using the Directional Solidification Insert (DSI) dedicated to in situ and real time characterization of the dynamical selection of the solid-liquid interface morphology in bulk samples of transparent materials, which was developed by the French Space Agency (CNES) in the frame of the DECLIC project (Dispositif pour l'Etude de la Croissance et des LIquides Critiques). The DECLIC facility of CNES was launched with 17-A shuttle flight (August 2009) as part of a joint NASA/CNES research program and is installed on the International Space Station in microgravity environment. The main instrument monitoring is performed from the CADMOS center (Center for the Development of Microgravity Applications and Space Operations Plans: French User Support and Operation Centre) in Toulouse. Taking advantage of provided tele-science capabilities, scientists have the possibility to follow in near real-time conditions and to remotely control experiments. The commissioning of the DSI was realized in December 2009 and six runs of two to three weeks each were performed from April 2010 to April 2011. The DSI was then brought back on ground and two runs of two weeks have been performed at the CNES center with similar control parameters than experiments in µg so that convection influence could be addressed.
After a brief description of the experimental procedure and methods of analysis of images, some of the most striking results will be described. We will first present a comparison of ground and spatial experiments to evidence some effects of convection. Then, we will describe the characteristics of oscillating cellular patterns that have been for the very first time imaged in large samples thanks to the microgravity environment.
2. Experimental procedure
The DECLIC-DSI insert mainly contains 2 elements: the Bridgman furnace and the experimental cartridge. Complete descriptions of DECLIC and its inserts can be found in 5, 6).
The experimental cartridge includes the quartz crucible and a system of volume compensation made of stainless steel that is useful to accommodate the specimen volume variations
associated to phase changes. The cylindrical crucible has an inner diameter of ten millimeters and a length that enables about ten centimeters solidification, thus allowing the study of the whole development of extended 3D patterns from the initial stage to the steady state. The crucible is equipped with a flat glass window at the bottom and a lens immersed in the melt at the top.
A schematic of the optical diagnostics is given in Fig. 1. In this figure, the experimental cartridge is reduced to a cylinder with liquid on top and solid at the bottom, inserted in the furnace. The main observation mode (Axial observation) takes advantage of the complete axial transparency of the cartridge: the light coming from LEDs (noted LEDs Axial) passes through the cartridge from the bottom to the top, therefore crossing the interface. The optical imaging system formed by the immersed lens and a following relay lens forms the image of the interface on a CCD camera (noted CCD Axial). On the same cartridge axis, a Mach-Zehnder interferometer using the He-Ne laser is also set but it will not be detailed here (more information on its use can be found in 7)). The interface can also be observed from the side (Transverse observation) using the LEDs and CCD camera both noted “Trans.” on Fig. 1.
In this study, we used a Succinonitrile (SCN) – 0.24 wt% Camphor alloy. In order to fill the crucible, SCN purified by NASA by both distillation and zone melting was used. The alloy was then prepared by adding the solute. All procedures for sample preparation were carefully realized under vacuum to avoid humidity contamination. Once sealed, the cartridge was inserted inside the Bridgman furnace.
A thermal gradient ranging from 10 to 30 K.cm−1 is imposed by regulated hot and cold zones, respectively, located above and below the adiabatic area where the interface is positioned. Upward solidification is achieved by pulling the crucible down into the cold zone of the furnace at a rate ranging from 0.1 to 30 µm/s. For a defined alloy concentration, varying the thermal gradient or more conveniently, the pulling rate, leads to the development of various interface morphologies, ranging from planar front (high gradient – low pulling rate) to cellular and finally dendritic pattern (low gradient – high pulling rate).
In situ and continuous observation leads to a huge amount of images so that adequate and as systematic as possible procedures had to be developed and validated to extract relevant quantitative data. Quantitative characterization of the patterns consists in measuring the evolution, as a function of time and growth parameters, of the parameters that describe the interface morphology, such as the primary spacing, order/disorder level of pattern, 3D-shape and the tip radius. Concerning shape of structures and tip radius, measurements are based on interferometric analysis that is not described here. For more information on shape reconstruction by interferometric analysis in DECLIC-DSI, one may refer to Bergeon et al. 7).
Image treatment and analysis procedures have been developed on Visilog Image Analysis Software (Noesis, France) to facilitate exploitation of results. The first step is to obtain a binary image that is then used as an input for specific procedures dedicated to the determination of the primary spacing distribution and the characterization of the pattern
limited to characterization of primary spacing evolution. Primary spacing can be considered as the center to center distance between two neighboring cells. Its determination requires beforehand cell detection and identification. Each cell center is then determined together with the identification of the first neighbors so that center to center distances can be calculated. The spacing histogram is then drawn to determine the average spacing and the standard deviation, the minimal and maximal limits.
4. Results
4.1. Effects of convection
The formation of the microstructure has been studied starting from rest until stationary state for two different thermal gradients, and pulling rates ranging from 0.25 to 30 µm/s. In all cases, the first stages of solidification have a very Fig. 2 Comparison of patterns grown in µg (a,b) and on
ground (c,d). The radial gradient of primary spacing observed on top-view images (a,c) are clearly evidenced by primary spacing maps (b,d). (V=4 µm/s, G=19 K/cm, Succinonitrile – 0.24wt% camphor) 8000 18000 28000 38000 48000 58000 68000 78000 µm² a) µg c) 1g b) µg d) 1g 1mm
Fig. 1 Schematic of the optical diagnostics of the DECLIC-DSI. In this scheme, the cartridge is reduced to the
Int. J. Microgravity Sci. Appl., 0 (0) (0) 1
DOI: Furnace He-Ne LASER CCD Camera (Axial) CCD Camera (Trans.) LEDs (Axial) LEDs (Trans.) Liquid Solid Interface
1–4
fast dynamics that corresponds to the development of cells and dendrites, leading to a stationary growth characterized by a stable spacing (after ~15 mm of growth) even if the patterns keep evolving in terms of order. Descriptions of microstructures, primary spacing evolutions and analyses of mechanisms of primary spacing adjustment can be found for example in 10). Same analyses have been conducted on experiments performed on ground after the return on Earth of the DECLIC-DSI.
Before entering into details, we should point out the most striking characteristic of the patterns grown in microgravity that fully justifies the need of such environment. In contradistinction with 3D ground patterns, the microgravity ones are very homogeneous as illustrated in Fig. 2. The ground pattern (Fig. 2c & d) is characterized by a very clear radial variation of size going from large cells in the center to small cells at the crucible border; this variation is due to convection that induces radial gradients in the microstructure control parameters along the interface 11). As expected, removing convection drastically reduces such heterogeneity as radial variation of size is no longer noticeable on the pattern grown in microgravity (Fig. 2a & b). In this last case, the width of the size histogram is then fully representative of the selection process.
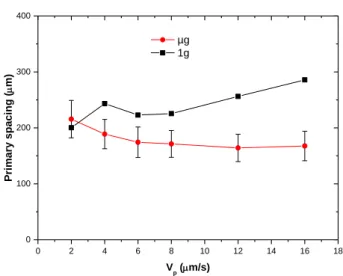
Comparative analyses of µg and ground experiments revealed major differences regarding the primary spacing evolution with pulling rate. An example for the thermal gradient of G=19 K/cm is given in Fig. 3. Spacings in microgravity are smaller than on ground and the difference increases with pulling rate. This is quite surprising as previous results on metallic systems repeatedly pointed out spacings in µg larger than on ground with a convergence when the pulling rate increases 12). The difference may come from a different origin and structure of convection. In our case, fluid flow is directly related to pulling rate as it originates in the latent heat generation. Due to the low thermal conductivity of the alloy compared to the crucible border, latent heat is mainly evacuated through the crucible wall, thus generating a radial thermal gradient at the interface. It triggers a toric fluid flow ascending in the center and descending on the border, of which velocity keeps increasing with pulling rate. In metallic system, the convection is usually inversed and is very weakly dependent on pulling velocity so that its effects become negligible when the pulling rate is high enough.
Another interesting effect of convection is evidenced by the analysis of interface recoils. During the first stage of directional
solidification, the interface moves in the thermal field due to a change of its temperature, which is itself associated to an evolution of the solute concentration in the liquid and in the solid so that the interface motion reflects the axial macrosegregation. The details of such analyses conducted for our experiments can be found in 13). A typical example of comparison of the interface motion obtained on Earth and onboard the ISS (µg environment) is given in Fig. 4. The fast motion observed at the beginning of the solidification is similar on ground and in µg but the interface decelerates earlier on Earth. Moreover, front recoils on ground are characterized by the absence of stabilization of the interface position, meaning that instead of reaching a plateau, the interface keeps moving downwards. Such profiles are consistent with analyses of segregation conducted by Favier 14, 15) on the basis of the concept of a diffusive boundary layer approximation introduced by Burton, Prim and Slichter 16). Depending on the strength of convection, various segregation profiles can be obtained: the purely diffusive mode is associated to a plateau of concentration and of position reached after the initial transient (µg data of Fig. 4), whereas a convecto-diffusive growth leads to characteristic S-shape macrosegregation profiles corresponding to the continuous decrease of the front position observed on ground.
Fig. 3 Stationary primary spacing as a function of pulling rate for µg and 1g conditions (G=19 K/cm, Succinonitrile – 0.24wt% camphor) 0 2 4 6 8 10 12 14 16 18 0 100 200 300 400 µg 1g Pri mary spacing ( m ) V p (m/s)
4.2 Oscillating patterns
Cellular or dendritic patterns may lose stability in domains of control parameters where other branches of non-planar microstructures are more stable, and thus form preferentially. The transition from regular cell/dendrite branch to such branches of solutions is called secondary instability. A diversity of secondary instabilities can be found in spatially modulated interface patterns 17) but numbers of them occurin a very narrow range of growth conditions so that their observation is not straightforward, especially if convection affects the concentration field close to the interface. Microgravity experiments enabled us to observe for the very first time an oscillatory instability of the cellular patterns in bulk samples, in a configuration of extended 2D grown patterns. The only previousexperimental characterization of the oscillating mode of cellular patterns was done for a 1D cellular pattern by Georgelin et al. 18) in thin samples of transparent alloys. In combination with the experiments, large-scale phase-field simulations performed produced breathing modes, of comparable characteristics in terms of period as well as in terms of spatio-temporal coherence. Our experimental and numerical results summarized below are detailed in 19, 20).
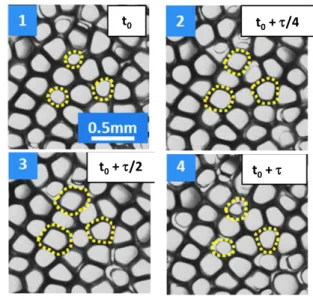
Our experiments revealed extended cellular patterns oscillating with periods of a few tens of minutes. On top-view images, oscillating cells are characterized by a periodic variation of their apparent area (bright area), that corresponds
Oscillation occurs for a very narrow range of parameters bounded in our case in the velocity range 2 < V/Vc < 6 (Vc :
critical velocity corresponding to the transition from planar to cellular growth). Numerical simulation revealed that for these experimental parameters, oscillatory behavior is linked to the selection of spacings close to the ends of stable spacing branches.
In both experiments and simulations, spatially extended patterns are basically hexagonal, with six neighbor cells, but the density of defects is very high thus leading to a highly disordered pattern. Analyses demonstrated a global lack of spatio-temporal correlation of oscillating patterns evidenced by the large dispersion of oscillation phases of cells. Thanks to numerical simulation, it was demonstrated that the lack of long range coherence of oscillation is directly related to this disorder. In small areas that present a local order, of hexagonal or square type, maintained for several periods, a synchronization of the oscillation of neighboring cells may occur. In case of hexagonal tiling, three sub-patterns appear oscillating with a phase shift of roughly 2/3 as illustrated in Fig. 6 both in experiments and numerical simulations. A similar situation is obtained in case of square organization albeit with two subpatterns in phase opposition. These kinds of synchronizations, typical from perfectly ordered patterns 21, 22), is always limited to very few cells in our experiments. Such a situation is in contradistinction with observations of oscillating patterns in thin samples previously reported in 18) characterized
Fig. 5 Oscillating patterns (V=1 µm/s, G=19 K/cm,
Succinonitrile – 0.24wt% camphor, µg): evolution
t0 t0+ /4 t0+ /2 t0+ t0 t0+ /4 t0+ /2 t0+ t0 t0+ /4 t0+ /2 t0+
Fig. 4 Motion of the interface during solidification: position = f(L) with L=Vxt, the pulling length. The position z=0 corresponds to the interface position at rest (located on the liquidus isotherm). (V=4 µm/s, G=19 K/cm, Succinonitrile – 0.24wt% camphor) -3000 -2500 -2000 -1500 -1000 -500 0 0 10 20 30 40 50 60 Fr on t rec oi l ( µm) L (mm) 1g µg
1–6
by long-range coherence, suggesting that the confinement imposes a higher order level that is then associated to a longer range of coherence of oscillation.
5
Conclusion
In this article, we presented some results obtained using the Directional Solidification Insert of the DECLIC facility, in microgravity onboard the International Space Station and on ground. Long solidifications have been performed to get the whole dynamics and mechanisms of microstructure formation and evolution, spacing adjustment, pattern ordering. The quality of the experimental system that provides very clear images of the interfacial microstructure during its whole evolution is demonstrated.
The influence of convection is evidenced by comparison of space and ground experiments. Microgravity environment provides the conditions to get quantitative benchmark data: homogeneous patterns corresponding to homogeneous values of control parameters along the whole interface were obtained; on Earth, convection induces radial gradient of microstructure due to the modification of the concentration field in front of the interface. It appears that the range of selected primary spacings also differs between diffusive and convective experiments, once more due to the perturbation of the solutal boundary layer induced by fluid flow. Effects of convection on axial macrosegregation are also evidenced by studies of the interface position in the thermal field.
The favorable conditions provided by microgravity allowed us to observe for the very first time the dynamics of extended oscillating cellular patterns. This oscillation mode, observed in a narrow range of growth parameters, is evidenced by a periodic variation of width of cells. Analyses revealed that due to the high intrinsic disorder of the pattern, all cells of the pattern display uncorrelated oscillations even if the oscillation period is remarkably homogeneous all along the array. However, in small areas that present a local order, of hexagonal or square type, maintained for several periods, a synchronization of the oscillation of neighboring cells may occur even if it remains limited to very few cells. An important point to notice is the difference of behavior that we observed in our extended 2D oscillating patterns, compared to previous observations in thin samples 18) that are characterized by long-range coherence, stressing the importance of dimensionality on pattern dynamics and, as a consequence, the importance of such microgravity experiments in bulk samples.
The analyses of DSI results are still going on but the future will also be marked by another campaign of microgravity experiments planned in 2017-2018. A higher concentrated alloy will be used to focus on the dendritic regime.
Acknowledgments
The authors express their gratitude to CNES (Centre National d’Etudes Spatiales) and NASA (National Aeronautics and Space Administration) for the support received in the scientific projects MISOL3D (Microstructures de SOLidification 3D) and Fig. 6 Short-range correlation of hexagonal pattern. Inside the hexagonal regions of a), three groups of cells oscillate coherently with a mutual phase difference of
2/3 as shown by the curves corresponding to the time variation of their apparent areas; all cells of the same group (same color) oscillate in phase. The phase-field simulation in b) reproduces this behavior. (V=1 µm/s, G=19 K/cm for experiments and 28K/cm for simulations, succinonitrile-0.24wt% camphor, µg)
DSIP (Dynamical Selection of Interface Patterns). A.K. and D.T. were supported by NASA awards NNX07AK69G and NNX11AC09G.
References
1) B. Billia and H.J. Fecht: A World without Gravity – Research in Space for Health and Industrial Processes, eds. B. Fitton and B. Battrick, ESA Publication Division, Netherlands, 2001.
2) B. Billia and R. Trivedi: Handbook of crystal growth, ed. D.T.J. Hurle, Vol 1B, 899, North-Holland, Bristol, UK, 1993.
3) H. Jamgotchian, N. Bergeon, D. Benielli, Ph. Voge, B. Billia and R. Guérin: Phys. Rev. Lett. , 87 (2001) 166105.
4) T. Schenk, H. Nguyen Thi, J. Gastaldi, G. Reinhart, V. Cristiglio, N. Mangelinck-Noël, H. Klein, J. Härtwig, B. Grushko, B. Billia and J. Baruchel: J. Cryst. Growth 275 (2005) 201.
5) R. Marcout, G. Raymond, B. Martin, G. Cambon, B. Zappoli, F. Duclos, S. Barde, D. Beysens, Y. Garrabos, C. Lecoutre, B. Billia, N. Bergeon and N. Mangelinck : 57th International Astronautical Congress, Valencia, Spain, October 2006, IAC-06-A2.5.02. 6) G. Pont, S. Barde, B. Zappoli, F. Duclos, Y. Garrabos, C. Lecoutre,
D. Beysens, B. Billia, N. Bergeon, N. Mangelinck-Noël, R. Marcout and D. Blonde: 60th International Astronautical Congress, Daejeon, Republic of Korea, October 2009, IAC-09.A2.6.4. 7) N. Bergeon, C. Weiss, N. Mangelinck-Noël and B. Billia: Trans.
Indian Inst. of Met., 62 (2009) 455.
8) C. Dussert, G. Rasigni, M. Rasigni, J. Palmari and A. Llebaria: Phys. Rev. B , 34 (1986) 3528.
9) N. Bergeon, A. Ramirez, L. Chen, B. Billia, J. Gu and R. Trivedi: J. Mater. Sci., 46 (2011) 6191.
10) N. Bergeon, F.L. Mota, L. Chen, D. Tourret, J.M. Debierre, R. Guérin, A. Karma, B. Billia and R. Trivedi: IOP Conference Series-Materials Science and Engineering , 84 (2015) 012077.
11) C. Weiss, N. Bergeon, N. Mangelinck-Noël and B. Billia: Phys. Rev. E , 79 (2009) 011605.
12) H. Nguyen Thi, Y. Dabo, B. Drevet, M.D. Dupouy, D. Camel, B. Billia, J.D. Hunt and A. Chilton: J. Crystal Growth, 281 (2005) 654.
13) F. L. Mota, N. Bergeon, D. Tourret, A. Karma, R. Trivedi and B. Billia: Acta Materialia, 85 (2015) 362.
14) J.J. Favier: Acta Metall., 29 (1981) 197. 15) J.J. Favier: Acta Metall., 29 (1981) 205.
16) J.A. Burton , R.C. Prim and W.P. Slichter: J. Chem. Phys., 21 (1953) 1987.
17) C. Misbah and A. Valance: Phys. Rev. E, 49 (1994) 166. 18) M. Georgelin and A. Pocheau: Phys. Rev. Lett., 79 (1997) 2698. 19) N. Bergeon, D. Tourret, L. Chen, J.M. Debierre, R. Guérin, A.
Ramirez, B. Billia, A. Karma and R. Trivedi: Phys. Rev. Lett., 110 (2013) 226102.
20) D. Tourret, J.M. Debierre, Y. Song, F.L. Mota, N. Bergeon, R. Guérin, R. Trivedi, B. Billia and A. Karma: Phys. Rev. E, 92 (2015) 042401.
21) K. Kassner, J.M. Debierre, B. Billia, N. Noël and H. Jamgotchian: Phys. Rev. E, 57 (1998) 2849.