Classification of ECG Signals Using
Wigner-Ville Distribution
M. Bachiri, F. Bereksi Reguig
[email protected] [email protected]
Biomedical Engineering Laboratory, Department of Electronics, Science Engineering Faculty, Abou Bekr Belkaïd University, B.P.230, Chetouane, Tlemcen, Algeria.
Abstract
The aim of this work is the study of the description of ECG signals by the Wigner-Ville Distribution (WVD) in order to classify related pathologies. The major problem of the WVD is the interferences (cross-terms). The Smoothed Pseudo-Wigner-Ville Distribution (SPWVD) makes it possible to reduce these interferences by a suitable choice of two windows H and G and their corresponding sizes Lg and Lh. We propose here a classification method based on the SPWVD and the nearest representative decision rule, the latter requires the choice of a distance and the definition of a representative for each training class. Two beat classes were considered: normal beats (NOR) and premature ventricular beats (PVC). By using the MIT-BIH data-base, the method was tested on a set composed of more than 80.000 beats. The best classification rate that we obtain is 90,66%, this one was carried out by using only the first most discriminant coefficient.
KEY WORDS - ECG Signal, Wigner-Ville distribution,
smoothed pseudo-Wigner-Ville distribution, Fisher contrast, Hilbert transform, distances, classification, nearest representative decision rule.
1. Introduction
Classification of electrocardiogram (ECG) is an important area in biomedical signal processing. Several algorithms have been developed for classification of ECG beats. These techniques use a variety of features to represent the ECG and a number of classification methods. Features include ECG morphology [1], [2], [3] heartbeat interval features [1], [2], [4], wavelet coefficients [5], [6], higher order cumulant features [7], and hermite polynomials [8]. Classifiers methods employed include linear discriminants [1], [6], [9], back propagation neural networks [6], [2], [7], self-organizing maps with learning vector quantization [11], and self-organizing networks [12].
A way to improve the classification performances consists in applying the decision rule to data whose representation space is characterised with a good discrimination between the signals of different classes. Aim of this work is the study of the classification performances of the ECG beats according to the discrimination which can be provided by the smoothed pseudo-Wigner-Ville distribution. The method used is based on the nearest representative
decision rule, the relevance of this one is firstly related on the choice of the distance used to measure the degree of resemblance between signals, and secondly to the definition adopted for the representative of each training class.
2. Electrocardiogram
An ECG is a recording of the activity of the heart, it is composed mainly of deflections set (Fig1): a P wave , a set of three waves Q, R, S called QRS complex, and a wave T. the P wave translates the atrial activity and, the QRS complex and the T wave translates the ventricular activity. The heart diseases are represented on the ECG by deflections whose morphology, amplitude or duration, are completely or partially abnormal.
Fig.1: A normal ECG beat
3. Wigner-Ville Distribution
3.1. Definition
For a finite energy signal, the Wigner-Ville distribution (WVD) [10] is defined as:
τ
τ
τ
ν
πντd
e
)
2
t
(
x
)
2
t
(
x
)
,
t
(
W
x * −i2 +∞ ∞ −∫
+
−
=
This distribution provides a time-frequency representation of the signal x with any restriction on the time and frequency resolutions, because the windowing will be made in an autonomous way with the signal itself [11]. An interpretation of this expression can be found in terms of probability density: expression (1) is the Fourier transform of an acceptable form of characteristic function for the distribution of the energy [10].
3.2. Interferences
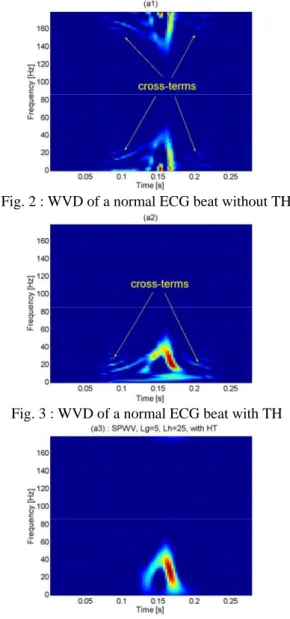
The major disadvantage of the DWV is the presence of interferences terms (or cross-terms) (see Fig.3 and Fig.4). As the WVD is a bilinear function of the signal x the quadratic superposition principle applies:
.
W
x+y=
W
x+
W
y+
2
Re(
W
x,y)
(2) where2
Re(
W
x,y)
is the cross-WVD of x and y.3.3. Interference reduction
The discrete version of the WVD may be affected by a spectral aliasing (Fig.2), in particular if the signal x is real-valued and sampled at the Nyquist rate. To resole this problem we can use the analytic signal. Indeed, as its bandwidth is half the one of the real signal the aliasing will not take place in the useful spectral domain of this signal. This solution presents another advantage: since the spectral domain is divided by two, the number of components in the time-frequency plane is also divided by two. Consequently, the number of interference terms decreases significantly (Fig. 3). We recall that the analytic signal is calculated by applying the Hilbert transform (HT) to the real signal.
To reduce the importance of the interferences terms remaining after the use of the Hilbert transform we carry out a double smoothing: of the WVD: in time and in frequency, the first is controlled by the window h; the second is controlled by the window g, we obtain the smoothed pseudo-Wigner-Ville distribution (DPWVL)
∫
−+∞∞∫
− +∞ ∞ − ⎥ ⎥ ⎦ ⎤ ⎢ ⎢ ⎣ ⎡ − + − = τ τ τ τ ν) h( ) g(s t)x(s 2).x (s 2)ds e πντd , t ( PWLx * i2 (3)
4. Classifier
In order to evaluate the relevance of such representation in ECG signals classification a method based on the nearest representative decision rule is implemented [13]. This rule requires the choice of a distance (D) and the definition of an element representing (prototype) for each training class. We concentrate on the classification of normal (NOR) and abnormal PVC beats.
To reduce the computing time a dimensionality reduction is strongly desirable, this one can be carried out by calculating the Fisher contrast of the time-frequency image provided by the WVD or SPWVD. In the case of two classes (NOR and PVC) the Fisher contrast is given by: 2 ) PVC ( ) , t ( 2 ) NOR ( ) , t ( 2 ) PVC ( ) , t ( ) NOR ( ) , t ( Fisher W W W W ) , t ( K ⎟ ⎟ ⎠ ⎞ ⎜ ⎜ ⎝ ⎛ + ⎟ ⎟ ⎠ ⎞ ⎜ ⎜ ⎝ ⎛ − = ν ν ν ν ν
(4)
With ) c ( ) , t (W
ν is the average of the normalised WVD oftraining signals of the class C and
) c ( ) , t (
W
ν its variance. In the case of several classes the reader can refer to [13].Fig. 2 : WVD of a normal ECG beat without TH
Fig. 3 : WVD of a normal ECG beat with TH
Fig. 4: SPWVD of a normal ECG beat with TH By calculating the Fisher contrast for all the coordinates we obtain a contrast map, the dimensionality reduction consists in building the classifier on the first most discriminant co-ordinates (of stronger contrasts) indicated by MDC (Most Discriminant Coordinates).
Each class (c) is represented by the MDC coefficients of the average of normalised WVD (or SPWVD) of corresponding signals, i.e,
W
((MDCc) ).
(orPWL
((cMDC) ) ). By using the nearest representative rule, an unknown signal x, is affected to the class of which the representative is nearest (within the meaning of the distance D).) W , W ( D min arg c c à affecté x ((MDCx) ) ((MDCc) ) PVC , NOR C 0 0 = = ⇔ (5)
where represents the MDC coefficients of the WVD normalized of beat x. The distances which were studied are: ) s ( ) MDC (
Γ
1) Quadratic distance.∑
− = k 2 y x y x,W ) (W (k) W (k)) W ( Q (6)2) Symmetrical relative entropy or (J-divergence)
∑
⎟⎟⎠ ⎞ ⎜ ⎜ ⎝ ⎛ + ⎟ ⎟ ⎠ ⎞ ⎜ ⎜ ⎝ ⎛ = k x y y y x x y , x ) k ( W ) k ( W log ) k ( W ) k ( W ) k ( W log ) k ( W ) W W ( J (7)For more details about the distances the reader can refer to [14]:
5. Data description
ECG signals used were randomly selected from the MIT-BIH Arrhythmia Database [15], which contains 48 recordings, each containing two 30-min ECG lead signals (denoted lead A and B) The data are bandpass filtered at 0.1–100 Hz and sampled at 360 Hz. There are over 109 000 labeled ventricular beats from 15 different heartbeat types. To implement our classification procedure we worked out three sets of signals (derivation A)
EA: Training set: formed starting from 31 recordings ETR: Reduced Test set: formed starting from 30 recordings.
ETE: Extended Test set, it gathers all the NOR and PVC beats of MIT-BIH database, excluded those which are used in EA (47 recordings were used).
Sets NOR PVC Total
EA 300 200 500
ETR 300 200 500
ETE 74708 6928 81636
Tab 1 : Sets of ECG signals extracted from MIT-BIH database
6. Preprocessing
This study did not investigate the problem of heartbeat detection from the ECG; instead we have utilized the heartbeat fiducial point times provided with the MIT-BIH arrhythmia database. Each beat ECG will be represented on a segment of 100 points, by taking the point corresponding to the peak R and 49 points and 50 points respectively on the left and on the right of R. then they are centered by removing the mean value.
7. Results
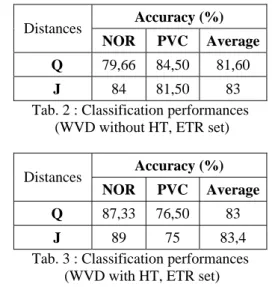
To study the influence of the interferences terms on the classification performances, these last were evaluated on ETR set by using the DWV with and without Hilbert transform. The results are presented in tables 2 and 3. The classification rates are calculated according to first MDC
coefficient, this choice will be justified later. These results showed that the use of the Hilbert transform gave a light improvement of the total classification rate (especially in the case of the quadratic distance). Moreover a relatively important change is marked in the classification rate of each class separately, which translates the influence of the Hilbert transform on the discrimination power of the time-frequency representation provided by WVD.
Accuracy (%)
Distances
NOR PVC Average Q 79,66 84,50 81,60
J 84 81,50 83
Tab. 2 : Classification performances (WVD without HT, ETR set)
Accuracy (%)
Distances
NOR PVC Average
Q 87,33 76,50 83
J 89 75 83,4
Tab. 3 : Classification performances (WVD with HT, ETR set)
DPWVL offers several choices of configuration, in this case the research of the optimal classification procedure passes by the determination of the five parameters (h, Lh, g, Lg, distance D) leading to best discrimination between the NOR and PVC classes. Tables 4 and 5 present the best classification performances obtained by examining 16 types of window for various combinations (Lh, Lg), the two windows h and g were taken of the same type. The experiments showed that the classification rate remains roughly unchanged whatever the number of MDC coefficient considered. Thus one can be satisfied by using the first coefficient to build the classifier.
Accuracy (%) Distances
NOR PVC Average Windows
Q 93,33 95 94 h : Dolph, Lh: 11 g : Dolph, Lg: 47
J 95,33 94 94,8 h : Parzen, Lh: 5 g : Parzen, Lg: 69 Tab. 4: Best performances
(SPWVD without HT, ETR set)
Accuracy (%) Distances
NOR PVC Average Windows
Q 98 82,33 91,8 h : Parzen, Lh: 7 g : Parzen, Lg: 83
J 98,33 82,5 92 h : Nutbess, Lh: 5 g : Nutbess, Lg: 65 Tab. 5: Best performances
The performances obtained by using the SPWVD (that it is with or without Hilbert transform) are definitely better than those obtained by the not smoothed WVD. This can lead us to believe that the suppression of the interferences terms always gives a better discrimination; indeed, this conclusion is not exact for two reasons:
1) The smoothing which gave a good discrimination did not give a good legibility; this situation is illustrated by the figure 5
2) The discrimination obtained by the DPWVL without transform of Hilbert is better with that obtained with transform of Hilbert although the latter makes it possible to reduce the number of the terms of interferences.
Fig. 5: SPWVD of a normal ECG beat (a): good legibility (b): good discrimination In our context, the suppression of the interferences terms is not an objective, because these interferences contain information which can be discriminating like the phase of the various components [16]. Thus one does not have to expect that the interferences disappear when the goal is discrimination. However in practice smoothing aiming at obtaining a good discrimination, generally leads to a partial or total suppression of the interferences terms, but that must be understood like a side effect of the adopted choice.
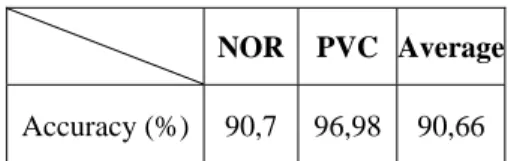
In order to evaluate the generalization capacity of our classifier, the best configuration thus obtained (SPWVD without HT, h (Parzen, 5) g (Parzen, 69), symmetrical relative entropy) is tested on ETE set (81636 ECG beat). The results are indicated in table 6; they show a light reduction in classification rate, which proves the good generalization of the classifier with respect to the statistics of the considered classes (NOR, PVC).
NOR PVC Average
Accuracy (%) 90,7 96,98 90,66 Tab 6: Results test on the ETE set
It is interesting in the question of our work to highlight a point related to the decision nature taken by the decision rules based on the distances and more particularly that which is used in this study: the nearest representative rule. In general, the value of distance measured between two signals does not reflect necessarily in all the cases the morphological resemblance degree between them. To clarify this idea we have to synthesize the example illustrated by the figure 6, if we calculate the quadratic distance between the signal to be classified and the two prototypes 1 and 2, it is found that the nearest representative rule assigns the signal to the class represented by prototype 1 while the morphology of the signal to be classified is closer with that to prototype 2. This false decision was also obtained for the symmetrical relative entropy.
Fig.6: Synthetic signals illustrating the limitation of the decision rule based on the distances: the signal morphology to be classified is nearer with the prototype2
but in term of distance becomes closer with the prototype1qui has a different morphology
8. Conclusion
In this work we studied a classification method based on the extraction of the relevant parameters of the smoothed pseudo-Wigner-Ville distribution in order to classify two types of ECG beats (Normal and PVC). The method allowed a strong dimensionality reduction of the problem while carrying out satisfactory performances. The experiments also showed the importance of the couple choice (representation, distance) to have good performances.
9. References
[1] P.de Chazal, R.B.Reilly, “Automatic classification of heartbeats using ECG morphology and heartbeat interval features”, IEEE Trans. Biomed. Eng., vol. 51, Jully. 2004.
[2] T.H.Yeap, F.Johnson, M.Rachniowski, “ECG beat classification by a neural network”, Proc. Annu. Int.
Conf. IEEE Engineering Medicine and Biology Soc, pp. 1457–1458, 1990.
[3] Y.H.Hu, W.J.Tompkins, J.L.Urrusti, V.X.Afonso, “Applications of artificial neural networks for ECG signal detection and classification”, J. Electrocardiol., vol. 26, pp. 66–73, 1993.
[4] Y.H.Hu, S.Palreddy, W.J.Tompkins, “A patient-adaptable ECG beat classifier using a mixture of experts approach”, IEEE Trans. Biomed. Eng, vol. 44, pp. 891– 900, Sept. 1997.
[5] G.Krishna Prasad, J.S.Sahambi, “Classification of ECG Arrhythmias using multi-resolution analysis and neural networks”, IEEE, 2003.
[6] T.Froese, “Classification of ECG signals using discrete wavelet transforms”, Rapport tech, University of reading, 2004.
[7] S.Osowski, T.L.Linh, “ECG beat recognition using fuzzy hybrid neural network”, IEEE Trans. Biomed. Eng., vol. 48, pp. 1265–1271, Nov. 2001.
[8] M.Lagerholm, C.Peterson, G.Braccini, L.Edenbrandt, L.Sornmo, “Clustering ECG complexes using hermite functions and self-organizing maps”, IEEE Trans. Biomed. Eng., vol. 47, pp. 838–848, July 2000.
[9] L.Senhadji, G.Carrault, J.J.Bellanger, G.Passariello, “Comparing wavelet transforms for recognizing cardiac patterns”, IEEE Eng. Med. Biol. Mag., vol. 14, pp. 167– 173, Mar.–Apr. 1995.
[10] F Auger, P. Flandrin, P. Gonçalvès, O. Lemoine. Time-Frequency toolbox for use with Matlab, Tutorial, GdR-PRC ISIS, 1996.
[11] J. Dumas, l’Analyse temps-fréquence, Polycopié, 01dB-STELL (Groupe MVI technologies), 2001.
[12] H. Reinhard, Eléments de mathématiques du signal (tome1 : signaux déterministes), Dunod, 1997.
[13] M. Davy, Noyaux optimisés pour la classification dans le plan temps-fréquence : Application au diagnostic d'enceintes acoustiques, Thèse de Doctorat, Université de Nantes, 2000.
[14] M. Basseville, Distance measures for signal processing and pattern recognition, Rapport de recherche, Institut National de Rrecherche en Informatique et en Automatique, Rennes, France, 1988.
[15] MIT BIH Arrhythmia Database Directory. Third edition, Harvard MIT Division of Health Sciences and technology, Biomed. Eng. Center. 1992.