HAL Id: hal-02907032
https://hal.archives-ouvertes.fr/hal-02907032
Submitted on 4 Nov 2020
HAL is a multi-disciplinary open access
archive for the deposit and dissemination of
sci-entific research documents, whether they are
pub-lished or not. The documents may come from
teaching and research institutions in France or
abroad, or from public or private research centers.
L’archive ouverte pluridisciplinaire HAL, est
destinée au dépôt et à la diffusion de documents
scientifiques de niveau recherche, publiés ou non,
émanant des établissements d’enseignement et de
recherche français ou étrangers, des laboratoires
publics ou privés.
Hydroxychloroquine use against SARS-CoV-2 infection
in non-human primates
Pauline Maisonnasse, Jérémie Guedj, Vanessa Contreras, Sylvie Behillil,
Caroline Solas, Romain Marlin, Thibaut Naninck, Andres Pizzorno, Julien
Lemaitre, Antonio Gonçalves, et al.
To cite this version:
Pauline Maisonnasse, Jérémie Guedj, Vanessa Contreras, Sylvie Behillil, Caroline Solas, et al..
Hydrox-ychloroquine use against SARS-CoV-2 infection in non-human primates. Nature, Nature Publishing
Group, 2020, 585 (7826), pp.584-587. �10.1038/s41586-020-2558-4�. �hal-02907032�
584 | Nature | Vol 585 | 24 September 2020
Hydroxychloroquine use against SARS-CoV-2
infection in non-human primates
Pauline Maisonnasse1,11, Jérémie Guedj2,11, Vanessa Contreras1,11, Sylvie Behillil3,4,11, Caroline Solas5,11, Romain Marlin1,11, Thibaut Naninck1, Andres Pizzorno6, Julien Lemaitre1, Antonio Gonçalves2, Nidhal Kahlaoui1, Olivier Terrier6, Raphael Ho Tsong Fang1, Vincent Enouf3,4,7, Nathalie Dereuddre-Bosquet1, Angela Brisebarre3,4, Franck Touret8, Catherine Chapon1, Bruno Hoen9, Bruno Lina6,10, Manuel Rosa Calatrava6,
Sylvie van der Werf3,4, Xavier de Lamballerie8 & Roger Le Grand1 ✉
Coronavirus disease 2019 (COVID-19) has rapidly become a global pandemic and no antiviral drug or vaccine is yet available for the treatment of this disease1–3.
Several clinical studies are ongoing to evaluate the efficacy of repurposed drugs that have demonstrated antiviral efficacy in vitro. Among these candidates,
hydroxychloroquine (HCQ) has been given to thousands of individuals infected with severe acute respiratory syndrome coronavirus 2 (SARS-CoV-2)—the virus that causes COVID-19—worldwide but there is no definitive evidence that HCQ is effective for treating COVID-194–7. Here we evaluated the antiviral activity of HCQ both in vitro
and in SARS-CoV-2-infected macaques. HCQ showed antiviral activity in African green monkey kidney cells (Vero E6) but not in a model of reconstituted human airway epithelium. In macaques, we tested different treatment strategies in comparison to a placebo treatment, before and after peak viral load, alone or in combination with azithromycin (AZTH). Neither HCQ nor the combination of HCQ and AZTH showed a significant effect on viral load in any of the analysed tissues. When the drug was used as a pre-exposure prophylaxis treatment, HCQ did not confer protection against infection with SARS-CoV-2. Our findings do not support the use of HCQ, either alone or in combination with AZTH, as an antiviral drug for the treatment of COVID-19 in humans.
Infection with SARS-CoV-2 is characterized by initial mild disease asso-ciated with respiratory symptoms at the peak of viral replication1,8. In some patients, a late severe immunological syndrome occurs 6–14 days after the onset of symptoms that may require intensive care and is responsible for most of the fatalities1–3.
HCQ has well-documented in vitro activity against various viruses4 and has emerged as an active compound against SARS-CoV-2 in differ-ent screening programmes, including a library of 1,520 Food and Drug Administration (FDA)-approved compounds5. In Vero E6 cells, HCQ has a 50% maximal effective concentration (EC50)5,9,10 that varies between 0.7 and 4 μM. It may inhibit viral transport in endosomes by alkalinizing the intra-organelle compartment10,11 and affect glycosylation, as reported for other viruses12. The drug may also act as an immunomodulatory agent13,14. In patients with lupus, HCQ decreases the level of inflammatory cytokines11,15,16, which may be relevant for the treatment of COVID-192. Furthermore, it has been proposed that AZTH, which displays in vitro
antiviral activity against SARS-COV-25,17, could potentiate the efficacy of HCQ6. On the basis of these properties, HCQ has been considered for the treatment of COVID-19, alone or in combination with AZTH6,7.
We and others have set up non-human primate (NHP) models of SARS-CoV-2 infection18–20. Here we used cynomolgus macaques (Macaca
fascicularis) to test different treatment strategies with HCQ, alone or
in combination with AZTH, before or after the peak of viral replication. We also tested HCQ administration as pre-exposure prophylaxis treat-ment against SARS-CoV-2 infection.
In vitro efficacy of HCQ against SARS-CoV-2 infection
We first evaluated the in vitro antiviral activity of HCQ against a SARS-CoV-2 strain isolated from one of the first patients with COVID-19 in France. Post-infection treatment of Vero E6 cells with HCQ resulted in a dose-dependent antiviral effect, with 50% inhibitory concentration https://doi.org/10.1038/s41586-020-2558-4
Received: 30 April 2020 Accepted: 10 July 2020 Published online: 22 July 2020
Check for updates
1Center for Immunology of Viral, Auto-immune, Hematological and Bacterial diseases (IMVA-HB/IDMIT), Université Paris-Saclay, Inserm, CEA, Fontenay-aux-Roses, France. 2Université de Paris, IAME, Inserm, Paris, France. 3Unité de Génétique Moléculaire des Virus à ARN, GMVR, Institut Pasteur, UMR CNRS 3569, Université de Paris, Paris, France. 4Centre National de Référence des Virus des infections respiratoires (dont la grippe), Institut Pasteur, Paris, France. 5Laboratoire de Pharmacocinétique et Toxicologie, Aix-Marseille Université, APHM, Unité des Virus Emergents (UVE) IRD 190, INSERM 1207, Hôpital La Timone, Marseille, France. 6CIRI, Centre International de Recherche en Infectiologie, (Team VirPath), Université de Lyon, Inserm, U1111, Université Claude Bernard Lyon 1, CNRS, UMR5308, ENS de Lyon, Lyon, France. 7Plate-forme de microbiologie mutualisée (P2M), Pasteur International Bioresources Network (PIBnet), Institut Pasteur, Paris, France. 8Unité des Virus Emergents (UVE), Aix-Marseille Université, IRD 190, INSERM 1207, IHU Méditerranée Infection, Marseille, France. 9Emerging Diseases Epidemiology Unit, Institut Pasteur, Paris, France. 10Laboratoire de Virologie, Centre National de Référence des Virus des infections respiratoires (dont la grippe), Institut des Agents Infectieux, Groupement Hospitalier Nord, Hospices Civils de Lyon, Lyon, France. 11These authors contributed equally: Pauline Maisonnasse, Jérémie Guedj, Vanessa Contreras, Sylvie Behillil, Caroline Solas, Romain Marlin. ✉e-mail: [email protected]
Nature | Vol 585 | 24 September 2020 | 585 (IC50) values of 2.2 μM (0.7 μg ml−1) and 4.4 μM (1.4 μg ml−1) at 48 and
72 h after infection, respectively, which is within the range of previously reported values21 (Extended Data Fig. 1a). We next studied infection in a model of reconstituted human airway epithelium (MucilAir, Epithelix) developed from primary nasal or bronchial cells differentiated and cultured in an air–liquid interphase22. In contrast to previous observa-tions for remdesivir23, the antiviral activity of HCQ in Vero E6 cells did not translate to the human airway epithelium model; doses of 1 μM or 10 μM HCQ did not significantly reduce SARS-CoV-2 apical viral titres at 48 h after infection (Extended Data Fig. 1b). HCQ also did not protect the integrity of epithelial tissue during infection, as the trans-epithelial elec-trical resistance values were comparable with the values of untreated cells and significantly lower than those of the mock-infected controls.
Infection of macaques with SARS-CoV-2
Cynomolgus macaques were infected on day 0 with a total dose of 106 plaque-forming units (PFU) of a primary SARS-CoV-2 isolate (BetaCoV/ France/IDF/0372/2020; passaged twice in Vero E6 cells) by combined intra-nasal and intratracheal routes. Control NHPs (n = 8) had high viral loads in nasopharyngeal and tracheal samples (swabs), as estimated by quantitative PCR with reverse transcription (RT–qPCR), as early as 1 day after infection (d.p.i.). In tracheal samples, the viral load peaked at 2 d.p.i. (Fig. 1b and Extended Data Fig. 2a), with a median peak value of 7.9 log10 copies per ml. After 2 d.p.i., the viral loads progressively decreased and most NHPs had undetectable viral loads by 10 d.p.i. Similar profiles were observed for nasopharyngeal shedding (Extended Data Fig. 2b), whereas low viral loads were detected for more than 3 weeks in rectal samples and bronchoalveo-lar lavages (Extended Data Fig. 2c, d). NHPs exhibited mild clinical signs, including coughing or sneezing without dyspnoea, as has been reported for most patients with COVID-19 during the early infection period. The NHPs also developed early lymphocytopenia at 2 d.p.i. (Extended Data Fig. 5). No major changes were observed in heart rate, respiratory rate and oximetry analyses. Typical focal ground glass opacities associated with pleural thickening24,25 were observed in computed tomography (CT) scans with variable degrees of severity (Fig. 2 and Extended Data Fig. 3). Lesions were detectable as early as 2 d.p.i. and persisted up to 13 d.p.i. in some NHPs. None of the control NHPs developed a severe disease similar to what is observed in the late stages of the severe forms of the disease in humans.
Treatment with HCQ
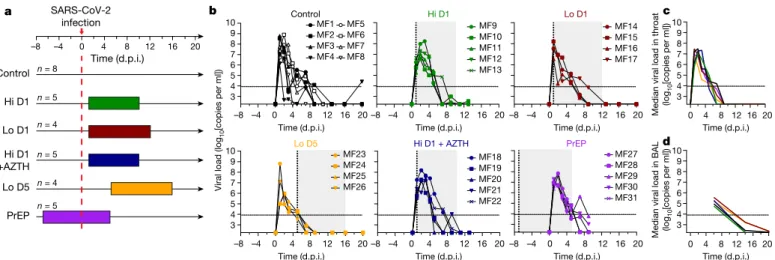
To assess the anti-viral efficacy of HCQ, macaques received HCQ daily by gavage for 10 or more days. A treatment regimen of 90 mg kg−1 on 1 d.p.i. (loading dose) followed by a daily maintenance dose of 45 mg kg−1 was found to generate a clinically relevant plasma drug exposure in a group of uninfected NHPs (Extended Data Fig. 4b). In parallel, we also tested a lower treatment regimen, with a loading dose of 30 mg kg−1 and a maintenance dose of 15 mg kg−1. Overall, 9 NHPs were infected on day 0 and treated using the high treatment regimen (Hi D1, n = 5) or the low treatment regimen (Lo D1, n = 4), both starting at 1 d.p.i. We also exam-ined the effect of a late low-dose treatment starting at 5 d.p.i.—when viral RNA levels are 3–4 log lower compared with peak values—to evaluate the benefit of HCQ in accelerating the clearance of the virus (Lo D5, n = 4). We focused on RT–qPCR analyses to assess the in vivo antiviral efficacy of HCQ because it provides a quantitative analysis, has a higher sensitivity and is less prone to variability than culture-based assays. In addition, RT–qPCR analysis is the only method that enables a comparison with results reported in human patients. Furthermore, virus titration in cul-ture assays can be affected by many factors in addition to the number of viral particles, including any residual HCQ in the samples and host factors such as cytokines. All treated NHPs had tracheal viral RNA load kinetics that were similar to those of untreated NHPs, with median peak viral loads of 7.1 and 7.5 log10 copies per ml for the Hi D1 and Lo D1 groups, respectively, compared with 7.9 log10 copies per ml in the control group. Similarly, the areas under the curve (AUCs) of the viral load were similar between all groups, with values of 36.9 and 39.7 log10 copies × day per ml, for the Hi D1 and Lo D1 groups, respectively, compared with 40.3 log10 copies × day per ml in control NHPs (P = 0.62 and P = 0.37, respectively). Similar results were obtained for the nasopharyngeal swabs, and there were no differences in the levels of viral replication in bronchoalveolar lavages (Fig. 1d and Extended Data Fig. 2). In NHPs treated from 1 d.p.i. or 5 d.p.i., HCQ did not accelerate the time to viral clearance, and the median times to the first unquantifiable viral load were 4.5, 7.0, 7.0 and 7.0 days in the control, Lo D1, Hi D1 and Lo D5 groups, respectively.
Next, we evaluated the combination therapy of HCQ and AZTH, which was administered from 1 d.p.i., in which HCQ was given as a high dose as described above, and AZTH was given at a loading dose of 36 mg kg−1 followed by a daily dose of 18 mg kg−1 to mimic human Control Hi D1 Lo D1 Lo D5 Hi D1 +AZTH –8 –4 0 4 8 12 16 20 PrEP SARS-CoV-2 infection n = 8 n = 5 n = 4 n = 5 n = 4 n = 5 3 4 5 6 7 8 9 10 ControlMF1 MF2 MF3 MF4 MF5 MF6 MF7 MF8 Hi D1 MF9 MF10 MF11 MF12 MF13 Lo D1 MF14 MF15 MF16 MF17 Time (d.p.i.) Time (d.p.i.)
Viral load (log
10 [copies per ml]) MF23 MF24 MF25 MF26 –8 –4 0 4 8 12 16 20 3 4 5 6 7 8 9 10 Lo D5 Hi D1 + AZTH MF18 MF19 MF20 MF21 MF22 –8 –4 0 4 8 12 16 20 PrEP MF27 MF28 MF29 MF30 MF31 –8 –4 0 4 8 12 16 20 a b d 3 4 5 6 7 8 9 10 c 3 4 5 6 7 8 9 10 16 12 0 4 8 20 Time (d.p.i.) Time (d.p.i.) Time (d.p.i.) Time (d.p.i.) Time (d.p.i.) Time (d.p.i.) Time (d.p.i.)
–8 –4 0 4 8 12 16 20–8 –4 0 4 8 12 16 20–8 –4 0 4 8 12 16 20 Median viral load in throat 0 4 8 1216 20
(log
10
[copies per ml])
Median viral load in BAL (log
10
[copies per ml])
Fig. 1 | Study design and viral loads in the respiratory tract of SARS-CoV-2-infected cynomolgus macaques treated with HCQ and AZTH. a, Study
design. The red dotted line indicates infection with 106 PFU of SARS-CoV-2 by
the combined intranasal and intratracheal routes. Coloured areas indicate HCQ treatment periods. Each group received either a high (Hi) or a low (Lo) dose of HCQ according to the regimens described in the Methods. The treatment started 1 d.p.i. (D1) or 5 d.p.i. (D5), or 7 days before viral challenge for the pre-exposure prophylaxis (PrEP) group. One group received AZTH in
combination with a high dose of HCQ. The control group received vehicle (water) as placebo. b–d, Viral loads were analysed by PCR in throat swabs (b, c)
and bronchoalveolar lavages (BAL) (d). The limit of detection was estimated to
be 2.3 log10 copies of SARS-CoV-2 RNA per ml and the limit of quantification was
estimated to be 3.9 log10 copies per ml (dotted horizontal line). b, Shaded zones
indicate treatment periods and each symbol and line combination represents one NHP. Dotted vertical lines indicate day of treatment initiation. c, d, Data are
586 | Nature | Vol 585 | 24 September 2020
exposure (Hi D1 + AZTH, n = 5). No effects of treatment were observed on either the viral RNA load in the different analysed tissues (Fig. 1d and Extended Data Fig. 2) or clinical scores. Clinical signs were com-parable to control NHPs, with some NHPs exhibiting high CT scores in the Hi D1 + AZTH group (Fig. 2). In parallel, we also treated NHPs with a high dose of HCQ, starting 7 days before viral challenge as pre-exposure prophylaxis treatment (n = 5). Again, the kinetics of viral RNA loads were similar to those of the control group and no differences in the reduction in the AUC, peak viral load or time to first unquantifiable viral load were observed (Fig. 1 and Extended Data Fig. 2).
Relation between HCQ concentration and virus kinetics
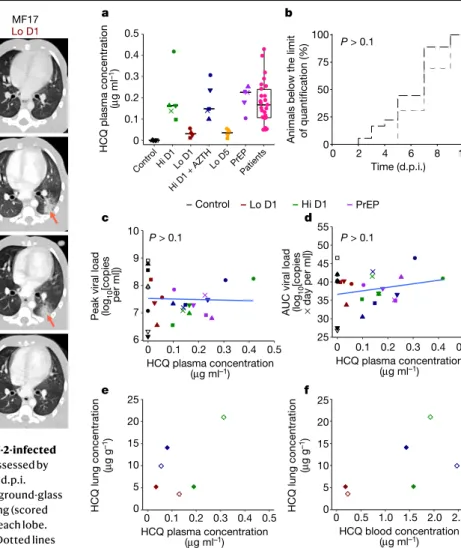
In the NHPs of Hi D1, Hi D1 + AZTH and pre-exposure prophylaxis groups, the plasma exposures were comparable to those observed in routine clinical practice 3–5 days after HCQ initiation using a dose of 200 mg three times daily (Fig. 3a). Drug trough concentrations were lower in both the Lo D1 and Lo D5 groups. When we assessed whether the higher drug exposure could generate more-rapid virus clearance, neither the time to attain the viral load limit of quantification nor the peak viral load were significantly associated with plasma HCQ concentrations (Fig. 3b–d). Finally, in an additional group of uninfected macaques, we characterized the HCQ pharmacokinetics in blood and plasma as the accumulation of HCQ in the lungs 6 days after the initiation of treatment
(Fig. 3e, f and Extended Data Fig. 4). The blood concentrations in the high-dose HCQ group were higher than 1.4 μg ml−1, showing that the drug concentrations in the blood remained above the drug EC50 values that we identified in Vero E6 cells during in vitro efficacy assessment of HCQ against SARS-CoV-2 infection. The mean blood-to-plasma ratio was 6.8 (Extended Data Fig. 4), close to the value of 7.2, which was reported in healthy volunteers during various treatment intervals and durations26. Consistent with predictions made in physiological pharmacokinetic models, these levels of drug exposure in the plasma and blood produced higher exposure concentrations in lung tissues, with a lung-to-plasma ratio ranging from 27 to 177 (Fig. 3f), allowing lung tissues to achieve concentrations that were mostly above the drug EC50 values found in Vero E6 cells in all NHPs during the treatment period.
a Control Hi D1 Lo D1 Hi D1 + AZT H PrEP Lo D5 MF1 MF25 MF24 MF23 MF22 MF31 MF30 MF29 MF28 MF27 MF21 MF20 MF19 MF18 MF17 MF16 MF15 MF14 MF13 MF12 MF11 MF10 MF8 MF9 MF7 MF6 MF5 MF4 MF3 MF2 MF26 Time (d.p.i.) 0 2 5 11/13 4 8 10 0 2 6 b Baseline Day 2 Day 5 Day 13 MF17 Lo D1 MF2 Control 3 5 0 0 0 0 8 6
Fig. 2 | Time course of lung lesions by CT analysis of SARS-CoV-2-infected cynomolgus macaques treated with HCQ. Lung lesions were assessed by
chest CT before infection with SARS-CoV-2 and at 2, 5 and 11 or 13 d.p.i.
a, Heat map of the overall CT score. Scores include lesion types (ground-glass
opacity, crazy-paving pattern, consolidation or pleural thickening (scored from 0 to 3)) and lesion volume (scored from 0 to 4) summed for each lobe. Scores are consensus values from two independent evaluators. Dotted lines indicate treatment initiation. ‘X’ corresponds to missing data, macaques were not scanned at these time points. b, Representative images of lung lesions in
two NHPs at baseline, 2, 5 and 13 d.p.i. Red arrows indicate typical lesions. Numbers at the bottom left of each image represent the CT score associated with the NHP and time point. Scores are the average over all scans made for the macaque at that time point.
Lo D1 Hi D1 Contro l Hi D1 + AZTH PrEP Lo D5 Patients HCQ plasma concentratio n (μ g ml –1) 0 0.1 0.2 0.3 0.4 0.5 Time (d.p.i.) 0 2 4 6 8 10
Animals below the limit of quantification (% )100 75 50 25 0 10 9 8 7 6 0 0.1 0.2 0.3 0.4 0.5 HCQ plasma concentration (μg ml–1)
Peak viral load (log
10 [copie s per ml] ) 0 0.1 0.2 0.3 0.4 0.5 HCQ plasma concentration (μg ml–1)
AUC viral load (log
10 [copie s × day per ml] ) 25 30 35 40 45 50 55 25 20 15 10 5 0 0 0.1 0.2 0.3 0.4 0.5 HCQ plasma concentration (μg ml–1) HCQ lung concentratio n (μ g g –1) 0 0.5 1.0 1.5 2.0 2.5 HCQ blood concentration (μg ml–1) 25 20 15 10 5 0 HCQ lung concentratio n (μ g g –1) b a d c f e P > 0.1 P > 0.1 P > 0.1 Control Lo D1 Hi D1 PrEP
Fig. 3 | Pharmacokinetic and viral kinetic parameters in cynomolgus macaques. a, Individual mean plasma trough concentrations of HCQ in NHPs
during treatment. HCQ plasma trough concentrations determined within the context of routine therapeutic drug monitoring using the same method are provided for hospitalized patients (n = 25) who received 200 mg three times daily. The box bounds represent the 25th and 75th percentiles, the middle line shows the mean, and whiskers show the minimum and maximum values.
b, Time to the first measurement below the limit of quantification in NHPs with
a mean plasma trough concentration <0.1 μg ml−1 (black) or >0.1 μg ml−1 (grey).
The time to viral suppression was compared between the two groups using a log-rank test (n = 31 macaques in total). c, Peak viral load according to mean
HCQ plasma trough concentration. d, Area under the curve (AUC) or viral
kinetic curve between 1 and 9 d.p.i. c, d, A Spearman correlation test was
performed to assess the association between drug concentration and viral kinetic parameters (n = 31 macaques in total). e, HCQ lung and plasma
concentrations in uninfected NHPs (n = 6). f, HCQ lung and blood
Nature | Vol 585 | 24 September 2020 | 587
Pathogenesis and host response to HCQ treatment
High alanine aminotransferase and creatinine kinase levels were observed in NHPs treated with the high HCQ and particularly the HCQ + AZTH regi-men compared with control NHPs (Extended Data Figs. 7, 8).
HCQ treatment did not prevent lymphocytopenia (Extended Data Fig. 5) nor pulmonary lesions, as shown by CT scan analysis (Fig. 2 and Extended Data Fig. 3). Similar lesion scores were observed in control and treated NHPs.
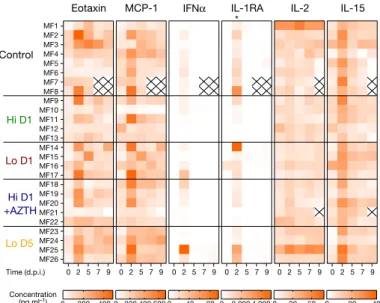
All NHPs exhibited an increase in the concentrations of type-I IFNα, IL-1RA, CCL2 and CCL11 in plasma at 2 d.p.i. (Fig. 4 and Extended Data Fig. 6). In addition, IL-15 peaked early during infection, which suggests that innate lymphoid cells have a role in the control of initial viral rep-lication in both drug-treated and untreated NHPs. When compared with control NHPs, TNF was significantly increased and IL-1RA was significantly reduced at 2 d.p.i. (Fig. 4 and Extended Data Fig. 6) in the groups that received the high dose of HCQ alone (P = 0.032 and
P = 0.028, respectively) or with AZTH (P = 0.037 and P = 0.045,
respec-tively).
Conclusions
Our study shows that cynomolgus macaques are a relevant model for the analysis of the early stages of SARS-Cov-2 infection in hum
ans1,3,18–20,27,28. We found no antiviral activity nor clinical efficacy of HCQ
treatment, regardless of the timing of treatment initiation, either before infection, early after infection (before the peak of the viral load) or late after infection (after the peak of the viral load). This was in spite of high HCQ concentrations in the blood and lungs, and plasma exposures that were similar to those observed in patients with COVID-19 treated who were with HCQ. Thus, treatment with HCQ is unlikely to have antiviral activity in respiratory compartments. Our results illustrate the frequent discrepancy between results from in vitro assays and in vivo experi-ments, as reported for other viral infections such as influenza, dengue or chikungunya virus, for which clinical trials did not demonstrate efficacy of chloroquine or HCQ for the treatment of these infections4,29.
In conclusion, our evaluation of HCQ in the NHP model does not sup-port its use as an antiviral agent for the treatment of COVID-19 in humans.
Online content
Any methods, additional references, Nature Research reporting sum-maries, source data, extended data, supplementary information, acknowledgements, peer review information; details of author con-tributions and competing interests; and statements of data and code availability are available at https://doi.org/10.1038/s41586-020-2558-4.
1. He, X. et al. Temporal dynamics in viral shedding and transmissibility of COVID-19. Nat. Med. 26, 672–675 (2020).
2. Huang, C. et al. Clinical features of patients infected with 2019 novel coronavirus in Wuhan, China. Lancet 395, 497–506 (2020).
3. Chen, G. et al. Clinical and immunological features of severe and moderate coronavirus disease 2019. J. Clin. Invest. 130, 2620–2629 (2020).
4. Touret, F. & de Lamballerie, X. Of chloroquine and COVID-19. Antiviral Res. 177, 104762 (2020).
5. Touret, F. et al. In vitro screening of a FDA approved chemical library reveals potential inhibitors of SARS-CoV-2 replication. Sci. Rep. 10, 13093 (2020).
6. Gautret, P. et al. Clinical and microbiological effect of a combination of
hydroxychloroquine and azithromycin in 80 COVID-19 patients with at least a six-day follow up: a pilot observational study. Travel Med. Infect. Dis. 34, 101663 (2020). 7. Magagnoli, J. et al. Outcomes of hydroxychloroquine usage in United States veterans
hospitalized with Covid-19. Med 1, 1–14 (2020).
8. Li, Q. et al. Early transmission dynamics in Wuhan, China, of novel coronavirus-infected pneumonia. N. Engl. J. Med. 382, 1199–1207 (2020).
9. Wang, M. et al. Remdesivir and chloroquine effectively inhibit the recently emerged novel coronavirus (2019-nCoV) in vitro. Cell Res. 30, 269–271 (2020).
10. Liu, J. et al. Hydroxychloroquine, a less toxic derivative of chloroquine, is effective in inhibiting SARS-CoV-2 infection in vitro. Cell Discov. 6, 16 (2020).
11. Ponticelli, C. & Moroni, G. Hydroxychloroquine in systemic lupus erythematosus (SLE). Expert Opin. Drug Saf. 16, 411–419 (2017).
12. Savarino, A., Di Trani, L., Donatelli, I., Cauda, R. & Cassone, A. New insights into the antiviral effects of chloroquine. Lancet Infect. Dis. 6, 67–69 (2006).
13. Rainsford, K. D., Parke, A. L., Clifford-Rashotte, M. & Kean, W. F. Therapy and pharmacological properties of hydroxychloroquine and chloroquine in treatment of systemic lupus erythematosus, rheumatoid arthritis and related diseases. Inflammopharmacology 23, 231–269 (2015).
14. Schrezenmeier, E. & Dörner, T. Mechanisms of action of hydroxychloroquine and chloroquine: implications for rheumatology. Nat. Rev. Rheumatol. 16, 155–166 (2020). 15. Monzavi, S. M. et al. Efficacy analysis of hydroxychloroquine therapy in systemic lupus
erythematosus: a study on disease activity and immunological biomarkers. Inflammopharmacology 26, 1175–1182 (2018).
16. Fanouriakis, A. et al. 2019 Update of the Joint European League Against Rheumatism and European Renal Association-European Dialysis and Transplant Association (EULAR/ ERA-EDTA) recommendations for the management of lupus nephritis. Ann. Rheum. Dis.
79, 713–723 (2020).
17. Zhang, B. et al. Macrolide derivatives reduce proinflammatory macrophage activation and macrophage-mediated neurotoxicity. CNS Neurosci. Ther. 25, 591–600 (2019). 18. Rockx, B. et al. Comparative pathogenesis of COVID-19, MERS, and SARS in a nonhuman
primate model. Science 368, 1012–1015 (2020).
19. Williamson, B. N. et al. Clinical benefit of remdesivir in rhesus macaques infected with SARS-CoV-2. Nature https://doi.org/10.1038/s41586-020-2423-5 (2020).
20. Shi, R. et al. A human neutralizing antibody targets the receptor-binding site of SARS-CoV-2. Nature 584, 120–124 (2020).
21. Yao, X. et al. In vitro antiviral activity and projection of optimized dosing design of hydroxychloroquine for the treatment of severe acute respiratory syndrome coronavirus 2 (SARS-CoV-2). Clin. Infect. Dis. 71, 732–739 (2020).
22. Nicolas de Lamballerie, C. et al. Characterization of cellular transcriptomic signatures induced by different respiratory viruses in human reconstituted airway epithelia. Sci. Rep.
9, 11493 (2019).
23. Pizzorno, A. et al. Characterization and treatment of SARS-CoV-2 in nasal and bronchial human airway epithelia. Cell. Rep. Med 1, 100059 (2020).
24. Pan, F. et al. Time course of lung changes at chest CT during recovery from coronavirus disease 2019 (COVID-19). Radiology 295, 715–721 (2020).
25. Shi, H. et al. Radiological findings from 81 patients with COVID-19 pneumonia in Wuhan, China: a descriptive study. Lancet Infect. Dis. 20, 425–434 (2020).
26. Tett, S. E., Cutler, D. J., Day, R. O. & Brown, K. F. A dose-ranging study of the pharmacokinetics of hydroxy-chloroquine following intravenous administration to healthy volunteers. Br. J. Clin. Pharmacol. 26, 303–313 (1988).
27. Liu, Y. et al. Viral dynamics in mild and severe cases of COVID-19. Lancet Infect. Dis. 20, 656–657 (2020).
28. Chen, N. et al. Epidemiological and clinical characteristics of 99 cases of 2019 novel coronavirus pneumonia in Wuhan, China: a descriptive study. Lancet 395, 507–513 (2020). 29. Roques, P. et al. Paradoxical effect of chloroquine treatment in enhancing chikungunya
virus infection. Viruses 10, 268 (2018).
Publisher’s note Springer Nature remains neutral with regard to jurisdictional claims in
published maps and institutional affiliations.
© The Author(s), under exclusive licence to Springer Nature Limited 2020
Eotaxin MCP-1 IFNα IL-1RA IL-2 IL-15
MF1 MF22 MF26 MF25 MF24 MF23 MF21 MF20 MF19 MF18 MF17 MF16 MF15 MF14 MF13 MF12 MF11 MF10 MF8 MF9 MF7 MF6 MF5 MF4 MF3 MF2 0 2 5 7 9 0 200 400 0 200 400 600 0 40 80 0 2,000 4,000 0 30 60 0 20 40 Time (d.p.i.) Concentration (pg ml–1) * Control Hi D1 Lo D1 Hi D1 +AZTH Lo D5 0 2 5 7 9 0 2 5 7 9 0 2 5 7 9 0 2 5 7 9 0 2 5 7 9
Fig. 4 | Cytokines and chemokines in the plasma of SARS-CoV-2-infected cynomolgus macaques treated with HCQ. a, Heat map of plasma
concentrations of eotaxin (also known as CCL-11), MCP-1 (also known as CCL-2), IFNα, IL-1RA, IL-2 and IL-15 at 0, 2, 5, 7 and 9 d.p.i. The asterisk indicates a significant difference in IL-1RA concentrations at 2 d.p.i. between the control group and the Hi D1 and Hi D1 + AZTH groups (P = 0.0287 and P = 0.0451, respectively). Further analyses of IL-1RA are shown in Extended Data Fig. 6c. Statistical significance was determined using a two-sided Mann–Whitney U-test without correction for multiple testing.
Methods
Ethics and biosafety statement
Cynomolgus macaques (M. fascicularis), aged 37–40 months and origi-nating from Mauritian AAALAC-certified breeding centres, were used in this study. All macaques were housed in IDMIT infrastructure facilities (CEA, Fontenay-aux-Roses), under BSL-2 and BSL-3 containment when necessary (animal facility authorization D92-032-02, Prefecture des Hauts de Seine, France) and in compliance with European Directive 2010/63/EU, the French regulations and the Standards for Human Care and Use of Laboratory Animals of the Office for Laboratory Animal Welfare (OLAW, assurance number A5826-01, United States). The pro-tocols were approved by the institutional ethical committee ‘Comité d’Ethique en Expérimentation Animale du Commissariat à l’Energie Atomique et aux Energies Alternatives’ (CEtEA 44) under statement number A20-011. The study was authorized by the ‘Research, Innovation and Education Ministry’ under registration number APAFIS#24434-2020030216532863v1.
HCQ and AZTH
Hydroxychloroquine sulfate (HCQ) was manufactured for Sanofi by the Chinoin Pharmaceutical and Chemical Works under good manu-facturing practice conditions and provided as the base powder. Batch number DU017 was solubilized extemporaneously in water at 5, 10 or 15 mg ml−1 depending on the group and the dose. Tablets of AZTH (250 mg) (Sandoz, batch number KH5525) were crushed and suspended extemporaneously at 12 mg ml−1 of AZTH in water.
Macaques and study design
To evaluate the efficacy of HCQ and HCQ + AZTH treatments, the macaques were randomly assigned in sex-balanced experimental groups. No statistical methods were used to predetermine sample size. Challenged macaques were exposed to a total dose of 106 PFU of SARS-CoV-2 through a combination of intranasal and intratracheal routes (day 0), using atropine (0.04 mg kg−1) as premedication and ketamine (5 mg kg−1) with medetomidine (0.042 mg kg−1) as anaes-thesia. The regimen comprising a high dose of HCQ in group ‘Hi D1’ (n = 5) consisted of a loading dose of 90 mg kg−1 at 1 d.p.i. and a daily maintenance dose of 45 mg kg−1, for a total of 10 days. The ‘Hi D1 + AZTH’ regimen (n = 5) consisted of the same HCQ regimen as for the Hi D1 group combined with one loading dose of 36 mg kg−1 of AZTH at 1 d.p.i., followed by a daily maintenance dose of 18 mg kg−1 AZTH for 10 days. The low-dose (Lo) regimen consisted of a HCQ loading dose of 30 mg kg−1 and a daily maintenance dose of 15 mg kg−1 for 12 days. The low-dose treatment of the ‘Lo D1’ group (n = 4) was initiated at 1 d.p.i. and the low-dose treatment of the ‘Lo D5’ group (n = 4) was initiated at 5 d.p.i. The PrEP regimen (n = 5) consisted of a loading dose of 30 mg kg−1 HCQ 7 days before challenge, followed by a daily dose of 15 mg kg−1 for 4 days and 45 mg kg−1 for 3 days before virus challenge and then 45 mg kg−1 until 6 d.p.i. Treatments were delivered by gavage. Placebo-treated macaques received water, which was the vehicle for HCQ. Macaques were observed daily and clinical examinations were performed at baseline, daily for one week and then twice weekly on macaques that were anaesthetized using ketamine (5 mg kg−1) and metedomidine (0.042 mg kg−1). Body weight, rectal temperature, res-piration, heart rates and oxygen saturation were recorded and blood, as well as nasopharyngeal, tracheal and rectal swabs, were collected. Bronchoalveolar lavages were performed using 50 ml sterile saline on 6, 14, 21 and 28 d.p.i. Chest CT scans were performed at baseline and on 2, 5 and 11 or 13 d.p.i. in macaques that were anaesthetized using tiletamine (4 mg kg−1) and zolazepam (4 mg kg−1). Blood cell counts, haemoglobin and haematocrit were determined from EDTA-treated blood samples using a HMX A/L analyser (Beckman Coulter). Biochem-istry parameters including alanine aminotransferase (ALT), aspartate aminotransferase (AST), albumin, haptoglobin, creatinine, creatine
kinase, lactate dehydrogenase (LDH) and total protein, were analysed with standard kits (Siemens) and C-reactive protein with a canine kit (Randox) in lithium heparin plasma, inactivated with Triton X-100, using an ADVIA1800 analyser (Siemens).
The pharmacokinetics of HCQ was assessed using the same admin-istration procedure in six uninfected macaques, randomly assigned as pairs into three experimental groups as described in Extended Data Fig. 4. The pharmacokinetic low (PK Lo) group received a low loading dose (30 mg kg−1) at day 0 and a low daily maintenance dose (15 mg kg−1) for 5 days. The pharmacokinetic high (PK Hi) and ‘PK Hi + AZTH’ groups received a high loading HCQ dose (90 mg kg−1) on day 0 and a high daily maintenance dose (45 mg kg−1) for 6 days, without or with AZTH (loading dose of 36 mg kg−1 and maintenance of 18 mg kg−1), respectively. Blood samples were taken at 0, 2, 4 and 6 h after treatment on day 0, and before treatment on the following days. For the PK Hi and PK Hi + AZTH groups, blood samples were also collected at 0, 2, 4 and 6 h after treatment after treatment on day 5. Macaques were humanly euthanized 24 h after the administration of the last dose using 18.2 mg kg−1 of pentobarbital sodium intravenously under tiletamine (4 mg kg−1) and zolazepam (4 mg kg−1) anaesthesia. Samples of lung were collected at necropsy for HCQ quantification.
Determination of HCQ concentrations
Quantification of HCQ in plasma, blood and lung tissues was performed by a sensitive and selective validated high-performance liquid chroma-tography coupled with tandem mass spectrometry method (Quattro Premier XE LC-MS/MS, Waters) as previously described30, with lower limits of quantification of 0.015 μg ml−1 for plasma and 0.05 μg ml−1 for blood and lung tissue. Blood samples were centrifuged within 1 h to collect plasma samples. Lung biopsies collected after euthanasia were thoroughly rinsed with cold 0.9% NaCl to remove blood contamination and blotted with filter paper. Then, each lung biopsy was weighed and homogenized with 1 ml of 0.9% NaCl using a Mixer mill MM200 (Retsch). Cellular debris was removed by centrifugation, and the supernatant was stored at −80 °C.
HCQ was extracted by a simple protein precipitation method, using methanol for plasma and ice-cold acetonitrile for blood and tissue homogenates. In brief, 100 μl of sample matrix was spiked with 10 μl of internal standard working solution (HCQ-d5, Alsachim), vortexed for 2 min followed by centrifugation for 10 min at 4 °C. The supernatant was evaporated for blood- and tissue-homogenate samples. Dry resi-dues or plasma supernatants were then transferred to 96-well plates and 5 μl was injected. To assess the selectivity and specificity of the method and matrix effect, blank plasma, blood and tissues from con-trol macaques were processed and compared with that of HCQ and index-selectivity-spiked plasma, blood or tissue homogenate sam-ples. Furthermore, each baseline sample (H0) of treated macaques was processed in duplicate, including one spiked with HCQ prepared equivalent to quality control samples.
Concentrations in blood (μg ml−1), plasma (μg ml−1) and lung (μg g−1) were determined for each uninfected macaque and in plasma only for infected macaques. Drug accumulation in the lung was assessed by calculating a lung-to-blood and a lung-to-plasma concentration ratio. No signs of haemolysis were observed, either visually (when only plasma samples were available) or after verification of the consistency between the two matrixes (when both plasma and blood samples were available).
HCQ plasma trough concentrations determined within the context of routine therapeutic drug monitoring using the same method, 3–5 days after initiation of HCQ at 200 mg three times daily were provided for comparison.
Viruses and cells
For the in vivo studies, SARS-CoV-2 virus (hCoV-19/France/ lDF0372/2020 strain) was isolated by the National Reference Center
for Respiratory Viruses (Institut Pasteur) as previously described31. Virus stocks used in vivo were produced by two passages on mycoplasma-free Vero E6 cells in Dulbecco’s modified Eagle’s medium (DMEM) without FBS, supplemented with 1% penicillin (10,000 U ml−1) and streptomycin (10,000 μg ml−1) and 1 μg ml−1 TPCK-trypsin at 37 °C in a humidified CO2 incubator and titrated on Vero E6 cells.
For the in vitro studies, the viral strain hCoV-19/France/IDF0571/2020 was provided by X. Lescure and Y. Yazdanpanah from the Bichat Hos-pital, where the isolate was obtained from a patient returning from Jichang (China) and passaged three times. For the virus used in the in vivo experiments, whole-genome sequencing was performed as pre-viously described31 with no modifications observed compared with the initial specimen27. For sequencing of the virus used in vitro, viral RNA extraction was done using the QiAmp viral RNA Kit (Qiagen). The complete viral genome sequence was obtained using Illumina MiSeq sequencing technology. Sequences were deposited after assembly on the GISAID EpiCoV platform under accession numbers EPI_ISL_406596 for hCoV-19/France/lDF0372/2020 and EPI_ISL_411218 for hCoV-19/ France/IDF0571/2020.
Viral replication kinetics and antiviral treatment in Vero E6 cells
Vero E6 cells were seeded 24 h in advance in multi-well 6 plates, washed twice with PBS and then infected with SARS-CoV-2 at the indicated multiplicities of infection (MOI). For HCQ treatment, the inoculum of infected Vero E6 cells was removed 1 h after infection (h.p.i.) and cells were immediately treated with solutions in DMEM of HCQ. Superna-tants were collected at 48 and 72 h.p.i. and stored at −80 °C for RNA extraction and viral quantification.
Viral quantification in Vero E6 cells
Viral stocks and collected samples were titrated by tissue-culture infectious dose 50% (TCID50 ml−1) in Vero E6 cells, using the Reed and Muench statistical method. Relative quantification of the viral genome was performed by one-step real-time quantitative reverse transcriptase and polymerase chain reaction (RT–qPCR) from viral RNA extracted using the QiAmp viral RNA Kit (Qiagen) in the case of supernatants or apical washings. Primer and probe sequences were selected from those designed by the School of Public Health/Univer-sity of Hong Kong (L. Poon, D. Chu and M. Peiris) and synthetized by Eurogentec23. Real-time one-step RT–qPCR was performed using the EXPRESS One-Step Superscript qRT–PCR Kit (Invitrogen, 1178101K). Thermal cycling was performed in a StepOnePlus Real-Time PCR System (Applied Biosystems) in MicroAmp Fast Optical 96-well reaction plates (Applied Biosystems, 4346907), as previously described23.
Viral infection and treatment in reconstituted human airway epithelia
MucilAir human airway epithelia (HAE) reconstituted from human primary cells obtained from nasal (pool of donors) or bronchial (sin-gle donors) biopsies were provided by Epithelix and maintained in air–liquid interphase with specific culture medium in Costar Transwell inserts (Corning) according to the manufacturer’s instructions. For infection experiments, apical poles were gently washed twice with warm OptiMEM medium (Gibco, ThermoFisher Scientific) and then infected directly with a 150-μl dilution of virus in OptiMEM medium, at a MOI of 0.1. For mock infection, the same procedure was performed using OptiMEM as inoculum. Samples collected from apical washes or basolateral medium at different time points were separated into two tubes: one for TCID50 viral titration and one RT–qPCR. HAE cells were collected in RLT buffer (Qiagen) and total RNA was extracted using the RNeasy Mini Kit (Qiagen) for subsequent RT–qPCR and Nanostring assays. Treatments with HCQ were applied through basolateral poles. All treatments were initiated on day 0 (1 h after viral infection) and
continued once daily. Samples were collected at 48 h.p.i. Variations in trans-epithelial electrical resistance (ΔTEER) were measured using a dedicated volt–ohm meter (EVOM2, Epithelial Volt/Ohm Meter for TEER) and expressed as Ω cm−2.
Virus quantification in NHP samples
Upper respiratory (nasopharyngeal and tracheal) and rectal speci-mens were collected with swabs (Universal transport medium, Copan; or Viral Transport Medium, CDC, DSR-052-01). Tracheal swabs were performed by insertion of the swab above the tip of the epiglottis into the upper trachea at approximately 1.5 cm of the epiglottis. All specimens were stored between 2 °C and 8 °C until analysis with a plasmid standard concentration range containing an rdrp gene frag-ment including the RdRp-IP4 RT–PCR target sequence. The protocol describing the procedure for the detection of SARS-CoV-2 is avail-able on the WHO website (https://www.who.int/docs/default-source/ coronaviruse/real-time-rt-pcr-assays-for-the-detection-of-sars-cov -2-institut-pasteur-paris.pdf?sfvrsn=3662fcb6_2).
Plasma cytokine analysis
Cytokines were quantified in EDTA-treated plasma using NHP Procar-taPlex immunoassay (ThermoFisher Scientific) for IFNα, IL-1RA, IL-1β, CCL-2 (also known as MCP-1), CCL-11 (also known as eotaxin), CXCL-11 (also known as ITAC), CXCL-1 (also known as BLC), granzyme B and PDGF-BB, using NHP Milliplex (Millipore) for CD40L, G-CSF, GM-CSF, IFNγ, IL-2, IL-4, IL-5, IL-6, CXCL-8 (also known as IL-8), IL-10, IL-13, IL-15, IL-17A, CCL-3 (also known as MIP-1α), CCL-4 (also known as MIP-1β), TNF, VEGF and a Bioplex 200 analyser (Bio-Rad) according to manu-facturer’s instructions.
Chest CT and image analysis
Acquisition was done using a CT system (Vereos-Ingenuity, Philips) in BSL-3 containment facilities on anaesthetized macaques placed in a supine position and monitored for heart rate, oxygen saturation and body temperature. An intravenous bolus of iodine contrast agent (Vizi-paque, 320mg ml−1, GE Heathcare, 3 ml kg−1) was injected (Medrad CT Stellant injector, Bayer) in the saphenous vein 20 s before the initiation of CT scan acquisition. The CT detector collimation was 64 × 0.6 mm, the tube voltage was 120 kV and intensity of about 120 mA. Automatic dose optimization tools (Dose Right, Z-DOM, 3D-DOM; Philips Health-care) regulated the intensity. CT images were reconstructed with a slice thickness of 1.25 mm and an interval of 0.25 mm.
Images were analysed using INTELLISPACE PORTAL 8 software (Philips healthcare). All images had the same window level of −300 and window width of 1,600. Lesions were defined as ground glass opacitiy, crazy-paving pattern, consolidation or pleural thickening as previously described24,25. Lesions and scoring were assessed independently in each lung lobe by two individuals, and the final results were made by consensus. The overall CT score includes lesion type (scored from 0 to 3) and lesion volume (scored from 0 to 4) summed for each lobe as described in Extended Data Fig. 3.
Statistical analysis
The following viral kinetic parameters were calculated in each experi-mental group as medians (and minimum–maximum): viral load peak, area under the curve of the log10 viral load, time to first unquantifiable viral load. Each viral kinetic parameter was compared with untreated macaques using Wilcoxon rank-sum or log-rank tests (Microsoft Excel 2016, GraphPad Prism version 7). To evaluate a potential effect of drug exposure on viral dynamics, we further evaluated the correlation of the viral kinetic parameters with the plasma concentrations of HCQ, taking the mean trough concentrations observed in each infected macaque between 1 and up to 15 days after treatment as a marker of drug expo-sure during treatment period (Spearman test, without adjusting for multiple testing).
Ethics committee
All information on the ethics committee is available at https://cache. media.enseignementsup-recherche.gouv.fr/file/utilisation_des_ani-maux_fins_scientifiques/22/1/comiteethiqueea17_juin2013_257221.pdf.
Reporting summary
Further information on research design is available in the Nature Research Reporting Summary linked to this paper.
Data availability
The data that support the findings of this study are included in the paper and Supplementary Information.
30. Chhonker, Y. S., Sleightholm, R. L., Li, J., Oupický, D. & Murry, D. J. Simultaneous quantitation of hydroxychloroquine and its metabolites in mouse blood and tissues using LC-ESI-MS/MS: an application for pharmacokinetic studies. J. Chromatogr. B Analyt. Technol. Biomed. Life Sci. 1072, 320–327 (2018).
31. Lescure, F. X. et al. Clinical and virological data of the first cases of COVID-19 in Europe: a case series. Lancet Infect. Dis. 20, 697–706 (2020).
Acknowledgements We thank B. Delache, E. Burban, J. Demilly, N. Dhooge, S. Langlois, P. Le
Calvez, M. Potier, F. Relouzat, J. M. Robert and C. Dodan for help with animal studies; B. Fert and C. Mayet for help with in vivo imaging studies; Q. Pascal for performing the necropsies; J. Morin for help with the cytokine measurements and preparation of reagents; K. Barthelemy, M. Basso, N. Doudka and M. Giocanti for help with HCQ concentration measurements; B. Lacarelle and R. Guilhaumou for help with analysing internal drug concentration data; J. Bertrand for help with analysing pharmacokinetic data; D. Desjardins for help with the AZTH pharmacokinetic study; C. Aubenque, M. Barendji, L. Bossevot, N. Dimant, J. Dinh, A. S. Gallouet, M. Leonec, I. Mangeot and K. Storck for help with sample processing; M. Albert, M. Barbet and F. Donati for help with the production, titration and sequencing of the virus stocks used in vivo and processing of samples for RT–PCR; A. S. Gallouet, S. Keyser, E. Marcos-Lopez, B. Targat and B. Vaslin for help with the experimental studies in the context of COVID-19-induced constraints; F. Ducancel and Y. Gorin for help with the logistics and safety management; E. Sultan for providing guidance on HCQ dose selection and discussion on pharmacokinetics/pharmacodynamics results and commenting on the paper; Sanofi for providing the HCQ batch used in these experiments; the Fondation Bettencourt Schueller and the Region Ile-de-France for the contribution to the implementation of imaging facilities; and the Domaine d’Intérêt Majeur (DIM) ‘One Health’ for its support. This study received financial support from REACTing, the National Research Agency (ANR; AM-CoV-Path) and the European
Union’s Horizon 2020 (H2020) research and innovation program Fight-nCov (101003555), European Union IMI2 program CARE (101005077) and the European Infrastructure TRANSVAC2 (730964). The virus stock was obtained through the EVAg platform (https://www.
european-virus-archive.com/), funded by H2020 (653316). The Infectious Disease Models and Innovative Therapies (IDMIT) research infrastructure is supported by the ‘Programme Investissements d’Avenir’, managed by the ANR under reference ANR-11-INBS-0008.
Author contributions A.B. performed RT–PCR viral quantification and analysed the data. A.G.
contributed to statistical analysis. A.P. performed in vitro evaluation of HCQ (Vero E6 and HAE), and contributed to data analysis and the preparation of the manuscript. B.H. contributed to study design, data analysis and the writing of the paper. B.L. coordinated the in vitro evaluation of HCQ (Vero E6 and HAE), analysed the data and contributed to the writing of the paper. C.C. coordinated the imaging facility. J.G. contributed to data analysis, the pharmacokinetics/ pharmacodynamics study and the writing of the paper. J.L. contributed to clinical follow-up of macaques, data analysis and the writing of the paper. M.R.C. designed the in vitro evaluation of HCQ (Vero E6 and HAE), supervised and coordinated the work, analysed the data and contributed to the writing of the paper. N.D.-B. contributed to the animal work and cytokine measurements, analysed the data and coordinated IDMIT core activities. N.E. developed the RT–qPCR assay and analysed the data. N.K. performed CT scans and acquisition parameter design, and contributed to data analysis. O.T. performed in vitro evaluation of HCQ (Vero E6 and HAE), contributed to data analysis and manuscript preparation. P.M. contributed to project conception and design of the study, contributed to animal work, the coordination of the experiments, data analysis and the writing of the paper. R.H.T.F. coordinated the animal core facility, and contributed to study design and data analysis. R.L.G. conceived the project, designed the study, coordinated the work, analysed the data and wrote the article. R.M. contributed to the design of the study, animal work, data analysis and contributed the writing of the paper. S.B. performed RT–qPCR viral quantification and analysed the data. C.S. supervised and coordinated the HCQ pharmacokinetics analysis, provided clinical data on plasma HCQ levels and contributed to the writing of the paper. F.T. contributed to in vitro antiviral evaluation. S.v.d.W. conceived the project, designed the study, provided the viral challenge stock, coordinated the viral load quantification, analysed the data and wrote the paper. T.N. performed CT scans and quantification, contributed to the quantification design, generated CT figures and wrote the paper. V.C. contributed to data analysis, statistical analyses, figures design and the writing of the paper. V.E. developed the RT–qPCR viral quantification assay. X.d.L. contributed to study design, pharmacokinetics/ pharmacodynamics analysis and the writing of the paper.
Competing interests J.G. has worked as consultant for Roche. Additional information
Supplementary information is available for this paper at
https://doi.org/10.1038/s41586-020-2558-4.
Correspondence and requests for materials should be addressed to R.L.G.
Peer review information Nature thanks Robin Ferner and Debby van Riel for their contribution
to the peer review of this work.
100 150
50
0
Relative viral production
0.1 1 10 HCQ concentration (µM) MOI 0.01 - 48 hpi 100 150 50 0
Relative viral production
0.1 1 10 HCQ concentration (µM) MOI 0.01 - 72 hpi HCQ SI MOI 0.01 48 hpi 2.189 215 98.218 MOI 0.01 72 hpi 4.394 161 36.640 IC50 (µM) CC50 (µM)
Treatment post-infection viral productionApical Relative (logInfectious titer
10 TCID50/mL) Nasal Epithelium MOI 0.1 48hpi Untreated 1 +/- 0.53 6.8 HCQ - 1 µM 1.92 +/- 0.46 7.3 HCQ - 10 µM 1.70 +/- 0.03 6.97 Bronchial Epithelium MOI 0.1 48hpi Untreated 1 +/- 0.09 7.63 HCQ - 1 µM 1.90 +/- 0.11 7.3 HCQ - 10 µM 1.77 +/-0.85 7.63 a b Nasal Bronchial 2 3 1 0
Apical relative viral production
400 600 200 0 TEER (Ohmms/cm 2) MOCK - Untr eated Infec ted - U ntrea ted Infec ted - H CQ 1µ M Infec ted - H CQ 10 µM
Extended Data Fig. 1 | In vitro evaluation of the antiviral activity of HCQ against SARS-CoV-2. a, Dose–response curves of HCQ at 48 and 72 h.p.i. in
Vero E6 cells. Vero E6 cells were seeded 24 h in advance in multi-well six-well plates, washed twice with PBS and then infected with SARS-CoV-2 (BetaCoV/ France/IDF0571/2020 SARS-CoV-2 strain) at the indicated MOI. The inoculum of infected Vero E6 cells was removed 1 h.p.i. and cells were immediately treated with different concentrations of HCQ. Supernatants were collected at 48 and 72 h.p.i. and stored at −80 °C for RNA extraction and viral titration by RT–qPCR. Results were expressed in relative viral production compared with the untreated control. The table summarizes the IC50, cytotoxic concentration
50% (CC50) and selectivity index (SI) for each condition. b, Apical relative viral
production and trans-epithelial resistance (TEER in Ohms cm−2) between the
apical and basal poles in nasal and bronchial HAE at 48 h.p.i. MucilAir HAE
reconstituted from human primary cells obtained from nasal or bronchial biopsies were provided by Epithelix and maintained in air–liquid interphase. For infection experiments, apical poles were gently washed twice with warm OptiMEM medium (Gibco, ThermoFisher Scientific) and then infected directly with nasal swab samples or a 150-μl dilution of virus in OptiMEM medium, at a MOI of 0.1. For mock infection, the same procedure was performed using OptiMEM as inoculum. Samples collected from apical washes were separated into two tubes: one for TCID50 viral titration and one for RT–qPCR. Results are
expressed in relative viral production compared with the infected untreated control. The table summarizes the relative viral production values (mean ± s.d.) and the infectious titres (log10[TCID50 ml−1) of three biological replicates tested
-8 -4 0 4 8 12162024 28 3 4 5 6 7 8 9 10 3 4 5 6 7 8 9 10 -8 -4 0 4 8 12162024 28 3 4 5 6 7 8 9 10 -8 -4 0 4 8 12162024 28 3 4 5 6 7 8 9 10 -8 -4 0 4 8 12162024 28 3 4 5 6 7 8 9 10 -8 -4 0 4 8 12162024 28 3 4 5 6 7 8 9 10 -8 -4 0 4 8 12162024 28 3 4 5 6 7 8 9 10 -8 -4 0 4 8 12162024 28 3 4 5 6 7 8 9 10 -8 -4 0 4 8 12162024 28 3 4 5 6 7 8 9 10 -8 -4 0 4 8 12162024 28 3 4 5 6 7 8 9 10 -8 -4 0 4 8 12162024 28 3 4 5 6 7 8 9 10 -8 -4 0 4 8 12162024 28 3 4 5 6 7 8 9 10 -8 -4 0 4 8 12162024 28 3 4 5 6 7 8 9 10 -8 -4 0 4 8 12162024 28 3 4 5 6 7 8 9 10 -8 -4 0 4 8 12162024 28 3 4 5 6 7 8 9 10 -8 -4 0 4 8 12162024 28 3 4 5 6 7 8 9 10 -8 -4 0 4 8 12162024 28 3 4 5 6 7 8 9 10 -8 -4 0 4 8 12162024 28 3 4 5 6 7 8 9 10 -8 -4 0 4 8 12162024 28 3 4 5 6 7 8 9 10 -8 -4 0 4 8 12162024 28 3 4 5 6 7 8 9 10 -8 -4 0 4 8 12162024 28 3 4 5 6 7 8 9 10 -8 -4 0 4 8 12162024 28 3 4 5 6 7 8 9 10 -8 -4 0 4 8 12162024 28 3 4 5 6 7 8 9 10 -8 -4 0 4 8 12162024 28
Tracheal Nasopharyngeal Rectal BAL
CTRL Hi D1 Lo D1 Hi D1 + AZTH Lo D5 PrEP MF1 MF2 MF3 MF4 MF5 MF6 MF7 MF8 MF9 MF10 MF11 MF12 MF13 MF14 MF15 MF16 MF17 MF18 MF19 MF20 MF21 MF22 MF23 MF24 MF25 MF26 MF27 MF28 MF29 MF30 MF31
Days post infection
Vira ll oa d( Lo g10 copies / mL ) a b c d 3 4 5 6 7 8 9 10 -8 -4 0 4 8 12162024 28
Extended Data Fig. 2 | Viral loads of SARS-CoV-2-infected cynomolgus macaques treated with HCQ. a–d, Viral loads measured by RT–qPCR in throat
swabs (a), nasal swabs (b), rectal swabs (c) and bronchoalveolar lavages (d). The
limit of detection was estimated at 2.3 log10 copies of SARS-CoV-2 RNA per ml
and the limit of quantification was estimated at 3.9 log10 copies per ml (dotted
horizontal line). Shaded zones indicate treatment periods. Baseline was adjusted to day 0 on the graphs. CTRL, control; D1, treatment started on day 1; D5, treatment started on day 5; Hi, high HCQ dose; Lo, low HCQ dose; PrEP, pre-exposure prophylaxis.
ND
ND
ND
Baseline Day 2 Day 5 Day 11/13
MF 3M F1 MF 2 MF 5 MF 6 MF 4 MF 7 MF 8 CTRL
Baseline Day 2 Day 5 Day 11/13
MF 9 MF10 MF12 MF11 MF13 Hi D1 MF14 MF15 MF16 MF17
Baseline Day 2 Day 5 Day 11/13
Lo D1
Baseline Day 2 Day 5 Day 11/13
MF18 MF19 MF20 MF21 MF22 Hi D1 + AZTH MF23 MF24 MF25 MF26
Baseline Day 2 Day 5 Day 11/13
Lo D5 MF2 7 MF2 8 MF2 9 MF3 0 MF3 1 PrEP
Baseline Day 2 Day 5
a b c d e f g h
Lesion type Score
None 0
GGO 1
Pleural thickenning 1 Crazy-paving pattern 3 Consolidation 3
Operator Date Time point Animal Localisation GGO thickenningPleural Crazy-pavingpattern ConsolidationextensionLesion effusionPleural Total score Cranial right lobe
Middle right lobe Caudal right lobe Cranial left lobe culmen Cranial left lobe
lingula Caudal left lobe Accessory lobe Pleural space Total
Lesion extension Score
None 0
< 25% of the lobe 1 25 < x < 50% of the lobe 2 50 < x < 75% of the lobe 3 75 < x < 100% of the lobe 4
Pleural effusion Score None 0 Slight 1 Mild 2 Severe 3
Extended Data Fig. 3 | Representative transversal slices of lung CT scans from SARS-CoV-2-infected cynomolgus macaques treated with HCQ.
Imaging was performed at baseline and day 2, 5 and 11 or 13 post-exposure to SARS-CoV-2. a–f, Images are presented for each macaque according to their
group, with a window level of −300 and a window width of 1,600. g, h, CT
scoring scales (g) and example of the analysis worksheet (h). Total CT score is
the sum of all lung lobe scores including lesion type, extension contributions and pleural effusion severity. ND, not determined.
a 0 1 2 3 4 5 6 PK Lo (n=2) PK Hi (n=2) PK Hi + AZTH (n=2) 0 24 48 72 96 120 144 0 24 48 72 96 120 144 0.001 0.01 0.1 1 10 0.001 0.01 0.1 1 10 0.001 0.01 0.1 1 10 0.001 0.01 0.1 1 10 0 24 48 72 96 120 144 0.001 0.01 0.1 1 10 0 24 48 72 96 120 144 0.001 0.01 0.1 1 10 0 24 48 72 96 120 144 0 24 48 72 96 120 144
Time since treatment initiation (hours)
Plasma Total blood
HCQ plasma conc. (µg/mL) b c 0.0 1.5 3.0 4.5 6.0 7.5 9.0 HCQ blood conc. (µg/mL ) R=0.84, p < 0.001 0.0 0.5 1.0 1.5 2.0 2.5 3.0 HCQ plasma conc. (µg/mL)
Extended Data Fig. 4 | Plasma and blood HCQ concentrations of six uninfected NHPs. a, Pharmacokinetic (PK) study design. Three groups of two
cynomolgus macaques received either a high (Hi) dose regimen of HCQ composed of a loading dose of 90 mg kg−1 and a daily maintenance dose of
45 mg kg−1 or a low (Lo) dose regimen composed of a 30 mg kg−1 loading dose
and a daily maintenance dose of 15 mg kg−1. One group received AZTH in
combination with HCQ with a loading dose of 36 mg kg−1 followed by an
18 mg kg−1 daily maintenance dose. b, Individual plasma and blood HCQ
concentrations (conc.) up to 5–6 days after the initiation of treatment.
CTRL Hi D1 Lo D1 Hi D1 + AZTH Lo D5 PrEP MF1 MF2 MF3 MF4 MF5 MF6 MF7 MF8 MF9 MF10 MF11 MF12 MF13 MF14 MF15 MF16 MF17 MF18 MF19 MF20 MF21 MF22 MF23 MF24 MF25 MF26 MF27 MF28 MF29 MF30 MF31
WBC Lymphocytes Neutrophils Monocytes
0 5 15 20 10 -8 -4 0 4 8 12162024 28 0 5 15 20 10 -8 -4 0 4 8 12162024 28 0 5 15 20 10 -8 -4 0 4 8 12162024 28 0 5 15 20 10 -8 -4 0 4 8 12162024 28 0 5 15 20 10 -8 -4 0 4 8 12162024 28 0 5 15 20 10 -8 -4 0 4 8 12162024 28 0 10 5 -8 -4 0 4 8 12162024 28 0 10 5 -8 -4 0 4 8 12162024 28 0 10 5 -8 -4 0 4 8 12162024 28 0 10 5 -8 -4 0 4 8 12162024 28 0 10 5 -8 -4 0 4 8 12162024 28 0 10 5 -8 -4 0 4 8 12162024 28 0 5 15 10 -8 -4 0 4 8 12162024 28 0 5 15 10 -8 -4 0 4 8 12162024 28 0 5 15 10 -8 -4 0 4 8 12162024 28 0 5 15 10 -8 -4 0 4 8 12162024 28 0 5 15 10 -8 -4 0 4 8 12162024 28 0 5 15 10 -8 -4 0 4 8 12162024 28 0.0 0.5 1.5 4.0 1.0 -8 -4 0 4 8 12162024 28 3.0 0.0 0.5 1.5 4.0 1.0 -8 -4 0 4 8 12162024 28 3.0 0.0 0.5 1.5 4.0 1.0 -8 -4 0 4 8 12162024 28 3.0 0.0 0.5 1.5 4.0 1.0 -8 -4 0 4 8 12162024 28 3.0 0.0 0.5 1.5 4.0 1.0 -8 -4 0 4 8 12162024 28 3.0 0.0 0.5 1.5 4.0 1.0 -8 -4 0 4 8 12162024 28 3.0
Days post infection
x 10
3 cells / µL
a b c d
Extended Data Fig. 5 | Complete blood count of SARS-CoV-2-infected cynomolgus macaques treated with HCQ. a–d, Absolute numbers of white
blood cells (WBC) (a), lymphocytes (b), neutrophils (c) and monocytes (d) in
SARS-CoV-2-infected macaques. Baseline was adjusted to day 0 on the graphs, and to the first day of treatment (day 7 pre-exposure) for the PrEP group. Shaded zones indicate treatment periods.
Extended Data Fig. 6 | Cytokines and chemokines in the plasma of SARS-CoV-2-exposed cynomolgus macaques treated with HCQ. a, b, Heat
maps of the plasmatic concentrations of 20 cytokines. Each column represents one cytokine or chemokine; the colour scale (in pg ml−1) is shown at the bottom.
The asterisk indicates a significant difference in the concentration of TNF at 2 d.p.i. between the control group and the Hi D1 and/or Hi D1 + AZTH groups, as
shown in d. ‘X’ indicates that no measurement was determined for this time
point. c, d, Concentrations of IL-1RA and TNF at 2 d.p.i. Each plot represents one
macaque. Symbols represent mean of duplicate measurements for individual macaques of two replicates for IL-1RA and a single replicate for TNF. Statistical significance was determined using a two-sided Mann–Whitney U-test without correction and P values are indicated on the graphs (c, d).
0 100 200 300 400 600 0 2 4 6 8 1012 1416 18 20 MF1 MF2 MF3 MF4 MF5 MF6 MF7 MF8 0 100 200 300 400 600 0 2 4 6 8 101214 16 18 20 MF9 MF10 MF11 MF12 MF13 0 100 200 300 400 600 0 2 4 6 8 1012 1416 18 20 MF14 MF15 MF16 MF17 0 100 200 300 400 600 0 2 4 6 8 1012 1416 18 20 MF23 MF24 MF25 MF26 0 100 200 300 400 600 0 2 4 6 8 10 1214 16 18 20 MF18 MF19 MF20 MF21 MF22 0 100 200 300 400 600 0 2 4 6 Lo D5 Hi D1 + AZTH Lo D1 Hi D1 CTRL MF34 MF35 MF32 MF33 MF36 MF37 PK Hi PK Lo PK Hi + AZTH
Days post infection
Days post infection
Days post treatment
IU / mL a b c f e d IU / mL
Extended Data Fig. 7 | Plasma ALT levels of cynomolgus macaques treated with HCQ. In addition to the six SARS-CoV-2-infected groups, three groups of
two macaques were treated but not infected to follow HCQ pharmacokinetics.
a–f, ALT levels in the plasma are shown for all infected macaques (a–e) and the
uninfected, HCQ-treated macaques (f). Shaded zones indicate treatment
12 6 0 2 4 8 10 1416 1820 400 0 300 200 100 12 6 0 2 4 8 10 1416 1820 0 2 4 6 8 10121416 1820 0 2 4 6 8 10121416 1820 0 2 4 6 8 10121416 1820 12 6 0 2 4 8 10 1416 1820 60 20 50 40 30 12 6 0 2 4 8 10 1416 1820 0 2 4 6 8 10121416 1820 0 2 4 6 8 10121416 1820 0 2 4 6 8 10121416 1820 12 6 0 2 4 8 10 1416 1820 15,000 0 5,000 600 200 800 400 12 6 0 2 4 8 10 1416 1820 0 2 4 6 8 10121416 1820 0 2 4 6 8 10121416 1820 0 2 4 6 8 10121416 1820 12 6 0 2 4 8 10 1416 1820 15 0 10 5 12 6 0 2 4 8 10 1416 1820 0 2 4 6 8 10121416 1820 0 2 4 6 8 10121416 1820 0 2 4 6 8 10121416 1820 12 6 0 2 4 8 10 1416 1820 4 0 3 2 1 12 6 0 2 4 8 10 1416 1820 0 2 4 6 8 10121416 1820 0 2 4 6 8 10121416 1820 0 2 4 6 8 10121416 1820 12 6 0 2 4 8 10 1416 1820 2,000 0 800 400 200 600 12 6 0 2 4 8 10 1416 1820 0 2 4 6 8 10121416 1820 0 2 4 6 8 10121416 1820 0 2 4 6 8 10121416 1820 12 6 0 2 4 8 10 1416 1820 0 100 40 20 80 60 12 6 0 2 4 8 10 1416 1820 0 2 4 6 8 10121416 1820 0 2 4 6 8 10121416 1820 0 2 4 6 8 10121416 1820 12 6 0 2 4 8 10 1416 1820 0 100 40 20 80 60 12 6 0 2 4 8 10 1416 1820 0 2 4 6 8 10121416 1820 0 2 4 6 8 10121416 1820 0 2 4 6 8 10121416 1820 ASAT Albumin Creatin K Creatinine Haptoglobi n LDH CRP Total protein g/ Lm g/ LI U/ Lg /L mg/L IU/L g/ LI U/ L CTRL Hi D1 MF1 MF2 MF3 MF4 MF5 MF6 MF7 MF8 MF9 MF10 MF11 MF12 MF13 Lo D1 MF14 MF15 MF16 MF17 Hi D1 + AZTH MF18 MF19 MF20 MF21 MF22 Lo D5 MF23 MF24 MF25 MF26 6 0 2 4 6 0 2 4 6 0 2 4 MF34 MF35 MF32 MF33 MF36 MF37 PK Hi PK Lo PK Hi + AZTH PK a b c d e f
Days post infection post treatmentDays
6 0 2 4 6 0 2 4 6 0 2 4 6 0 2 4 6 0 2 4
Extended Data Fig. 8 | Biochemistry analysis of cynomolgus macaques treated with HCQ. In addition to the six SARS-CoV-2-infected groups, three
groups of two macaques were treated but not infected to follow HCQ pharmacokinetics. a–f, AST, albumin, creatine kinase, creatinine, haptoglobin,
LDH, C-reactive protein (CRP) and total proteins levels were analysed in the plasma of all infected (a–e) and uninfected, treated (f) groups. Shaded zones
1
nature research | reporting summary
April 2020
Corresponding author(s): Roger LE GRAND
Last updated by author(s):Jun 3, 2020
Reporting Summary
Nature Research wishes to improve the reproducibility of the work that we publish. This form provides structure for consistency and transparency in reporting. For further information on Nature Research policies, see our Editorial Policies and the Editorial Policy Checklist.
Statistics
For all statistical analyses, confirm that the following items are present in the figure legend, table legend, main text, or Methods section. n/a Confirmed
The exact sample size (n) for each experimental group/condition, given as a discrete number and unit of measurement
A statement on whether measurements were taken from distinct samples or whether the same sample was measured repeatedly The statistical test(s) used AND whether they are one- or two-sided
Only common tests should be described solely by name; describe more complex techniques in the Methods section. A description of all covariates tested
A description of any assumptions or corrections, such as tests of normality and adjustment for multiple comparisons
A full description of the statistical parameters including central tendency (e.g. means) or other basic estimates (e.g. regression coefficient) AND variation (e.g. standard deviation) or associated estimates of uncertainty (e.g. confidence intervals)
For null hypothesis testing, the test statistic (e.g. F, t, r) with confidence intervals, effect sizes, degrees of freedom and P value noted Give P values as exact values whenever suitable.
For Bayesian analysis, information on the choice of priors and Markov chain Monte Carlo settings
For hierarchical and complex designs, identification of the appropriate level for tests and full reporting of outcomes Estimates of effect sizes (e.g. Cohen's d, Pearson's r), indicating how they were calculated
Our web collection on statistics for biologists contains articles on many of the points above.
Software and code
Policy information about availability of computer code
Data collection Data was collected using classical Excel 2016 Files and stored in a custom database called BatLab. All the data is available upon request to the corresponding author
Data analysis Data was analyzed using GraphPad Prism 7,INTELLISPACE PORTAL 8 software
For manuscripts utilizing custom algorithms or software that are central to the research but not yet described in published literature, software must be made available to editors and reviewers. We strongly encourage code deposition in a community repository (e.g. GitHub). See the Nature Research guidelines for submitting code & software for further information.
Data
Policy information about availability of data
All manuscripts must include a data availability statement. This statement should provide the following information, where applicable:
- Accession codes, unique identifiers, or web links for publicly available datasets - A list of figures that have associated raw data
- A description of any restrictions on data availability
The data that support the findings of this study are available from the corresponding
author upon reasonable request. GISAID EpiCov platform accession numbers are: EPI_ISL_406596 for hCoV-19/France/lDF0372/2020 and EPI_ISL_411218 for hCoV-19/France/IDF0571/2020
2
April 2020
Field-specific reporting
Please select the one below that is the best fit for your research. If you are not sure, read the appropriate sections before making your selection. Life sciences Behavioural & social sciences Ecological, evolutionary & environmental sciences
For a reference copy of the document with all sections, see nature.com/documents/nr-reporting-summary-flat.pdf
Life sciences study design
All studies must disclose on these points even when the disclosure is negative.
Sample size No sample size calculation was performed, Samples size was determined as the minimal number of animals allowing non-parametric statistical analysis while complying with the 3Rs rule on reducing, replacing and refining the use of animals for scientific purpose.
Data exclusions No data has been excluded from analysis
Replication Duplicates were performed for all measurments (viral loads, drug concentration)
Randomization Animal were randomly allocated to experimental groups. There was no other group comparison studies requiring randomization in the reported work
Blinding Animals care, clinical examination and sampling was not blinded because constrains associated to BSL3 containment. However, viral load and drug concentrations were determined blinded by the groups at Institut Pasteur and Aix-Marseille University, respectively
Reporting for specific materials, systems and methods
We require information from authors about some types of materials, experimental systems and methods used in many studies. Here, indicate whether each material, system or method listed is relevant to your study. If you are not sure if a list item applies to your research, read the appropriate section before selecting a response.
Materials & experimental systems
n/a Involved in the studyAntibodies Eukaryotic cell lines
Palaeontology and archaeology Animals and other organisms Human research participants Clinical data
Dual use research of concern
Methods
n/a Involved in the study
ChIP-seq Flow cytometry MRI-based neuroimaging
Eukaryotic cell lines
Policy information about cell lines
Cell line source(s) African green monkey kidney VERO C1008 cell line [Vero 76, clone E6, Vero E6] (ATCC® CRL-1586™)
Authentication This cell line has been directly obtained from ATCC but not authenticated in-house
Mycoplasma contamination Confirmed negative test for mycoplasma contamination
Commonly misidentified lines
(See ICLAC register) No commonly misidentified cell lines were used in the study
Animals and other organisms
Policy information about studies involving animals; ARRIVE guidelines recommended for reporting animal research
Laboratory animals The study have included 35 cynomolgus macaques (Macaca fascicularis), both of male and female gender, aged 37-40 months
Wild animals No wild animals were used in the studyl. Al used animals were purposed bred and imported from AAALAC certified breeding centers
3
nature research | reporting summary
April 2020
Ethics oversight The protocols were approved by the institutional ethical committee “Comité d'Ethique en Expérimentation Animale du Commissariat à l’Energie Atomique et aux Energies Alternatives” (CEtEA #44) under statement number A20-011. The study was authorized by the “Research, Innovation and Education Ministry” under registration number APAFIS#24434-2020030216532863v1.