HAL Id: ird-00351392
https://hal.ird.fr/ird-00351392
Submitted on 9 Jan 2009
HAL is a multi-disciplinary open access
archive for the deposit and dissemination of
sci-entific research documents, whether they are
pub-lished or not. The documents may come from
teaching and research institutions in France or
abroad, or from public or private research centers.
L’archive ouverte pluridisciplinaire HAL, est
destinée au dépôt et à la diffusion de documents
scientifiques de niveau recherche, publiés ou non,
émanant des établissements d’enseignement et de
recherche français ou étrangers, des laboratoires
publics ou privés.
Are natural and fishing mortalities comparable for
tropical tunas ? : a multispecies approach with tagging
data
Daniel Gaertner, François-Xavier Bard, Jean-Pierre Hallier
To cite this version:
Daniel Gaertner, François-Xavier Bard, Jean-Pierre Hallier. Are natural and fishing mortalities
com-parable for tropical tunas ? : a multispecies approach with tagging data. Collective Volume of Scientific
Papers, ICCAT, 2006, 56 (2), pp.421-430. �ird-00351392�
SCRS/2005/053 Col. Vol. Sci. Pap. ICCAT, 59(2): 421-430 (2006)
ARE NATURAL AND FISHING MORTALITIES COMPARABLE FOR
TROPICAL TUNAS? :
A MULTISPECIES APPROACH WITH TAGGING DATA
Daniel Gaertner1, François-Xavier Bard and Jean Pierre Hallier2 SUMMARY
With the aim of increasing the precision of parameter estimates in tagging analyses, we assumed that the dynamics of tagged fish from different tropical tuna species have processes in common. With this consideration in mind we fit different data sets from two distinct periods of the eastern Atlantic fishery with a multispecies tag-attrition model to provide information for the shared parameters. Among the different assumptions considered, a common attrition rate for the three species of tropical tuna (yellowfin, skipjack and bigeye tuna) was not supported by the data under the AIC criteria. However the estimates of the attrition rate for yellowfin and for skipjack were relatively close. On the basis of these preliminary results, it would be interesting to check in the future the accuracy of a common type-1 tag losses (i.e., α) between tagging periods/locations or between species with more complete data sets. Given the limitations of the data and accounting for model uncertainties, it was shown that the Z coefficient was increased by a factor 4.5 for yellowfin from the first period of time (1980-1981) to the second one (1996-2002). For skipjack and bigeye tuna this increase reached 3.4 and 3.2, respectively. One explanation may result from the increasing use of FADs fishing operations in the tropical surface fishery.
RÉSUMÉ
Dans le but d’accroître la précision des estimations de paramètres dans les analyses de marquage, nous avons postulé que la dynamique des poissons marqués de différentes espèces thonières tropicales a des processus en commun. Avec cette considération à l’esprit, nous ajustons différents jeux de données provenant de deux périodes différentes de la pêcherie est-atlantique à un modèle d’attrition de marques plurispécifique afin de fournir des informations pour les paramètres partagés. Parmi les différents postulats examinés, un taux d’attrition commun pour les trois espèces de thonidés tropicaux (albacore, listao et thon obèse) n’a pas été appuyé par les données selon les critères AIC. Toutefois, les estimations du taux d’attrition pour l’albacore et pour le listao étaient relativement proches. Sur la base de ces résultats préliminaires, il serait intéressant de vérifier à l’avenir l’exactitude des pertes des marques communes de type-1 (soit α) entre les périodes/lieux de marquage ou entre les espèces dotées
de jeux de données plus complets. Compte tenu des limitations des données et des incertitudes des modèles, il s’est avéré que le coefficient Z a été augmenté par un facteur 4,5 pour l’albacore à partir de la première période de temps (1980-1981) à la seconde (1996-2002). Pour le listao et l’albacore, cette augmentation a atteint 3,4 et 3,2 respectivement. L’utilisation croissante des opérations de pêche avec DCP dans la pêcherie de surface tropicale pourrait en être une explication.
RESUMEN
Con el objetivo de incrementar la precisión de las estimaciones de parámetros en los análisis de marcado, hemos asumido que la dinámica de los ejemplares marcados de diferentes especies de túnidos tropicales tiene procesos comunes. Con esta consideración en mente ajustamos diferentes conjuntos de datos de dos periodos distintos de la pesquería del Atlántico oriental a un modelo de pérdida de marcas multiespecífico para obtener información para los parámetros compartidos. Entre los diferentes supuestos considerados, el supuesto de la tasa de pérdida común para las tres especies de túnidos tropicales (rabil, listado y patudo) no fue respaldado
1 IRD (UR Thétis) CRH BP 171, 34203 Sète Cedex, France 2 IOTC, PO Box 1011, Victoria, Seychelles
por los datos según los criterios AIC. Sin embargo, las estimaciones de esta tasa de pérdida para el rabil y listado eran relativamente cercanas. Sobre la base de estos resultados preliminares, sería interesante comprobar en el futuro la precisión de unas pérdidas de marcas tipo 1 comunes (por ejemplo, α), entre periodos/lugares de marcado o entre especies con
conjuntos de datos más completos. Dadas la limitaciones de los datos y considerando las incertidumbres del modelo, se mostró que el coeficiente Z se había incrementado por un factor 4,5 para el rabil desde el primer periodo de tiempo (1980-1981) hasta el segundo (1996-2002). Para el listado y el patudo este incrementó alcanzó 3,4 y 3,3; respectivamente. Una explicación podría ser el incremento de la utilización de operaciones de pesca con DCP en las pesquerías tropicales de superficie.
KEYWORDS
Natural mortality, Fishing mortality, Tropical tuna, Multispecies, Tagging
1 Introduction
Knowledge of natural mortality is fundamental to understanding the population dynamics of a fish population and is necessary for its management. Because natural causes of mortality are seldom observable, fishery biologists involved in stock assessment must use alternative sources of data, such as tagging data whose analyses can be helpful to estimate abundance, survival, movement and mortality.
Many methods have been used to analyse tagging data and many of them have been developed for specific
purposes (Jones, 1976). However, the tag-attrition models (Kleiber et al., 1987) and their derivatives (Hilborn,
1990; Anganuzzi et al., 1994; Bertignac et al., 1999; Hampton, 2000; Hampton and Fournier, 2001) provide a general framework for analyzing tagging data to answer a wide range of questions. These models allow the incorporation of the dynamics of the system into the analysis through the model equations and provide a framework for including multiple types of data. Integration of multiple analyses together is a method that can
increase the amount of information derived from data sets (Maunder, 2003). If two analyses applied to two
different data sets have processes in common, they can be combined and parameters can be shared between analyses. This allows the two data sets to provide information for the shared parameters, increasing the precision of their estimates (Gaertner et al., 2004). Combining analyses also allows for the use of standard methods for hypothesis testing to investigate differences between the analyses.
For all of these reasons, it would be reasonable to assume that different species of tropical tunas tagged at the same time would experience comparable mortalities after being released. Among the different assumptions of interest, one can assume that surface-schooling tunas of similar size and inhabiting the same ecological habitat have comparable natural mortality. In opposite, one can argue that fishes belonging to the same commercial size category exhibit similar patterns of change in fishing mortality (e.g., targeting for small tropical tunas depends on the price of the corresponding commercial size category, independently of the species). It can also be raised that non-report of tags, tag-loss and tag-induced mortality are very comparable among tagging locations, or among species, etc.
The main objective of this study is to apply a multispecies approach within tagging data analyses in order to compare the mortality coefficients between tuna species and between different periods of the development of the Eastern Atlantic fishery as well as the conventional parameters used in tag-attrition models. With this consideration in mind we use a tag-attrition model that combines data from different tagging experiments to fit the return rate of tropical tunas as a function of time from release.
2 Materials and Methods 2.1 Data
The major part of the tagging data analysed in this study were obtained from the recent compilation published by Bard (2005). One of the interests of this compilation concerns the fact that the tagging data were collected during two very distinct phases of development of the tuna fishery in the Eastern tropical Atlantic fishery. The first historic period corresponds to the tagging operations made at the beginning of the eighties (1980-81) within the
framework of the Skipjack Year Program (ISYP) of the International Commission for the Conservation of Atlantic Tunas (ICCAT), while the second period concerns the Bigeye Tuna Year Program (BETYP) of ICCAT initiated at the end of the nineties (1999-2002). Concerning the changes in fishing activities between these two periods of time, in addition to the increasing fishing effort over the years and the expansion of the fishing grounds from the coastal areas to the offshore areas, it is commonly admitted that fishing practices also have been dramatically modified. A good illustration of this aspect is the increasing use of fishing aggregating devices (FADs) in the surface fishery in the late eighties.
During the ISYP various tagging cruises concerning the 3 main species of tropical tuna (i.e., yellowfin: Thunnus
albacares; skipjack: Katsuwonus pelamis and bigeye tuna: Thunnus obesus) were conducted in the Eastern
Atlantic Ocean. For purpose of comparison with the recent tagging information the data collected during the tagging experiences conducted in Gulf of Guinea in 1980-1981 (Japan, Côte d'Ivoire) were revised again by Bard and Bannerman (2002). These data were pooled into a single vector of recoveries by month at large with the aim of characterizing the first period of the fishery.
During BETYP, tagging experiences took place in the Gulf of Guinea, using initially chartered baitboats from Ghana, and later opportunistic tagging aboard commercial baitboats based in Tema. However owing to the high and erratic initial rates of recoveries, likely caused by non mixing and low survival rate due to difficulties of handling fish during commercial frantic fishing operations (Bard, 2005), these data were not included in the present analysis. In contrast, the results of the tagging operations conducted on board a Portuguese baitboat based in Sao Tomé (cruises AGRIAO 1 and AGRIAO 2) at mid year of 2001 and 2002 were pooled and used in the analysis of recaptures over time. Tagging took place in the Gulf of Guinea in a triangular area termed "Cape Lopez", limited by Sao Tome Island, (0° N, 6° E), coast of Gabon and Cape Lopez. This second data set represents the second period of the fishery.
In some circumstances, the date (i.e., month) of recapture was unknown (cf. Table 2 in Bard, 2005). In such situations, the unknown recaptures were allocated to the different months at large on the basis of the proportion of identified recaptures by month.
Additional tagging information was provided by the research program called MAC (for “Mattes de thons
Associées aux Canneurs”) on the bait boat fishing technique and its consequences (Hallier et al., 2001). Tagging
occurred off the Mauritanian coast from 1996 to 2000 on board commercial baitboats operating from Dakar (Senegal). This baitboat fleet uses a peculiar fishing technique which consists of keeping a permanent association between the fishing boat and the fished tuna school (Fonteneau and Diouf, 1994; Hallier and Delgado, 2000).
This data set was recently used to compare the efficiency of the “spaghetti” tag (a conventional tag widely used for tagging of tuna) and another type of tag (commonly used by the sport fishermen) which was used during the BETYP. However, the lower efficiency of the new tag type, specifically for the recapture rate of bigeye tuna
(Thunnus obesus), was showed in previous studies (Hallier and Gaertner, 2002; Gaertner and Hallier, 2004;
Gaertner et al, 2004). Accordingly only the spaghetti tag type was used in the present analysis. As it will be mentioned later in the Method section, this third data set shares some common features and parameters with the second data set. Nevertheless after screening the number of recaptures by month for the 3 tuna species it was seen that the recoveries of yellowfin were too low and erratic. Consequently, we included only skipjack and biegeye tagging data in the present multispecies analysis.
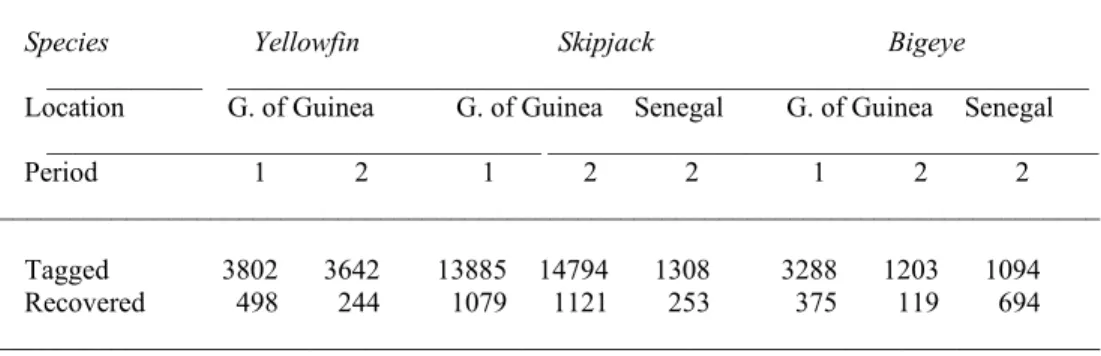
Table 1 summarises the number of tagged fish and the number of recaptures by period and by tagging location.
2.2 Method.
With the aim to describe the dynamic of the tagged population we assume a simple discrete model based on 3 important parameters: natural mortality, fishing mortality and tag shedding. The model, referred to as the tag-attrition model (Kleiber et al., 1987; Hampton, 1997), can be expressed as:
(
)
[
(
)
]
⎟⎟
⎠
⎞
⎜⎜
⎝
⎛
Δ
−
Δ
−
−
−
=
∑
− = 1 1exp
exp
1
1
ˆ
j k t k i t j i j i j i i i j iZ
Z
Z
F
T
r
α
where: j ii
α
= all type-1 tag losses (from immediate mortality, tag shedding and non-reporting) for species i,i
T
= number of tag released for species i,λ
+
+
=
ij j iA
F
Z
i = instantaneous rate of total mortality,=
iA
attrition rate (assumed constant over time), is the sum of the instantaneous rate of natural mortality andpermanent emigration from the fishing area,
j i
F
= instantaneous rate of fishing mortality for species I at time j,λ = additional continuous type-2 tag losses (from tag shedding),
t
Δ
= the time step relative to the units of the instantaneous rates (i.e., 1 month).Tags may have many influences on the individual fish and these may differ between tag types. The main effects that are usually considered in fish tagging analysis are initial mortality caused by tagging and long term mortality (e.g. from disease caused by tagging). In addition to mortality caused by tagging, tags may be shed by the
individuals and not recorded. These can be grouped into effects thatoccur soon after tagging (type-1 tag loss)
and those that occur continuously (type-2 tag loss). It is usually not possible to distinguish between the effects of tag shedding and tag induced mortality unless double tagging experiments are carried out. Accordingly we are assuming from literature that continuous type-2 tag losses for conventional tags is close to 0 (Kleiber et al, 1987; Hampton, 1997). In addition, tags from captured individuals may not be reported and these usually cannot be separated from type-1 tag loss unless tag seeding studies are carried out.
To account for observed seasonal migrations following release and/or seasonal fishing activities, we reparameterized the instantaneous rate of fishing mortality F ij with a sinusoidal function as:
(
)
[
i i]
i
k
t
F
F
ij=
1
+
sin
ω
+
ϕ
, with ω = 2 π / 12; t = 1,2, ….etc. (i.e., months); Gaertner et al. (2004).Now in the framework of a multispecies analysis, and accounting for different tagging locations, we can write a complete tag-attrition model as follows:
(
)
[
]
⎟
⎟
⎠
⎞
⎜
⎜
⎝
⎛
Δ
−
Δ
−
−
⎟
⎠
⎞
⎜
⎝
⎛ −
=
∑
− = 1 1exp
exp
1
1
ˆ
j k ikpl t t l p j i l p j i l p j i l p i l p i l p j iZ
Z
Z
F
T
r
α
,where
Z
i jpl=
A
i+
F
i jpl andF
ijpl=
F
ip[
1
+
k
iplsin
(
ω
t
+
ϕ
ipl)
]
; Model AThe different parameters have the same meaning as previously described and the indices p and l are identifying the period (1= ISYP, 2= BETYP) and the tagging location (Gulf of Guinea or Senegal), respectively. We assumed that F represented the fishing mortality for the whole stock (i.e. not tagging location dependent) and so that fish were mixing freely between the two areas. For the sake of simplicity, we assumed that F “Gulf of Guinea” for tagging initiated during 2001-2002 and F “Senegal” (1996-2000) were equivalent and representative of the second historic period of the fishery (i.e., F i 2 ).
As mentioned in the Introduction section, if models applied to different data sets have processes in common, they can be combined and parameters can be shared between analyses. With this consideration in mind, we considered the following models:
A second model (Model B) differs with the complete model (Model A) on the basis of parameters k and φ from the sinusoidal function depicting the seasonal change of fishing mortality only. In Model B we assumed that for the Gulf of Guinea the seasonal pattern of F was stable over the two periods considered, and consequently that: k
i 1 l=Guin.= k i 2 l=Guin and φ i 1 l=Guin.= φ i 2 l=Guin.
Model C, was based on the assumption that the 3 species shared the same value for the attrition rate A (which can be considered as a proxy for M). Model C has the same formulation than Model A but with the following simplification: l p j i l p j i
A
F
Z
=
+
For Model D, we considered that the massive use of artificial logs since the end of the eighties was a major change in the fishery pattern and affected in a similar manner the exploitation rate of the 3 species of tuna. Assuming that differences in accessibility between species are negligible comparatively with the modification of the overall catchability due to the FADs fishing operations (i.e., F yft, p=1 = F skj ,p=1 = F bet, p=1 and F yft, p=2 = F skj, p=2 = F bet, p=2 ), we defined the following model:
l p j l p j i
A
F
Z
=
i+
, whereF
jpl=
F
p[
1
+
k
iplsin
(
ω
t
+
ϕ
ipl)
]
, Model DWith respect to the proportion of fish dying immediately after tagging, it can be assumed that this parameter is either species dependant (Model E with α i), either period dependant (Model F with α p l , with different levels for
accounting for the tagging location).
For relating the observed numbers of tag returns r i j p l to the predicted numbers of tag returns
rˆ
ijpl we useda multinomial likelihood function (Kleiber and Hampton 1994; Anganuzzi et al. 1994; Bertignac et al. 1999; Hampton 2000). Let
T
r
p
l p i l p j i l p j iˆ
=
the probability of any one tag of species i released in location l during theperiod p and returned during month j, and
T
r
l
p
i
l
p
j
i
j
ˆ
1
∑
−
, the probability of not being returned. Hence, theparameters of the tag-attrition model were estimated by minimizing the negative of the log likelihood:
∑
∑
∑
∑
∑
⎥
⎥
⎦
⎤
⎢
⎢
⎣
⎡
⎟
⎟
⎠
⎞
⎜
⎜
⎝
⎛
+
⎟⎟
⎟
⎠
⎞
⎜⎜
⎜
⎝
⎛
∑
−
⎟
⎠
⎞
⎜
⎝
⎛
−
−
i l p j i l p j i l p j i j l p j i l p i l pT
r
T
r
l p i l p ir
r
T
jln
1
ˆ
jln
ˆ
Starting from the most parameterised tag-attrition model (i.e., Model A), we check whether any submodel with less parameters might fit reasonably well the recoveries to the time from release for the different species, periods and locations. We used the Akaike’s information criteria (AIC) as an objective means of model selection from a set of candidate models (Lebreton et al. 1992). This criterion gives a good trade-off between the extremes of under-fitting and over-fitting, that is on one side bias due to too few parameters and on the other side high variance due to too many parameters (Burnham and Anderson 1992). The model with the smallest AIC (the parsimonious model) is used for estimating recoveries per unit of time.
Because we are using multinomial as basis for likelihood function for count data (e.g. the number of recoveries per unit of time) we need to consider over-dispersion. With mark-recapture data over-dispersion can occur because the recaptures are not independent for different reasons: e.g., schools of fish, heterogeneity in catchability over time among marked fish. In this context quasi-likelihood theory justifies the usual maximum likelihood estimators as optimal point estimators of the parameters, even when there are excess variations in the data (Burnham and Anderson 1992). The simplest way to allow for over-dispersion is to perform a quasi-likelihood estimate of the variance inflation factor ( c ) from the goodness-of-fit chi-square statistic ( χ 2 ) of the
most parameterised model and its degrees of freedom (df ), where ĉ is:
ĉ = χ 2 / df .
When calculating χ 2, pooling may be required in order to avoid small expected frequencies. Aside from its use
during the model selection process, the variance inflation factor can be used to correct the model-based variances and covariances (i.e., multiplying its by ĉ ).
Using quasi-likelihood theory, and accounting for small-sample bias correction, the conventional AIC criterion is modified as (Anderson et al. 1994):
( )
[
]
{
}
(
)
1
1
2
2
ˆ
/
ˆ
log
2
−
−
+
+
+
−
=
K
n
K
K
K
c
QAICc
l
θ
where n = number of strata (i.e., combination of months, species, periods and locations); K = number of parameters.
However, because there are errors in the data, we cannot be certain that the ranking of competing models is
correct. To account for model selection uncertainty, the normalised quasi-likelihood Akaike weights (W i ) are
used as:
⎥
⎦
⎤
⎢
⎣
⎡
⎟
⎠
⎞
⎜
⎝
⎛ Δ
−
∑
⎥
⎦
⎤
⎢
⎣
⎡
⎟
⎠
⎞
⎜
⎝
⎛ Δ
−
=
2
exp
2
exp
QAICc
i
QAICc
i
i i
W
where
Δ
QAICc
i
=
QAICc
i−
min
QAICc
(Anderson et al., 2000).The model with minimum QAICc will have the greatest W i , and consequently will have the most relative
strength of evidence over the competing models. However, this method accounts for the less plausible models, once they are down-weighted by its relative likelihoods.
3 Results and discussion
The quasi-likelihood information criterion (QAICc) and the normalised quasi-likelihood Akaike weights (Wi ) for
the different tags attrition models are shown in Table 2. To facilitate the evaluation of performance of the different models, the candidate models have been ranked from best to worst, based on the Akaike weights. The estimates of the parameters are presented for a number of different assumptions represented by sharing parameters between the three species, periods and tagging locations in Table 3.
Comparatively to the most parameterised model (Model A), several models supporting a simplification improve
significantly the fit of the recaptures data. Using the Akaike information criterion as the tool for model selection,
the model assuming no change for k and φ in the sinusoidal time variation for F in the Gulf of Guinea between
the 2 periods (Model B) is the best model to explain the recoveries over time among the different models tested. The comparison of the Akaike weight values indicates that this model has much more support than the models
assuming no difference in type-1 tag losses (i.e.,α), either between the periods (Model F), either between the
species (Model E ), or with a common F for the 3 species within each period considered (Model D). Even these
assumptions (i.e. embedded in models F, E, D) appeared to be less plausible than the structure considered for establishing Model B, it would be interesting to reanalyse their performance in future analyses hold on larger tagging database. The plot of observed and predicted tags returns by time at liberty shows that model B provides a good fit of the data for each species, tagging location and period of time (Figure 1).
In contrast, the assumption concerning a common value for the attrition rate A for yellowfin, skipjack and bigeye
(and likely the same for M) was not supported by the data. However, keeping in mind that natural mortality in
tuna populations is dependent on size (Hampton, 2000) and given the limitation of the data (e.g. possible differences in the size distributions of the fish released, moderate sample sizes, etc) we cannot conclude
definitively whether A varies or not among tuna species (specifically for yellowfin and skipjack for which the
estimates of A are close).
It must be stressed that the smaller sample size in this study compared to other tagging programs, adds more uncertainties to the absolute values of the parameter estimates. Any bias in all type-1 tag losses, whatever the
causes (immediate mortality, tag shedding or non-reporting) might affect the estimate of A and F. In the same
way of idea, it appears likely that any bias on the estimate of one of the mortality rate affects the estimate of the second. As a consequence, overall one should not award a great weight to the absolute values of natural and
fishing mortality coefficients but rather to the relative difference between the estimates of Z, between species or
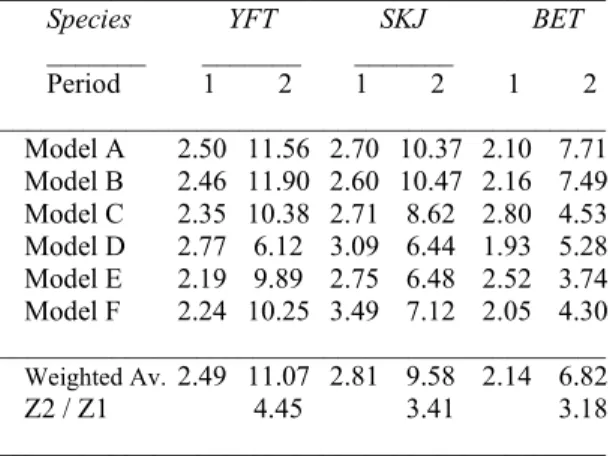
between periods, that remained whatever the model considered (Table 4). In addition, because there is not a strong evidence favoring the best model (e.g., W i > about 0.9), the estimates of Z can be averaged over the six
competing models in a way that accounts for model selection uncertainty. In such situation a weighted average of Z is calculated as:
Z m
m
W m
Z
6
ˆ
1
ˆ
∑
=
=
,While the 3 species depicted comparable averaged Z values at the beginning of the eighties (Z1 was evaluated
FADs fishing operations affected the populations of tropical tunas. It must be stressed that the major increase was showed for yellowfin (an increasing factor of 4.5). In contrast, change in total mortality was lower for skipjack, as well as for bigeye. Therefore further studies are necessary to confirm these results.
Addendum
This document was written in the memory of our IRD colleague: Dr F.-X. Bard for his contribution to temperate and tropical tuna studies.
References
ANDERSON, D.R., K.P.Burnham and G.C. White. 1994. AIC model selection in overdispersed
capture-recapture data. Ecology 75(6): 1760-1793.
ANDERSON, D.R., K.P.Burnham and W.L. Thompson. 2000. Null hypothesis testing: problems, prevalence,
and an alternative. Journal of Wildlife Management (64): 912-923.
ANGANUZZI, A., R. Hilborn and J.R. Skalski. 1994. Estimation of size selectivity and movement rates from mark-recovery data. Can. J. Fish. Aquat. Sci. (51): 734–742.
BERTIGNAC, M., J. Hampton and A.L. Coan. 1999. Estimates of exploitation rates for north Pacific albacore,
Thunnus alalunga, from tagging data. Fish. Bull. (97): 421–433.
BARD, F.-X., (2005). Update of basic data on BETYP tagging recoveries in eastern tropical Atlantic, January
2004. Col. Vol. Sci. Pap. ICCAT: 57(1): 69-75.
BARD, F.-X. and P. Bannerman. 2002. Analysis of early recoveries of BETYP taggings in Eastern Tropical
Atlantic, as compared to ISYP and YYP taggings. Col. Vol. Sci. Pap. ICCAT: 54(1): 42-56.
BURNHAM, K. P. and D.R. Anderson. 1992. Data-based selection of an appropriate biological model: the key
to modern data analysis. In Wildlife 2001 populations. Edited by D.R. McCullough and R.H. Barrett.
Elsevier, London, U. K. pp. 16-30.
FONTENEAU, A. and T. Diouf.1994. An efficient way of bait fishing for tunas recently developed in Senegal.
Aquat. Living Resour. 7(3): 139-151.
GAERTNER, D. and J.P. Hallier. 2004. Combining Bayesian and simulation approaches to compare the
efficiency of two types of tags used in tropical tuna fisheries. Aquat. Living Resour. (17): 175–183.
GAERTNER, D., J.P. Hallier, and M.N. Maunder. 2004. A tag-attrition model as a means to estimate the
efficiency of two types of tags used in tropical tuna fisheries. Fish. Res. (69): 171–180.
HAMPTON, J. 1997. Estimates of tag-reporting and tag-shedding rates in a large-scale tuna tagging experiment in the Western tropical Pacific Ocean. Fish. Bull. (95): 68–79.
HAMPTON, J. 2000. Natural mortality rates in tropical tunas: size really does matter. Can. J. Fish. Aquat. Sci. (57): 1002-1010.
HAMPTON, J. and D.A. Fournier. 2001. A spatially disaggregated, length based, age-structured population
model of yellowfin tuna (Thunnus albacares) in the western and central Pacific Ocean. Mar. Freshwater
Res. (52): 937–963.
HALLIER, J.P. and A. Delgado de Molina. 2000. Baitboat as a tuna aggregating device. Le canneur : un dispositif de concentration des thons in J.Y. Le Gall, P. Cayré, M. Taquet (eds), 2000. Pêches thonières et
dispositifs de concentration de poissons. Ed. Ifremer, Actes Colloq. (28): 553-578.
HALLIER, J.P., T. Diouf, A. Hervé and C. Peignon, C. 2001. Le Programme MAC: Etat des opérations et des
analyses. Doc. multigraphié, CRODT, IRD, CNROP. 90 p.
HALLIER, J.-P. and D. Gaertner. 2002. Comparative efficiency between BETYP tags and conventional tags. Col. Vol. Sci. Pap. ICCAT 54 (1): 17–32.
HILBORN, R. 1990. Determination of fish movement patterns from tag recoveries using maximum likelihood estimators. Can. J. Fish. Aquat. Sci. (47): 635–643.
KLEIBER, P., A.W. Argue and R.E. Kearney. 1987. Assessment of Pacific skipjack tuna (Katsuwonus pelamis)
resources by estimating standing stock and components of population turnover from tagging data. Can. J. Fish. Aquat. Sci. (44): 1122–1134.
KLEIBER, P. and J. Hampton. 1994. Modeling effects of FADs and islands on movement of Skipjack tuna (Katsuwonus pelamis): Estimating parameters from tagging data. Can. J. Fish. Aquat. Sci. (517):
2642-2653.
LEBRETON, J.D., K.P. Burnham, J. Clobert, and D.R. Anderson. 1992. Modelling survival and testing biological hypotheses using marked animals: a unified approach with case studies. Ecol. Monographs 62(1): 67–118.
JONES, R. 1976. The use of marking data in fish population analysis. FAO Fish. Tech. Pap. (153), 42 p.
MAUNDER, M.N. (2003). Paradigm shifts in fisheries stock assessment: from integrated analysis to Bayesian analysis and back again. Natural Resource Modelling 16 (4): 465–475.
Table 1. Number of releases and number of recoveries by species, by location and by period of time (1 = ISYP; 2 = BETYP).
_____________________________________________________________________________
Species Yellowfin Skipjack Bigeye
___________ _____________________________________________________________
Location G. of Guinea G. of Guinea Senegal G. of Guinea Senegal
___________________________________ _______________________________________ Period 1 2 1 2 2 1 2 2 ______________________________________________________________________________ Tagged 3802 3642 13885 14794 1308 3288 1203 1094 Recovered 498 244 1079 1121 253 375 119 694 ______________________________________________________________________________
Table 2. Model selection for the multispecies tag-attrition model used to fit the recoveries to the time from release. Models have been ranked from best to worst according to the Akaike weights: (N. par.) number of parameters, (Nll) negative log-likelihood, (QAICc) quasi-likelihood Akaike Information criterion, (W) Akaike information criterion weight.
__________________________________________
Model Npar nll QAICc Wi
__________________________________________ B 27 20100.27 886.27 0.74 F 28 20071.28 889.58 0.14 D 29 19964.77 889.95 0.12 E 28 20226.83 895.82 0.01 C 31 19961.23 899.61 0.00 A 33 20135.21 917.15 0.00 __________________________________________
Table 3. Estimates for type-1 tag losses (α), attrition rates (A), instantaneous rate of fishing mortality (F) and
parameters for the sinusoidal form of F for yellowfin (Yft), skipjack (Skj) and bigeye (Bet), by tagging location
(Gulf of Guinea and Senegal) and for two contrasted periods of development of the Eastern Atlantic tuna fishery (Period 1 = 1980-1981, Period 2 = 1996-2002). Numbers in italic depict shared parameters.
__________________________________________________________________________________________
Species Yft Skj Bet Yft Skj Bet Yft Skj Bet
______ ______________ _____________ ___ ___ ___ ______ ______ ______
Location Guinea Guinea Senegal Guinea Senegal
______ _______ ____ _______ ____ Period 1 2 1 2 2 1 2 2 1 2 1 2 1 2 __ __ __ __ __ __ __ __ __ __ __ __ __ __ __ __ __ Model α α α α α α α α A A A F1 F2 F1 F2 F1 F2 __________________________________________________________________________________________________ B 0.38 0.92 0.83 0.92 0.79 0.85 0.89 0.32 1.95 1.47 0.54 0.51 9.95 1.13 9.00 1.62 6.95 F 0.79 0.91 0.79 0.91 0.39 0.79 0.91 0.39 0.99 2.34 0.79 1.25 9.26 1.15 4.78 1.26 3.51 D 0.78 0.92 0.86 0.92 0.75 0.87 0.90 0.33 1.12 1.44 0.28 1.65 5.00 1.65 5.00 1.65 5.00 E 0.94 0.94 0.92 0.92 0.92 0.00 0.00 0.00 -2.36 -0.08 2.29 4.55 12.25 2.83 6.56 0.23 1.45 A 0.65 0.92 0.84 0.92 0.78 0.86 0.90 0.34 1.65 1.45 0.38 0.85 9.91 1.25 8.92 1.72 7.33 C 0.84 0.94 0.91 0.93 0.83 0.89 0.87 0.28 0.59 0.59 0.59 1.76 9.79 2.12 8.03 2.21 3.94 __________________________________________________________________________________________ __________________________________________________________________________________
Species Yft Skj Bet Yft Skj Bet
______ ______________ _____________ _______ __________________________
Location Guinea Guinea Senegal Guinea Senegal Guinea Guinea Senegal Guinea Senegal
______ _______ ____ _______ ____ _______ _______ ____ _______ __ Period 1 2 1 2 2 1 2 2 1 2 1 2 2 1 2 2 __ __ __ __ __ __ __ __ __ __ __ __ __ __ __ __ Model k k k k k k k k φ φ φ φ φ φ φ φ __________________________________________________________________________________________ B 0.28 0.28 0.23 0.23 0.65 0.72 0.72 -0.07 19.58 19.58 19.50 19.50 20.79 19.22 19.22 20.60 F -0.44 0.61 -0.02 0.93 -0.87 0.87 1.26 0.82 21.57 20.86 20.21 19.73 18.72 19.13 19.90 19.66 D -0.03 0.96 -0.04 0.98 0.54 0.85 0.89 0.73 20.38 20.00 20.00 19.45 20.88 19.13 19.58 19.27 E 0.35 0.56 0.13 1.17 0.77 0.78 -1.51 1.05 17.93 20.55 18.69 20.41 19.17 19.32 21.10 19.92 A 0.45 0.06 0.09 0.36 0.23 0.64 0.69 -0.15 19.82 20.18 19.81 19.92 20.47 19.10 19.61 20.50 C 0.07 0.31 0.09 0.53 0.57 0.75 1.61 0.78 19.64 20.57 19.27 19.27 19.61 20.72 19.22 20.30 __________________________________________________________________________________________
Table 4. Estimates of the total mortality rates (Z) from the different models, weighted average of Z and global increase between the two periods concerned.
___________________________________________
Species YFT SKJ BET
_______ _______ _______ Period 1 2 1 2 1 2 ___________________________________________ Model A 2.50 11.56 2.70 10.37 2.10 7.71 Model B 2.46 11.90 2.60 10.47 2.16 7.49 Model C 2.35 10.38 2.71 8.62 2.80 4.53 Model D 2.77 6.12 3.09 6.44 1.93 5.28 Model E 2.19 9.89 2.75 6.48 2.52 3.74 Model F 2.24 10.25 3.49 7.12 2.05 4.30 ___________________________________________ Weighted Av.2.49 11.07 2.81 9.58 2.14 6.82 Z2 / Z1 4.45 3.41 3.18 ___________________________________________ 5 10 15 20 0 100 250 SKJ Guinea P 1 Recaptures Months at large 0 5 10 20 20 80 BET Guinea P 1 Recaptures Months at large 0 5 15 25 20 60 100 YFT Guinea P 1 Recaptures Months at large 5 10 15 20 0 400 SKJ Guinea P 2 Recaptures Months at large 0 5 15 25 20 60 BET Guinea P 2 Recaptures Months at large 0 5 15 25 0 5 0 150 YFT Guinea P 2 Recaptures Months at large 2 4 6 8 10 0 5 0 150 SKJ Senegal P 2 Recaptures Months at large 2 4 6 8 12 0 150 300 BET Senegal P 2 Recaptures Months at large
Figure 1. Observed and predicted tag recaptures over month at large for the tag attrition model B by species (SKJ = Skipjack, BET = Bigeye, YFT = Yellowfin), tagging location (Gulf of Guinea and Senegal) and two contrasted periods of development of the Eastern Atlantic tuna fishery (Period 1 = 1980-1981, Period 2 = 1996-2002).