Publisher’s version / Version de l'éditeur:
Vous avez des questions? Nous pouvons vous aider. Pour communiquer directement avec un auteur, consultez la première page de la revue dans laquelle son article a été publié afin de trouver ses coordonnées. Si vous n’arrivez pas à les repérer, communiquez avec nous à [email protected].
Questions? Contact the NRC Publications Archive team at
[email protected]. If you wish to email the authors directly, please see the first page of the publication for their contact information.
https://publications-cnrc.canada.ca/fra/droits
L’accès à ce site Web et l’utilisation de son contenu sont assujettis aux conditions présentées dans le site LISEZ CES CONDITIONS ATTENTIVEMENT AVANT D’UTILISER CE SITE WEB.
Client Report (National Research Council of Canada. Institute for Research in Construction), 2004-02-01
READ THESE TERMS AND CONDITIONS CAREFULLY BEFORE USING THIS WEBSITE. https://nrc-publications.canada.ca/eng/copyright
NRC Publications Archive Record / Notice des Archives des publications du CNRC :
https://nrc-publications.canada.ca/eng/view/object/?id=3171aedc-5e58-4820-8c40-f19f20ab23fe https://publications-cnrc.canada.ca/fra/voir/objet/?id=3171aedc-5e58-4820-8c40-f19f20ab23fe
NRC Publications Archive
Archives des publications du CNRC
For the publisher’s version, please access the DOI link below./ Pour consulter la version de l’éditeur, utilisez le lien DOI ci-dessous.
https://doi.org/10.4224/20377194
Access and use of this website and the material on it are subject to the Terms and Conditions set forth at
MIIP report: survey on municipal infrastructure assets
MIIP Report: Survey on Municipal Infrastructure Assets
Vanier, D.J.; Rahman, S.
B-5123.2
February 2004
N a t iona l Re se a rc h Conse il na t iona l Counc il Ca na da de re c he rc he s Ca na da
Clie nt Re port
B-5123.2
Municipal Infrastructure Investment Planning (MIIP)
MIIP Report: Survey on Municipal Infrastructure Assets
for
City of Calgary
City of Edmonton
City of Hamilton
City of Ottawa
City of Prince George
Department of National Defence
Regional Municipality of Durham
Regional Municipality of Halton
Regional Municipality of Niagara
February 2004
Municipal Infrastructure Investment Planning (MIIP)
Author
D.J. Vanier, Ph.D., Project Manager
Author
S. Rahman, Ph.D., NSERC Fellow
Quality
Assurance
B. Rajani, Ph.D., P.Eng., Senior Research Officer
Approved
D.A. Taylor, Ph.D., P.Eng., Director Urban Infrastructure Rehabilitation
Report No: B-5123.2 Report Date: February 2004 Contract No: B-5123
Program: Urban Infrastructure Rehabilitation
vi + 50 pages Copy No. 1 of 15 copies
B-5123.2 i
Table of Contents
List of Tables ... iii
List of Figures... iii
Executive Summary ... v
1 Introduction ... 1
1.1 What is Actual versus Sustainable “Level of Investment” (2% to 4%) Expenditures?... 1
1.2 Determine the Extent of Asset Management Techniques in Practice Today?... 1
1.3 What is State of Canada's Existing Municipal Infrastructure Assets?... 2
1.4 Where is Canada with respect to Managing its Assets? ... 4
2 Survey Methodology... 4
2.1 Design of the Electronic Survey ... 4
2.2 Mailing List... 4
2.3 Survey Distribution... 5
2.4 Survey Data Collection ... 6
2.5 Raw Data Results... 6
3 Results... 6
3.1 What is the Actual “Level of Investment” in Municipal Infrastructure Maintenance? ... 6
3.2 What is the Status of Asset Management in Canada Today? ... 8
3.3 What is the State of Canada's Existing Municipal Infrastructure Assets? ... 12
4 Discussion ... 14
4.1 Actual “Level of Investment” ... 14
4.2 Status of Asset Management in Canada... 15
4.3 State of Canada's Existing Municipal Infrastructure Assets ... 17
4.4 Sample Group: Discussion of Canadian Municipality Population Distributions ... 18
4.5 Survey Implementation... 20
4.6 Related Administrative Support... 20
4.7 Future Work ... 20 5 Conclusions ... 21 6 Acknowledgements... 23 7 References ... 23 List of Acronyms ... 25 Appendix A ... 27 Appendix B ... 43
B-5123.2 iii
List of Tables
Table 1: What do you fix First: Highest Ranked Criteria... 11
Table 2: What do you fix First: Lower Ranked Criteria... 11
List of Figures Fig. 1: Actual and Sustainable Levels of Maintenance Expenditures ... 7
Fig. 2: Funding Shortfall Ratios (Sustainable Funding/Actual Funding) ... 7
Fig. 3: Degree of Respondent Confidence in their Survey Data... 8
Fig. 4: Number of In-house CMMS Systems ... 9
Fig. 5: Percentage of Urgent Deferred Maintenance ... 10
Fig. 6: General Perception of Infrastructure Condition ... 12
Fig. 7: Portfolio Condition States ... 13
Fig. 8: Portfolio Age Classes ... 13
Fig. 9: Actual and Sustainable “Level of Investment” by Asset Value ... 14
Fig. 10: Funding Shortfall Ratio by Response and Asset Value... 15
Fig. 11: Confidence Level about Asset Management Data ... 16
Fig. 12: Geographic Location of Survey Responses... 18
Fig. 13: Population Size Distribution for Survey Respondents ... 19
Fig. 14: Municipality Population Size Classes in Canada ... 19
B-5123.2 v
Executive Summary
The three-year Municipal Infrastructure Investment Planning (MIIP) project is investigating decision support tools for strategic asset management for Canadian municipalities.
Objective of Report: This report investigates: (1) the actual and sustainable “Level of
Investment” expenditures for maintenance of municipal infrastructure; (2) the extent of asset management in practice today, and (3) the state of Canada's municipal infrastructure assets. This report is based on a survey sent to Canadian municipalities and on an asset management framework consisting of six sequential questions whose answers determine an organization's maturity in asset management: what do you own, what is it worth, what is the deferred
maintenance, what is the condition, what is the remaining service life and what do you fix first.
Background: Numerous sources have estimated the condition or age of the existing civil
infrastructure. The same is true for extent of deferred maintenance or “maintenance gap”: • McGill researchers estimate Canada's governmental infrastructure debt as $125 billion; • the 1994 Canadian Auditor General's Report reports that National Defence has $1.7
billion in deferred maintenance on an infrastructure asset base of $17 billion; • the Federation of Canadian Municipalities (FCM) notes that in 1996 more than $44
billion was required to bring municipal infrastructure systems to an acceptable level; • the Canadian Society for Civil Engineers projects the aforementioned FCM numbers to
$57 billion in 2003 and $110 billion in 25 years;
• the National Highway System Condition and Needs Update calculates in 1997 that $17.4 billion was required to repair and modernize Canada's highways;
• the Canadian Association of University Business Officers (CAUBO) indicates that in 2000 there was $3.6 billion in deferred maintenance on an asset portfolio of $37 billion; • the City of Edmonton indicates in their 2002 infrastructure strategy report that1
: • 13% ($2.3 billion) is in poor and critical physical condition;
• 17% ($3.1 billion) is in poor and critical condition with respect to meeting demand; • 8% ($1.4 billion) is in poor and critical condition with respect to functionality, and • NRCC estimates that Canada has a civil infrastructure portfolio valued at $5.5 trillion in
1999 constant dollars and that municipal infrastructure comprises 20% of this total.
Survey Methodology: A six-page survey was distributed electronically in November 2002 to
every city, town and regional municipality or district with a population over 5000 people in Canada. There was limited distribution in the Province of Quebec. Responses were received from 67 asset managers (e.g. city engineers, public works managers). Based on the 545 original survey requests, 13% submitted responses. This report is the first of a number analyzing the results of the survey and presents only results related to the three objectives of this report.
Survey Results - Level of Investment: Respondents were unaware of suggested levels of
maintenance expenditures (Federal governments in North American recommend that industry spend annually 2% to 4% of the current replacement value of its assets on maintenance:
• 44% of respondents did not know that suggested Levels of Investment were available; • 23% were only vaguely familiar with these recommendations, and
1
These ratings and associated replacement values provide a snapshot of the magnitude of reinvestment needs in each classification category. The replacement values should not be added together to determine total reinvestment requirements – since investing in one category may resolve issues in other categories without additional investment.
B-5123.2 vi • 21% of respondents were unable to identify their actual Level of Investment. Canadian municipalities desired more maintenance funding than they currently receive:
• 77% of respondents desired the recommended 2% to 4% annual maintenance funding; • 70% were spending less than 2%;
• 9% of respondents desired at least four times as much as they currently receive; • 60% of respondents desired at least 50% more than they were currently receiving, and • 30% requested at least the same or a little more.
Survey Results - Status of Asset Management: Respondents had systems to record inventory:
• 28% of respondents did not have a system to record asset value; • 30% saved historical value of the asset;
• 58% saved the current replacement value;
• 31% of respondents were unable to provide their level of deferred maintenance, and • 27% could not identify what percentage was deemed “urgent”.
Condition-based assessment is used by half of municipalities, using techniques such as technical audits, condition objective criteria, visual inspection and operator evaluations. The primary criteria identified to determine remaining service life of assets were “age based” and “expert's knowledge”. The survey indicates that maintenance priorities were based on concerns regarding safety, condition, budget, regulations and health, in that order.
The National Guide to Sustainable Municipal Infrastructure is known to 82% of respondents and 22% were actively participating in the venture. National initiatives such as the National Water and Wastewater Benchmarking Partnership and Municipal Infrastructure Investment Planning project were recognized by 60% of respondents. Recognition of provincial initiatives (only 40%) did not extend past their borders; however, these were well known to their regional community.
Survey Results - State of Canadian Municipal Infrastructure: It is concluded that:
• Canadian municipal assets were rated as 2.9 or “good” to “fair” from a range of 7 ratings (excellent = 1, very good, good, fair, poor, very poor and failed = 7);
• the condition of the assets tended to be skewed more to the better side of the range; • 50% of the assets were at least 30 years old, and
• 25% of assets were between 20 and 30 years old: -- therefore in 10 years, without any renewal, the proportion of +30 year old assets will be 75%.
The identified contributors to the current situation included the age of assets, political inaction, expanded need for facilities, and inflation. The respondents provided examples of opportunities to meet some of this challenge including life cycle costing tools, planned preventative
maintenance, decision-support tools, long range planning and commitment to asset management.
Conclusions: In general, municipal infrastructure managers were able to provide reliable
answers to the first three asset management “whats”: what do you own, what is it worth and what is the deferred maintenance. However, regarding the last three “whats”, researchers and
practitioners should develop and standardize tools and techniques to determine asset condition, to predict remaining service life and to prioritize maintenance and capital renewal.
Many organizations ask “what is the state of Canadian municipal infrastructure?” or “What is the Gap?”. Although numbers are available from authoritative organizations, the important issue is not the amount of deferred maintenance, but rather is this amount sustainable? Perhaps, the increased funding requested by the majority of respondents is indicative of an urgent requirement to increase funding for infrastructure maintenance.
B-5123.2 1
MIIP Report: Survey on Municipal Infrastructure Assets Dana J. Vanier, Ph.D., National Research Council Canada Saidur Rahman, Ph.D., National Research Council Canada Issued: 2004-02-16
1 Introduction
Municipal Infrastructure Investment Planning (MIIP) is a three-year project investigating decision support tools for strategic asset management (www.nrc.ca/irc/uir/miip). A defined deliverable for the project is a survey and report on existing levels of maintenance within the participating organizations and within Canadian municipalities. More specifically, the survey should validate the 2% to 4% “ Level of Investment” recommended2 by some government agencies (NRC US, 1994, 1996).
This report addresses these project needs by investigating: (1) the actual and sustainable “Level of Investment” expenditures for maintenance of municipal infrastructure; (2) the extent of asset management techniques in practice today, and (3) the state of Canada's municipal infrastructure assets. This report presents the results of a survey sent to 545 municipalities across Canada and presents and discusses the responses from 67 Canadian municipal infrastructure asset managers. Included in the number were responses from the federal departments, municipalities and regional municipalities participating in the MIIP project.
The survey and this report use a proposed framework for the implementation of asset
management proposed by NRCC (Vanier, 2000, 2001). This proposed framework is a sequential series of questions that should be answered in order to determine an organization's maturity in asset management. These “six whats” are: what do you own, what is it worth, what is the deferred maintenance, what is the condition, what is the remaining service life and what do you fix first.
1.1 What is Actual versus Sustainable “Level of Investment” (2% to 4%) Expenditures?
Government and private agencies from across North America, including the National
Association of College and University Business Officers (NACUBO, 1990), National Research Council of the USA (NRC US, 1994, 1996) and the Civil Engineering Research Foundation (CERF, 1996) recommend that 2% to 4% of the current replacement value of assets should be expended each year for maintenance operations. CERF (1996) validated these numbers eight years ago; the results indicated that many organizations spend considerably less than the
recommended levels. This report attempts to determine what is the actual “Level of Investment” as opposed to sustainable “Level of Investment” in Canadian municipalities.
1.2 Determine the Extent of Asset Management Techniques in Practice Today?
Asset management is seen, correctly or incorrectly, as a panacea or universal remedy for many of the current municipal infrastructure problems such as rapidly deteriorating assets, high levels of deferred maintenance and aging civil infrastructure. There are currently few reliable numbers available to predict accurately the extent of these “civil infrastructure” problems.
2
"Level of Investment" is defined as that percentage of the current replacement value or CRV spent on maintenance, annually. The term is used synonymously with "Level of Maintenance" in this report.
B-5123.2 2
Asset managers face a constant challenge of allocating resources between investment in new assets and the ongoing maintenance and renewal of existing assets. Asset managers need
considerable data regarding the expected service life of any particular asset and the time at which maintenance is required.
The International Infrastructure Management Manual (IIMM, 2000) describes asset management as:
the combination of management, financial, economic, engineering and other practices applied to physical assets with the objective of providing the required level of service in the most cost-effective manner.
Asset management is therefore being able to exercise strategic maintenance and renewal procedures within an organization. The challenging part of asset management is to address equally the concerns of the technical, financial, administrative and political facets of an organization while providing an acceptable “level of service” to its clients.
This report attempts to identify the extent of asset management in Canadian municipalities and the extent of knowledge about this domain in the professional community.
1.3 What is State of Canada's Existing Municipal Infrastructure Assets?
Municipal infrastructure includes those assets managed by municipalities and these typically include: buried utilities, roads, transit systems, bridges, treatment plants, and parks. Some jurisdictions are also responsible for a variety of building types (i.e. office buildings, police stations, fire halls, indoor swimming pools, arenas and community centres) but their
responsibility could also extend to other types of buildings such as social housing, schools and vehicle maintenance depots.
Numbers are available from numerous sources for the condition and age of existing civil infrastructure. The same holds true for the amount or extent of deferred maintenance:
• In a recent report, Mirza and Haider (2003) estimated the “total public infrastructure debt of all governments in Canada” as $125 billion.
• In their 1994 annual report, the Office of the Auditor General of Canada indicated that the Department of National Defence aging infrastructure has approximately $1.7 billion in maintenance expenditures that have been deferred on an asset base of $17 billion (OAG, 1994).
• A recent brochure sponsored by the Canadian Society for Civil Engineers (CSCE, 2003a) tagged the current municipal infrastructure maintenance debt at $57 billion in 2003 and potentially $110 billion in 25 years.
• A study report of the Federation of Canadian Municipalities (FCM, 1996) noted that more than $44 billion is required to bring municipal infrastructure systems to an
acceptable level. Many projections as to the current amount of deferred maintenance have been made based on this seminal document (CSCE, 2003, 2003a).
• The National Highway System Condition and Needs Update (NHSCNU, 1997) calculated that the resources required to repair, upgrade and modernize the national highway system was approximately $17.4 billion.
B-5123.2 3
• The Canadian Association of University Business Officers (CAUBO, 2000) indicated that there is $3.6 billion in deferred maintenance on an asset portfolio of $37 billion. These numbers apply only to Canada's university assets, which represent a small sector of civil infrastructure.
More detailed information is available from a number of municipalities (CWF, 2003; Edmonton, 2002). For example the City of Edmonton published a report showing the overall status of its infrastructure using a ranking system that provided a strategic perspective of the state and distribution of its infrastructure3:
• 13% ($2.3 billion) was in poor and critical physical condition;
• 17% ($3.1 billion) was in poor and critical condition with respect to meeting demand/capacity, and
• 8% ($1.4 billion) was in poor and critical condition with respect to functionality. Edmonton identified an infrastructure gap — the difference between the projected cost of infrastructure projects and the capital financing available. The 2002 update report indicates that the infrastructure gap was widening and that there was insufficient funding for rehabilitation of existing infrastructure and for building new infrastructure to support growth. The City’s 10-year infrastructure gap totalled approximately $3.2 billion. Roughly 40% ($1.3 billion) of this gap is comprised of projects required to rehabilitate existing infrastructure.
Vanier (2000) estimated that Canada has a civil infrastructure portfolio valued at $5.5 trillion (in 1999 constant dollars). This number included all commercial, governmental, residential and industrial facilities and was based on the accumulated new construction since 1960, obtained from numerous Statistic Canada (1994) reports. It also estimated that municipal infrastructure in Canada accounted for approximately 20% of the $5.5 trillion or $1.1 trillion.
The Civil Infrastructure Systems (CIS) Technology Road Map (CSCE, 2003) initiative con-sponsored by CSCE, Canadian Council of Professional Engineers (CCPE), Canadian Public Works Association (CPWA) and NRCC was recently completed (CSCE 2003a). Its objectives were:
• Promote and build support for ongoing long-term “Holistic Investment Approach” in innovative technologies to renew and enhance Canada's infrastructure.
• Adopt the CIS Technology Road Map as a blueprint for the renewal and enhancement of Canada’s infrastructure.
• Develop a national shared vision between the partners.
• Introduce a realistic and exhaustive analysis of the situation. Avoid creating an academic exercise. This analysis will be driven by industry’s needs.
3
These ratings and associated replacement values provide a snapshot of the magnitude of reinvestment needs in each classification category. The replacement values should not, however, be added together to determine total reinvestment requirements – since investing in one category may resolve issues in the other categories without additional investment.
B-5123.2 4
1.4 Where is Canada with respect to Managing its Assets?
As can be seen, there is little consensus on numbers related to asset management and none of these numbers address the three objectives of this report: (1) the actual and sustainable “Level of Investment” expenditures for maintenance of municipal infrastructure; (2) the extent of asset management techniques in practice today, and (3) the state of Canada's existing municipal infrastructure assets. The authors of this report attempt to provide new insights into Canada's municipal infrastructure assets.
This report is divided into the following sections: Section 2 describes the complete survey methodology, Section 3 presents survey results related to the three objectives of the report, Section 4 discusses these results, and Section 5 presents the report conclusions. An executive summary precedes and the acknowledgements and references follow the main body of the report. Appendices A and B contain the raw data responses and a blank survey form, respectively.
2 Survey Methodology
This section describes in detail the design of the electronic survey, the development of the survey mailing list, the distribution and monitoring of the survey and the collection of survey data.
2.1 Design of the Electronic Survey
In order to encourage participation, to minimize management and to reduce distribution and reply costs, it was decided to distribute the survey and collect the responses completely
electronically. Alternative methods were also made available to the user to complete the survey manually and to mail or fax the responses.
A number of alternatives protocols were available to distribute surveys such as HTML (HyperText Markup Language), Microsoft's Word Forms, Adobe's PDF (Portable Document Format), survey-specific software and professional services.
A mandatory criteria established by the research team was that the printed survey must appear identical to the electronic form, thereby allowing respondents the option of completing the survey either electronically or manually.
HTML was eliminated as a candidate protocol because it could not meet the mandatory criteria. MSWord was eliminated as it required the respondents to have MSWord. The last two
alternatives, survey software and professional services, were found to be cost-prohibitive. Adobe's PDF format was selected as its Adobe Reader is freely available, it functions as a plug-in for most commercial browsers, and plug-in-house expertise was available to implement the survey design.
2.2 Mailing List
Although email is prevalent in most professional communities and within Canadian municipalities, it is difficult to obtain reliable email address for Canadian municipalities: individuals move within organizations, they transfer to different organizations, organizations change, organizations merge or splinter and email address protocols change within organizations. The final mailing list was a combination of Scott's Canadian Municipal Directory
(www.scottsinfo.com), the Institute for Research in Construction's Construction Innovation Mailing List (irc.nrc-cnrc.gc.ca), and an assortment of smaller data sets received from staff from the National Guide to Sustainable Municipal Infrastructure (www.infraguide.ca) and colleagues.
B-5123.2 5
Attempts were made to ensure that multiple email addresses for the same person were eliminated and that the survey was distributed to the person at the municipality dealing with asset
management; typically, the survey was directed to the manager of asset management, commissioner of public works, city engineer, or municipal engineer. On some occasions, in smaller municipalities, the survey was sent to the chief administrative officer after it was found that an appropriate email addresses could not be located on the municipal web site. A limited number of phone calls were made to verify information.
The distribution of the survey did not target only cities, towns and villages as there is a great variety of definitions across the 10 provinces and three territories as to what constitutes a city, county, regional municipality or regional district (Statistics Canada, 2003). In fact, responses were also received from school boards, consultants and federal departments. These answers were included in the results only for those questions where it is deemed appropriate to have these contributions.
An email tracking system was developed in Microsoft Access to record requests sent, to eliminate duplicate requests, to facilitate follow-up requests and to log survey responses. Although the survey was prepared well over 12 months prior to the actual delivery date in late Fall, 2002, its release was postponed owing to the number of other municipal infrastructure surveys and “Best Practice Scans” (www.infraguide.gc.ca/docs/info-bestpractice.pdf) that were being carried out at that time.
2.3 Survey Distribution
Once the database was finalized, emails were sent out sequentially from the largest
municipalities to the smallest communities. They were sent out on a number of successive days to ensure that in house staff could respond quickly to emails that bounced back (postmaster errors, incorrect email address, etc.) and to address inquiries from the respondents
It was decided not to contact municipalities with populations of less than 5000 people, as this is not a target segment of the MIIP project, because these municipalities form a small percentage of the total Canadian population and because email addresses are increasing more difficult to obtain as the size of the population of the municipality decreases. However, all responses received were included in the results.
There was no mass mailing to Quebec municipalities as there were insufficient project funds to translate the survey, the associated documentation and the software interface into French. Surveys were only sent to those Quebec municipalities where the respondents accepted a priori to complete the survey in English.
The survey was distributed, starting in early November 2002, to 545 Canadian municipalities accompanied by a request to complete the survey before 16 December 2002. This implies that the survey was sent to every city, town, and regional or municipal district with a population over 5000 people in Canada, outside of the Province of Quebec.
As an afterthought, the survey was also forwarded to the Canadian Public Works list server ([email protected]). Although they were roughly 650 subscribers of this list server at the time of distribution, few survey responses were generated using this distribution method. As compensation for completing the survey all respondents were promised a copy of the results of the survey. The municipalities were promised anonymity in the publication of survey results.
B-5123.2 6
2.4 Survey Data Collection
The PDF format selected for the survey distribution permitted the respondents to fill out the survey line or by hand on the printed version. The large majority completed the survey on-line with only a few individuals faxing their returns. Most respondents filled out the form entirely and few incomplete forms were received.
The Adobe's PDF format, and the associated Forms Data Format or FDF, is a human-readable protocol that permits the sparse transmission of data to and from the respondents. For example, although a blank PDF survey file is 941Kbytes and a six page document with numerous text fields, radio buttons and check boxes, a completed FDF file is only 8Kbytes.
Those submitting the survey electronically receive a “Thank you” message when the server successfully receives the incoming data. A message containing the FDF response is
automatically emailed (to ensure backup) to a host email address. The FDF attachment is then imported into the final Microsoft Access survey database.
All survey responses were accepted as individual surveys regardless of the originating location; however, efforts were made to coordinate responses from different individuals (or different groups) in the same organization. In cases where multiple responses were received from the same municipality, their populations were not multiplied for the final population tally. In
addition, because some municipal borders are crossed by regional municipality borders and visa
versa in Ontario and British Columbia, in this limited number of cases these populations were
treated as separate entities.
Responses were received from 67 asset managers. Based on the 545 original survey requests (and not including the Canadian Public Works list server mentioned earlier), 13% of these submitted responses.
Unless otherwise indicated all results discussed in this report were based on the total number of respondents who participated in the survey, typically 67 respondents. As some asset management consultants responded to the survey, their answers were only included in survey results when they were deemed appropriate.
2.5 Raw Data Results
The survey (raw data) results are shown in Appendix A. The survey is divided into 63 questions, not all of which are addressed in this report. The questions fall into six areas; each one deals with specific aspects of a proposed asset management implementation strategy (Vanier, 2001) called the “six whats”: what do you own, what is it worth, what is the deferred maintenance, what is the condition, what is the remaining service life and what do you fix first.
3 Results
This report presents a “first pass” at analyzing the results of the survey and presents only those results related to the three original objectives of the report. Other papers will be published in the future based on detailed analysis of these data.
3.1 What is the Actual “Level of Investment” in Municipal Infrastructure Maintenance?
Question 26 (Q26) asked specifically if the respondents were “aware of any suggested levels of maintenance expenditures from government agencies”:
B-5123.2 7 • 15 respondents (23%) were vaguely familiar with these recommendations;
• 22 respondents (33%) were aware of recommendations; only eight of these provided a recommended figure when queried, and
• seven of eight correctly identified 2% to 4%, the last respondent was slightly lower. Q31 and Q32 in the survey (see Appendices A and B) queried the respondents about their actual “Level of Investment” and what was a sustainable “Level of Investment”, respectively. Figure 1 juxtaposes the “actual” and “sustainable” responses from the survey. An interesting observation is that there were 14 respondents (21%) unable to identify their actual “Level of Investment”.
0% 10% 20% 30% <0.5% <1.0% <1.5% <2.0% <2.5% <3.0% <4.0% >4.0% No Res ponse Unknown Response Percentage
Actual Level of Investment Desired Level of Investment
Fig. 1: Actual and Sustainable Levels of Maintenance Expenditures
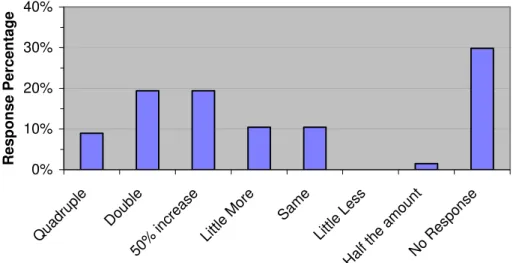
Figure 2 illustrates funding shortfall ratios. The X-axis alternatives are calculated by dividing all respondents’ desired “sustainable” funding by their “actual” responses. For example, in Figure 2 “quadruple” means the respondent desired funding is 4% and he/she received 1%, or the
respondent desired 2% but received 0.5%. The high number of “No Response” is attributed to respondents who did not enter an “actual” and/or “sustainable” amount.
0% 10% 20% 30% 40% Quadr uple Doub le 50% inc reas e Littl e Mo re Same Little Less Half the amoun t No Response Response Percentage
B-5123.2 8
3.2 What is the Status of Asset Management in Canada Today?
In order to address this subsection on the status of asset management in Canada, the results are further divided into the “Six Whats” described earlier.
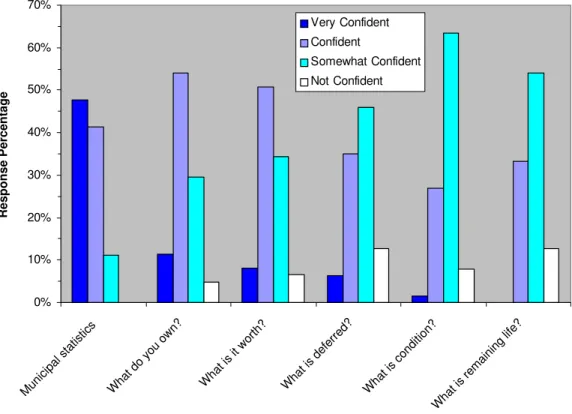
What do you own?: A series of questions (Q10, Q18, Q25, Q34, Q39 and Q44) related to the
respondents' confidence level regarding answers provided in the survey. The original intention of these questions was to validate whether or not the data provided by each respondent for each section of the survey could be used as an accurate prediction for analysis. However, a correlation amongst the answers to these questions for the different sections in the survey was observed. For example in Q10, there were 30 respondents indicating they were “very confident” about their answers about municipal statistics, whereas no one is “not confident”. On the other hand, no one is “very confident” about their answers for the section on “what is the remaining service life” and the majority (63%) is either “somewhat confident” (51%) or “not confident” (12%). The
histogram in Figure 3 generally indicates that “very confident” responses fall off quickly from left to right but the “somewhat confident” and “not confident” responses increase from left to right. 0% 10% 20% 30% 40% 50% 60% 70% Munic ipal stati stics Wha t do y ou own ? Wha t is it wor th? What is de ferre d? Wha t is co ndit ion? What is remainin g life? Response Percentage Very Confident Confident Somewhat Confident Not Confident
Fig. 3: Degree of Respondent Confidence in their Survey Data
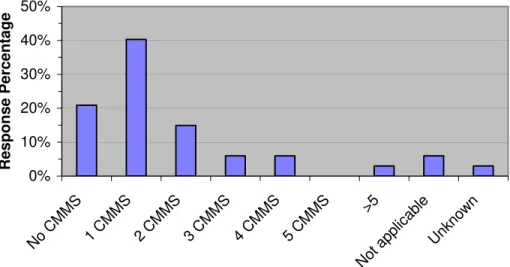
Figure 4 presents the responses to Q19 regarding using computerized maintenance management systems (CMMS) in the organization: 14 respondents (21%) did not use CMMS. The majority of these respondents were from municipalities with population of less than 10,000 people. Figure 4 also indicates that many organizations (30%) had a number of CMMS implementations in their organizations; two organizations had more than 5 CMMSs. Q21 supplemented the former
B-5123.2 9
said “yes” and 49% said “no”. In addition, four (4) out of the 14 municipalities not currently using CMMS were planning to purchase a system.
0% 10% 20% 30% 40% 50% No CMM S 1 C MM S 2 CM MS 3 CM MS 4 CM MS 5 C MM S >5 Not a pplicab le Unkn own Response Percentage
Fig. 4: Number of In-house CMMS Systems
What is it worth?: Q22 asked the respondents “do you have a system to record the value of your
asset portfolio”. A total of 19 responded (28%) that they did not have a system to record these data. Q23 asked what type of data was recorded, 20 (30%) respondents indicated that they save the historical value of the asset and an additional 39 record (58%) the current replacement value. Q24 asked what is the total value of the portfolio under their supervision and 10 (17%) of the municipal respondents were not able to provide this figure.
What is deferred?: Deferred maintenance is defined as the cost of maintenance (and not capital
renewal) to bring the asset to its original potential that has been postponed or phased for future action. This term is synonymous with maintenance backlog. Q28 asked if the respondents were familiar with the term Facility Condition Index (FCI); a term that has been used by government agencies for the past 15 years and represents the amount of deferred maintenance for an asset in proportion to asset's current replacement value. A total of 28 respondents (42%) were not familiar with the FCI term.
Q29 asked the respondents to estimate the amount of deferred maintenance under their
supervision. A total of 21 respondents (31%) were unable to provide this number when provided with a limited number of responses including: <$100,000, < $500,000, … , <$8 Million, >$8 Million.
Figure 5 presents the answers to Q30 regarding the amount of deferred maintenance that was identified as “urgent” (operational priority, code compliance, safety) by the respondents. A total of 18 respondents (27%) could not identify which percentage was urgent deferred maintenance.
B-5123.2 10 0% 10% 20% 30% <10 % <20% <30% <40% <50% >50% Not Ap plicab le Unknow n No Respo nse Response Percentage
Fig. 5: Percentage of Urgent Deferred Maintenance
Q33 asked if the respondents have an in-house system to record the amount of deferred maintenance. The total of 30 respondents (45%) did not have a system in place and the
remainder of respondents utilized either CMMS (7), corporate databases (5), spreadsheets (12), manual systems (5), or other recording methods (7) such as pavement management systems (4) to record their deferred maintenance.
What is the condition?: Q35 provides an overall view of the status of condition assessment in the
organizations: “Besides … FCI … do you have an objective, repeatable method in use today to establish the current performance level”. A total of 24 respondents (36%) indicated that they did not have a system, whereas 27 respondents (40%) indicated that they utilized more than one system.
Q36 attempted to classify the type of system used to determine asset condition or performance: “primary methods for evaluating your assets' performance”. “Visual inspections” (43) and “operator evaluations” (29) were utilized by respondents in the study group. An additional 24 respondents used a “technical audit” and 32 respondents used “condition objective criteria”.
What is remaining service life?: Q40 asked about the “primary criteria for evaluation your assets'
remaining service life”. The primary criteria identified were “age based” and “expert's knowledge” with 43 and 31 responses, respectively. Other significant criteria included non-destructive testing (12) and service life tables (11).
Q41 and Q42 asked about the respondents' knowledge of national and international standards in the domain of service life prediction. The identified standards included ISO (International Organization for Standardization), ASTM (American Society for Testing and Materials), CIB (International Council for Research and Innovation in Building and Construction), CSA
(Canadian Standards Association) and HAPM (Housing Association Property Mutual). A total of 35 respondents (52%) were not aware of these standards and an additional 13 (19%) were
vaguely aware of standards in the field. Only one individual indicated participation on related standards activities and that individual is a consultant working in the asset management field.
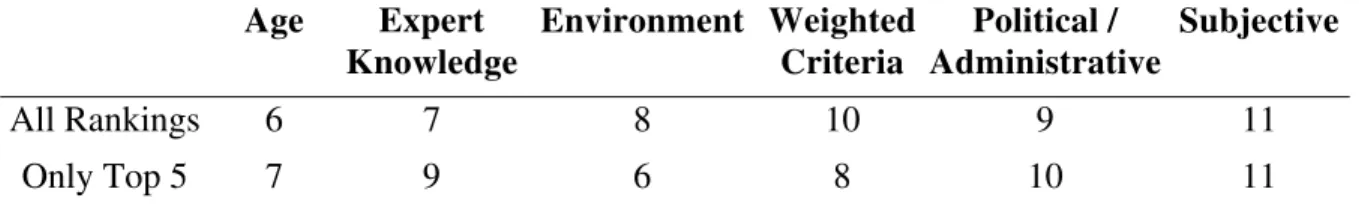
What do you fix first?: Q46 asked the respondents to describe their “primary criteria for
evaluating your maintenance priorities”. The respondents were asked to rank the 11 options (Regulatory, Budgetary, Safety, Health, etc.) in order of priority. Although the large majority
B-5123.2 11
ranked each of the 11 options presented, a small number only ranked the highest priorities and a number gave the same ranking to a number of options. Weights of 1 to 11 are assigned to each of the options and the results are presented as Tables 1 and 2. The ranking based on the sum of all the weights is shown on the first rows of Tables 1 and 2. The second rows of Tables 1 and 2 present the rankings if only the five choices from each respondent were summed. The rankings of the top five (5) options (Table 1) were not affected by either calculation, but there were minor reversals of order in the other six (6) options, as shown in the second row of Table 2.
Table 1: What do you fix First: Highest Ranked Criteria
Safety Condition Budgetary Regulatory Health
All Rankings 1 2 3 4 5
Only Top 5 1 2 3 4 5
Table 2: What do you fix First: Lower Ranked Criteria
Age Expert Knowledge Environment Weighted Criteria Political / Administrative Subjective All Rankings 6 7 8 10 9 11 Only Top 5 7 9 6 8 10 11
Additional asset management questions: Q49 through Q55 asked the respondents about their
personal familiarity of national and provincial initiatives related to strategic asset management in Canada.
The National Guide to Sustainable Municipal Infrastructure is the most well known of the activities with only 12 respondents (18%) indicating they were not aware of it. A total of 15 respondents (22%) were actively participating on Guide activities.
National activities such as the National Water and Wastewater Benchmarking Partnership (Q50) and Municipal Infrastructure Investment Planning Project (Q51) were familiar to approximately 60% of respondents. Provincial activities were lesser known to the study group as only 40% of all respondents were familiar with the specified provincial initiatives. However, all the Alberta respondents were familiar with the Alberta's Municipal Infrastructure Management System (Q52) and at least, three-quarters of Ontario respondents were familiar with their provincial initiatives (Q53, Q54 and Q55).
Q58 asked the respondents of innovative work in a specific or general discipline in their organization. Many respondents identified pavement management systems (12), water main, storm and sewer management (8), asset management (7), infrastructure management systems (5) and CCTV inspections (3) as “Best Practices” in the field. Q59 asked if the respondents were aware of activities in other municipalities: 66% indicated that they were not.
Comments from respondents: Q61 and Q63 asked the respondents if they had any comments
about the survey. A large portion of respondents provided information that can be interpreted as comments about the status of asset management in Canada. For example, many had positive comments about the survey and how they “will use the survey to begin the process of collecting
B-5123.2 12
asset data” and that it provides “insight on how much more we need to do with regard to maintenance management”. Q61 asked if they wished to participate in a follow-up survey; a large number of respondents (60%) volunteered to participate but many indicated the condition that it not incur much time. Some also indicated that they had no additional information to offer.
3.3 What is the State of Canada's Existing Municipal Infrastructure Assets?
A number of questions in the survey related to the state of Canada's infrastructure. The responses to these questions are not addressed in the order that they are sequenced in the survey.
Two types of results are presented in the figures to follow: (1) “by response” represents answers from the individuals who completed the survey, and (2) “by asset value” means that the answers provided are weighted by the value of the portfolio identified in Q24. Answers “by response” therefore equate all asset managers, meaning a small municipality answer is equal to that of a large municipality: this is important for questions where the answers from individuals are required, such as “Level of Investment”. In some instances, it is important to relate the answers to the value of the municipal infrastructure such as with infrastructure condition in Q37. In other instances it is necessary to compare the “by response” results to the “by asset value” in order to determine if the results are typical of large or small municipalities: that is, if a higher percentage “by asset value” is observed (see Figure 8 for assets in the oldest three age classes) this means that the data are skewed because of larger municipalities (i.e. greater portfolio values).
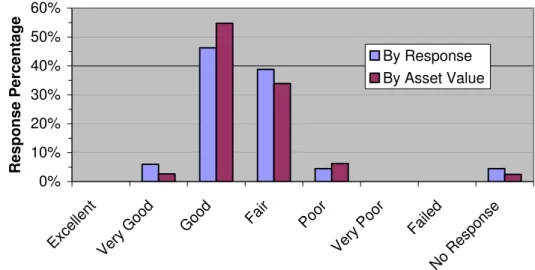
Q37 asked: “what is your general perception of the physical condition of your infrastructure portfolio?”. Figure 6 compares the responses from the study group “by response” to “by asset value” pro-rated to the respondents' asset value obtained in Q24 (What is the value of the asset portfolio under your supervision). Figure 6 provides a condition “snapshot”.
0% 10% 20% 30% 40% 50% 60% Excell ent Very Goo d Goo d Fair Poor Very Po or Fail ed No Re spon se Response Percentage By Response By Asset Value
Fig. 6: General Perception of Infrastructure Condition
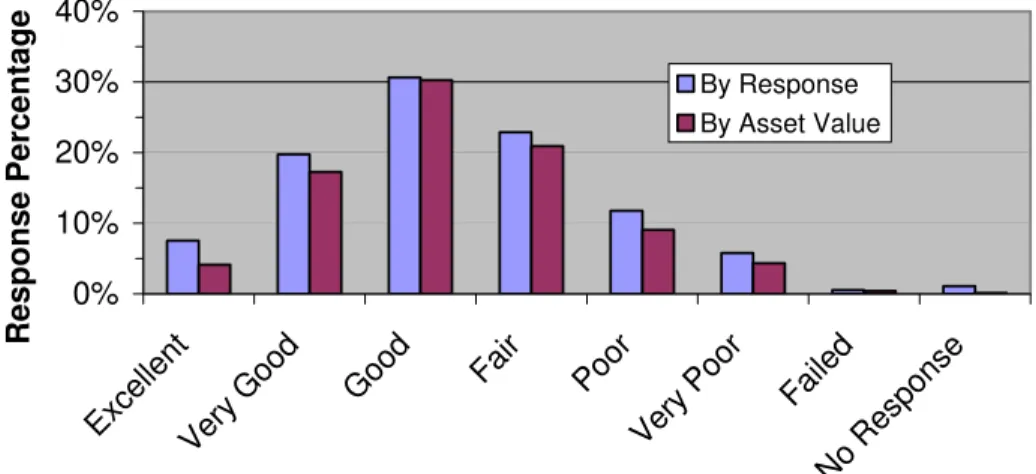
Q38 sub-classified the percentage of infrastructure as condition states of excellent, very good, good, fair, poor, very poor and failed. Figure 7 presents condition states from the study group “by response” as well as pro-rated “by asset value”. There are 60 complete responses to Q38.
B-5123.2 13 0% 10% 20% 30% 40% ExcellentVery G ood Good Fa ir Poor Very Poor Failed No Respon se Response Percentage By Response By Asset Value
Fig. 7: Portfolio Condition States
Q43 requested the percentage of the respondents' infrastructure portfolio in the age classes listed in Figure 8. This figure presents the responses from the study group “by response” as well as pro-rated “by asset value”.
0% 10% 20% 30% 40% New < 1 0 Ye ars < 2 0 Ye ars < 3 0 Ye ars < 50 year s < 7 5 Ye ars >75 Y ear s Response Percentage By Response By Asset Value
Fig. 8: Portfolio Age Classes
Q56 and Q57 asked “what factors contributed to the increase of your deferred maintenance” and “which opportunities can improve your current situation”, respectively. Respondents could select multiple criteria. Many respondents (numbers in parentheses indicate the number of individual responses to that specific category) attributed the current situation of high levels of deferred maintenance to:
• aging of assets (45);
• increased number of assets (41); • political inaction (22);
• expanded need for facilities (17), and • inflation (15).
B-5123.2 14 Opportunities that could improve the current situation included:
• adequate funding for maintenance (51); • life cycle costing methods (50);
• planned preventative maintenance (46);
• strategic decision support tools (46), long range planning (40), and • political/administrative commitment to asset management (39).
4 Discussion
4.1 Actual “Level of Investment”
Q26 responses indicated that approximately half (44%) of the sample group were not familiar with recommended maintenance levels of 2% to 4% of current replacement value. This is surprisingly high as many of these reports (NACUBO, 1990; NRC US, 1994, 1996; CERF, 1996) were published over 15 years ago. However, it is difficult to calculate the “Level of
Investment” as it requires the organization to know both their deferred maintenance (e.g. difficult for buried utilities) and their portfolio value (few using comprehensive methods to collect data). Figure 1 indicates that Canadian municipalities wish to spend more on maintenance than they were currently receiving. In fact, although 77% of those surveyed (by number of responses) desired the recommended 2% to 4% “Level of Investment”, 70% were spending less than 2%. Averaging the “Level of Investment” from Figure 1 is not scientifically sound, but it does indicate that the actual “Level of Investment” is approximately 1.7% and the desired sustainable level is roughly 2.6%. 0% 10% 20% 30% 40% <0.5%<1.0%<1.5%<2.0%<2.5%<3.0%<4.0% >4.0% No Re spo nse Response Percentage
Actual Level of Investment Desired Level of Investment
B-5123.2 15
Figure 9 displays the actual and sustainable “Level of Investment” by asset value and shows that municipalities with higher asset values had lower “Levels of Investment”. When the “Level of Investment” is calculated based on asset values the “actual” average is 1.4% and the
“sustainable” is 2.3%.
Figure 2 confirms that in some instances (10%) the respondents required funds at least four times as much as they currently receive and therefore these municipalities appear to be under-funded. Figures 2 and 9 clearly indicate that the majority of Canadian asset managers wanted at least the same, and in many instances, considerably more money for maintenance than they are currently receiving. Figure 10 provides an additional dimension to Figures 2 and 9 by relating the
“sustainable” to “actual” ratio to the asset values; it appears that owners of the majority of the asset base in Canada required more investment in the maintenance of their portfolios. Analysis of these data “by asset value” show that 60% of responses desired at least 50% more than they were currently receiving (quadruple-13%, double-24%, 50% more-23%).
0% 5% 10% 15% 20% 25% 30% 35% Qua drup le Dou ble 50% increa se Little Mor e Same Littl e L ess Half the am oun t No Resp onse Response Pecentage By Response By Asset Value
Fig. 10: Funding Shortfall Ratio by Response and Asset Value
The high number of “No Responses” reflected those individual who did not indicate (or know): (1) their asset value, (2) their actual “Level of Investment”, or (3) a sustainable “Level of
Investment”. In fact, comparing the “By Response” to the “By Asset Value” results in Figure 10 for the “No Response” indicates that many smaller municipalities were not able to supply these data.
4.2 Status of Asset Management in Canada
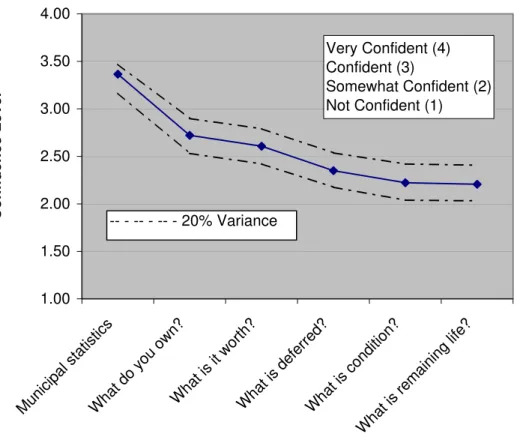
Figure 3 indicates that the participating municipalities had more confidence about their knowledge about what they own than their assets’ remaining service life. In order to create a single “Confidence Level” for these discrete responses, weighting values are assigned linearly between 4 for “Very Confident” and 1 for “Not Confident” and summed for all responses and averaged for the group. A variance envelope of +/- 20% is also calculated and displayed in Figure 11 to symbolize the variation in the respondents' answers if they had provided a 20% higher or lower value than originally selected. Figure 11 plots the respondents' confidence in their knowledge of specific asset management areas. Clearly, the participant's confidence in the first 3 items dropped off quickly, whereas levels of confidence for the final three remained both constant and lower than the first three.
B-5123.2 16 Very Confident (4) Confident (3) Somewhat Confident (2) Not Confident (1) 1.00 1.50 2.00 2.50 3.00 3.50 4.00 Munic ipal s tatis tics Wh at do you own? Wh at is it wo rth? Wh at is def erred? Wh at is c ondit ion? What is re main ing life?
Confidence Level -- - -- - -- - 20% Variance
Fig. 11: Confidence Level about Asset Management Data
Although most municipalities provided data on their inventory (what do you own) and the
majority do (77%) had CMMS to record asset data, Q22 identifies that 19 municipalities (33% of the municipal responses) did not have a system to record “what is it worth”. However, responses to Q24 indicated that only 17% of respondents were not able to estimate the value of their assets. Most Canadian municipalities had systems to record both their inventory and its value.
Deferred maintenance, however, is another issue: half the respondents were not familiar with the term FCI; 21 respondents were not able to identify the extent of their deferred maintenance, and 18 (27%) could not identify what percentage was deemed “urgent”. It could be said that
approximately one-third of the Canadian respondents were not able to itemize the extent of their deferred maintenance.
Condition-based assessment was used by approximately half of Canadian municipalities. The numbers in parentheses following represent the numbers of respondents choosing that option. Although 36% of respondents did not have a system at all, many used technical audits (24) and condition objective criteria (43). On the negative side, roughly the same number relied on subjective criteria such as visual inspection (43) and operator evaluations (29).
Answers to questions about the remaining service life indicated that many decisions were made on criteria such as age or expert opinion. In addition, a total of 35 respondents (52%) were unaware of any standards work in this domain (ISO, CSA, etc.).
Tables 1 and 2 (Q46) indicate that maintenance priorities were made based on concerns regarding safety, condition, budget, regulations and health, in that order. However, few
B-5123.2 17
respondents indicated that sophisticated techniques such as multi-objective optimization or weighting criteria were employed to assist in setting these maintenance priorities.
Regarding the status of knowledge in the asset management field, the National Guide to
Sustainable Municipal Infrastructure was known to the majority (82%) of respondents and that a
large proportion (22%) were actively participating. Hopefully, a large percentage of these respondents were also reading the Guide Best Practices (Guide, 2003) and were implementing these practices in their municipalities. National initiatives such as the National Water and
Wastewater Benchmarking Partnership and Municipal Infrastructure Investment Planning Project were recognized by approximately 60% of respondents. Recognition of provincial initiatives (only 40%) did not extend past their borders; however, these were well known to that regional community (minimum 75%). Although few respondents could identify “in-house” best practices in other municipalities, many indicated there is in-house innovative work such as pavement management systems and infrastructure management in their organizations.
4.3 State of Canada's Existing Municipal Infrastructure Assets
This survey received data from a wide selection of respondents and from a wide selection of asset managers. In most cases, senior staff members of the municipality forwarded the responses but these individuals may be answering the survey with respect to one technical discipline (i.e. water/wastewater, roads) or they may be attempting to represent a general flavour of the state of their entire infrastructure. As a result, the results presented in this report should be evaluated accordingly.
Judging by the condition data presented in Figures 6 and 7, and the age data presented in Figure 8, it can be concluded in general that the majority of Canadian municipal assets were in “good” to “fair” condition. As evidenced by Figures 6 and 7, the condition of the assets tended to be skewed more to the better side of the range. Regarding asset age, over 50% of the assets were at least 30 years old. However, an additional 25% of the assets were between 20 and 30 years old: in 10 years (without renewal) these will bring the proportion of +30 year assets to a significant 75%. The main contributors to the current situation identified by the respondents included the age of assets, political inaction, expanded need for facilities, and inflation.
There was a very large discrepancy between the actual and desired sustainable “Level of Investment”. Some 60% of respondents indicated that they required as much as a 50% increase in funding levels, doubling of funding or even quadrupling of their existing budgets. Clearly, more maintenance funds were required to cover this discrepancy; however, the respondents provided other examples of opportunities to meet some of this challenge including life cycle costing tools, planned preventative maintenance, decision-support tools, long range planning and commitment to asset management techniques.
Any asset portfolio includes a full distribution of different asset conditions or asset ages. Not every asset in every portfolio can be in excellent condition, be performing optimally or be brand new because infrastructure budgets were not sufficient, assets deteriorate, and systems fail prematurely. Figures 6, 7 and 8 provide a view of this distribution for the condition/age of assets in Canada. Using the weighting criteria described earlier (excellent =1 and failed = 7) then the average condition (Q38) of Canadian assets is estimated as 2.9 or good. This report card rating should be used cautiously because it is only a slice of the current situation and may be a reflection of a decreasing trend because of the aging infrastructure.
B-5123.2 18
In general, municipal infrastructure managers need to know more about asset management and are able to provide reliable answers to the first three “whats” identified in Section 1: what do you own, what is it worth and what is the deferred maintenance. Efforts should be made at a national level to ensure that municipalities can benchmark themselves against some national norm. Regarding the last three “whats”: researchers and practitioners should endeavour to develop and standardize tools and techniques to determine asset condition, to predict remaining service life and to prioritize both maintenance management and capital renewal.
4.4 Sample Group: Discussion of Canadian Municipality Population Distributions
As mentioned earlier, the survey was not sent to the majority of municipalities in Quebec or to those Canadian municipalities having a population less than 5000 people. In spite of this, all of Canada is well represented geographically in this survey, as shown in Figure 12.
Fig. 12: Geographic Location of Survey Responses
Figure 13 gives an indication of the population breakdown from the survey. If the populations of all the participating municipalities are summed, the survey represents a population base of 10.3 million people. The population classes (<5,000 …<100,000 … etc.) selected were based on the distribution of Canadian municipalities obtained from Scott's Directory of Canadian
Municipalities (Scott's, 2003). The class breakdown was selected primarily for Q3 (What is the number people living or working in your asset portfolio) to provide good representation in each class and to emulate existing municipal classes in Canada (village: small large, town: small medium large, city: small medium large, megacity).
B-5123.2 19 0 2 4 6 8 10 12 14 16 18 20 <1,00 0 <5,000 <10,0 00 <50,0 00 <100,00 0 <500 ,000 <1,000,000>1,0 00,0 00 No Res ponse Not Appl icab le Responses
Fig. 13: Population Size Distribution for Survey Respondents
The number of municipalities in Canada is displayed in Figure 14 for the nine population size classes (Scott's, 2003). Alternatively, Figure 15 shows the percentage of Canada’s population in these nine classes. As can be seen in Figure 15, Canada is truly an urban society with over 90% of its population living in towns or cities larger than 5,000 and over 50% of the population living in cities (63) greater than 100,000. On the other hand, Figure 14 shows that we have over 3,500 municipal, county or regional organizations managing assets in Canada. Although it cannot be confirmed rigorously, the responses received and displayed in Figure 13 provide a good representation of the makeup of Canadian municipalities as shown in Figures 14 and 15. The population numbers provided by the respondents reflect those populations from Statistics Canada (2003) for the 2001 Canadian Census.
1016 760 1133 270 278 66 50 10 3 1 10 100 1000 10000 <500 <1,000 <5,000 <10,00 0 <50 ,000 <10 0,0 00 <50 0,0 00 <1, 000 ,000 >1, 000 ,000 Number of Villages/Town/Cities
B-5123.2 20 0% 10% 20% 30% <500 <1,0 00 <5,0 00 <10,00 0 <50,00 0 <100, 000 <500, 000 <1,0 00,0 00 >1,0 00,000 Percentage of Population
Fig. 15: Canadian Municipality Population Distribution
4.5 Survey Implementation
A survey conducted electronically has a number of advantages over surveys done manually or even partially electronically. For example, any handwritten comments or additions tend to add more work and confuse the surveying task, thereby necessitating additional follow-up phone calls to validate the “scribblings”.
Although it was slightly more cumbersome to design and implement the survey in PDF, this format was found to be robust, to make data transfer quicker (compact, human-readable FDF protocol), to permit respondents to use either fax back or on-line alternatives, and to easily parse the surveys into a MS Access database. Regarding PDF as opposed to MSWord Form, a similar survey was designed and implemented using MSWord Form and significant problems were encountered: (1) a simple 20 question form took 60 seconds to load on a typical PC and had ballooned to 600Kbytes, and (2) radio buttons (i.e. allowing the respondent to select only one alternative of a selection) could be implemented in older versions of MSWord (i.e. before MSWord97).
4.6 Related Administrative Support
A database of technical staff in Canadian municipalities does not exist. In order to carry out this survey, the list of potential individuals was generated using a combination of information sources as described earlier. Organizations such as the Federation of Canadian Municipalities, Canadian Public Works Association, American Public Works Association, or local chapters of these latter two groups or the National Guide to Sustainable Municipal Infrastructure have long term interest in knowing their contacts in the 3,500 municipalities across Canada. Perhaps the MIIP municipal survey data could serve as a starting point for such a database.
4.7 Future Work
This report is a precursor to a second survey aimed at obtaining more specific data about under ground utilities such as water mains, sewer networks and storm sewers. The same mailing list will be used.
B-5123.2 21
5 Conclusions
All sizes of Canadian municipalities are well-represented in this survey. For unsolicited surveys, the response percentage (67 out of 545 cities polled) is viewed as extremely good.
Many Canadian asset managers were not aware of any suggested levels of maintenance expenditures from government agencies, more specifically:
• 44% of respondents did not know there were suggested Levels of Investment; • another 23% were only vaguely familiar with these recommendations, and • 21% of respondents were unable to identify their actual Level of Investment.
Canadian municipalities indicated that their actual Levels of Investment fall short of their desired sustainable Levels of Investment:
• 77% of those surveyed (by number of responses) wanted to see maintenance funding in the range of the recommended 2% to 4% “Level of Investment”;
• the calculated “average” Level of Investment by number of responses was.7%; • the desired sustainable Level of Investment was 2.6%;
• 9% of respondents required at least four times as much as they currently receive for maintenance, and
• 60% of responses (by asset value) desired at least 50% more than they were currently receiving.
Regarding the objective of the report relating to the status of asset management in Canadian municipalities: three-quarters of respondents had systems in place to record their asset inventory; about 60% record and save asset value and approximately 70% maintains totals for their deferred maintenance.
Condition-based assessment is used by approximately half of the Canadian municipalities. Although 36% of respondents did not have a system at all, the others used technical audits, objective condition criteria, visual inspection and operator evaluations. The primary criteria identified for determining remaining service life of assets were subjective and not objective. The survey indicates that maintenance priorities were based on concerns regarding safety, condition, budget, regulations and health, in that order. However, few respondents indicated that
sophisticated techniques such as multi-objective optimization or weighting criteria were employed to assist setting these maintenance priorities.
The National Guide to Sustainable Municipal Infrastructure is known to the majority of respondents and that almost one-quarter of respondents were actively participating. National initiatives were recognized by more than half of the respondents. Recognition of provincial initiatives did not extend past their borders; however, these were well known to that regional community.
The state of Canadian municipal infrastructure can be summarized as follows: • the majority of Canadian municipal assets were “good” to “fair”;
• The condition of assets tended to be skewed more to the better side of the range; • 50% of the assets were at least 30 years old, and
B-5123.2 22
• Roughly 25% of assets were between 20 and 30 years old: -- in 10 years (without renewal) these will bring the proportion of +30 year old assets to a significant 75%. The prime contributors identified by the respondents that contributed to the current situation of deteriorated assets included the age of assets, political inaction, expanded need for facilities and inflation.
Clearly, more maintenance funds were required to improve the condition of assets; however, the respondents provided other ways to meet this challenge including the use of life cycle costing tools, planned preventative maintenance, decision-support tools, long range planning and commitment to asset management techniques.
In general, civil infrastructure managers wanted to know more about asset management and were able to provide reliable answers to the first three “whats”: what do you own, what is it worth and what is the deferred maintenance. Efforts should be made at a national level to ensure that municipalities can benchmark themselves against some national norm. Regarding the last three “whats”: researchers and practitioners should endeavour to develop and standardize tools and techniques to determine asset condition, to predict remaining service life and to prioritize both maintenance management and capital renewal.
Organizations such as the Federation of Canadian Municipalities (including the National Guide
to Sustainable Municipal Infrastructure), Canadian Public Works Association, or American
Public Works Association should maintain direct contact with the technology experts in the various 3,500 municipalities across Canada and should make those lists of municipal technology experts available. Perhaps the MIIP municipal survey data could serve as a starting point for such a database.
Auxiliary Comments:
Many organizations are asking: “what is the state of Canadian municipal infrastructure?” or “What is the Gap”, meaning how much addition money is required to bring the existing infrastructure to an acceptable state? The CAUBO (2000) gives the deferred maintenance in Canadian universities as approximately 10% of the current replacement value. The Auditor General's report (OAG, 1994) on the Department of National Defence infrastructure base of $17 billion had deferred maintenance totalling $1.7 billion, or 10%. Edmonton (2002) indicates that 8% to 13% of their infrastructure base is in need or repairs, replacement or upgrading.
The numbers from all municipal infrastructure sources provided in this report are low
considering that a number of other major asset owners in Canada are approximating deferred maintenance as between 10% and 15.8%. The important issue is not the amount of deferred maintenance, but rather whether this amount is sustainable within a specific jurisdiction? The higher sustainable Levels of Investment desired by the majority of respondents appears to be an indication of an urgent requirement for increased funding for maintenance of municipal