doi: 10.3389/fevo.2019.00393
Edited by: Vincent John Martin Noah Linus Felde, University of Kassel, Germany
Reviewed by: Nadine Borchhardt, Independent Researcher, Rostock, Germany Man Kit Cheung, The Chinese University of Hong Kong, China
*Correspondence: Ekaterina Pushkareva [email protected]
Specialty section: This article was submitted to Biogeography and Macroecology, a section of the journal Frontiers in Ecology and Evolution
Received: 28 June 2019 Accepted: 01 October 2019 Published: 29 October 2019 Citation: Pushkareva E, Wilmotte A, Láska K and Elster J (2019) Comparison of Microphototrophic Communities Living in Different Soil Environments in the High Arctic. Front. Ecol. Evol. 7:393. doi: 10.3389/fevo.2019.00393
Comparison of Microphototrophic
Communities Living in Different Soil
Environments in the High Arctic
Ekaterina Pushkareva1,2*, Annick Wilmotte3, Kamil Láska4and Josef Elster1,5
1Centre for Polar Ecology, University of South Bohemia, ˇCeské Bud ˇejovice, Czechia,2Department of Applied Ecology and Phycology, University of Rostock, Rostock, Germany,3InBios-Centre for Protein Engineering, University of Liège, Liège, Belgium,4Department of Geography, Faculty of Science, Masaryk University, Brno, Czechia,5Centre for Phycology, Institute of Botany, Academy of Sciences of the Czech Republic, Tˇrebo ˇn, Czechia
The Arctic region undergoes rapid climate change resulting in soil warming with consequent changes in microbial community structure. Therefore, it is important to gain more knowledge on the pioneer photosynthetic microorganisms and their relations to environmental factors. Here we provide a description of the community composition of microbial phototrophs in three different types of soils in the High Arctic (Svalbard): vegetated soil at a raised marine terrace, biological soil crust (BSC) at high elevation, and poorly-developed BSC in a glacier foreland. The studied sites differed from each other in microclimatic conditions (soil temperature and soil water content), soil chemistry and altitude. Combining morphological (cell biovolume) and molecular methods (NGS amplicon sequencing of cyanobacterial 16S rRNA and eukaryotic 18S rRNA sequences of isolates), we studied the diversity and biovolume of cyanobacteria and eukaryotic microalgae. The results showed that cyanobacteria prevailed in the high altitude BSC as well as in pioneering BSC samples in glacier foreland though with lower biomass. More specifically, filamentous cyanobacteria, mainly Leptolyngbya spp., dominated the BSCs from these two localities. In contrast, coccoid microalgae (green and yellow-green algae) had higher biovolume in low altitude vegetated soils. Thus, the results of this study contribute to a better understanding of microphototrophic communities in different types of Arctic soil environments.
Keywords: microbial phototrophs, the Arctic, biological soil crust, vegetated soil, diversity, microclimate, soil chemistry
INTRODUCTION
The Arctic is characterized by the presence of continuous permafrost with exceptions in some areas (e.g., Kola Peninsula) (ACIA, 2005). The development of Arctic soils is dominated by cryogenic processes, which are driven by the formation of ice in the soils. Arctic soils have a wide range of textures, including clay, silty clay, loam, sandy loam and coarse gravelly sand, mainly depending on the mode of deposition of the parent material. Ice formation physically changes the environment and can cause biologically significant chemical changes (in salinity, pH, conductivity, and gas content). Moreover, the presence and activity of Arctic soil organisms are greatly limited by the scarcity of liquid water (Yoshitake et al., 2010). Liquid water is produced by snowmelt or thawing of the active layer in spring and summer, resulting in increased biomass of the soil communities in this period (Belnap and Lange, 2003).
The High Arctic is mostly occupied by polar deserts and/or semi-deserts and has a low vegetation cover (<25%) which includes vascular plants such as Salix polaris, Papaver radicatum, Draba subcapitata, Saxifraga cernua, etc (Prach et al., 2012). Microbial communities are frequently observed in non-vegetated areas and they can form biological soil crusts (BSCs) on substrates ranging from fragmented rocks, gravels, and soils (Belnap and Lange, 2003). This type of community can be found in almost any terrestrial environment where vegetation does not cover 100% of the soil surface. The BSCs include various combinations of microphytic communities including microbial phototrophs (cyanobacteria and eukaryotic microalgae), heterotrophic bacteria, fungi, mosses, and lichens (Belnap and Lange, 2003; Büdel and Colesie, 2014). BSCs are involved in many important processes of the soil ecosystems such as nitrogen fixation, moisture trapping, stabilization of soil and organic carbon sequestration (Langhans et al., 2009; Huang et al., 2014; Stewart et al., 2014). In partially vegetated areas, BSCs also constitute a unique environment which influences the growth of vascular plants and abundance and structure of small animal communities (Bowker et al., 2010; Langhans et al., 2010).
BSCs in Polar Regions develop in a similar way as in warmer environments (Belnap and Lange, 2003; Pushkareva et al., 2015; Pessi et al., 2018) and diverse BSC types were described in Polar Regions (Williams et al., 2016). In summary, first, the pioneer organisms, mainly cyanobacteria, colonize the soil surface. Then, algae, mosses and lichens gradually appear, resulting in a better developed BSC containing higher nutrients concentrations. Further, the BSC community gradually develops through a succession of different organisms assemblages till it reaches a climax stage with a stable community where the lichens, mosses or microbial phototrophs will no longer change unless another disruption occurs (Büdel and Colesie, 2014). Filamentous cyanobacteria such as Leptolyngbya, Phormidium, and Microcoleus have a pivotal role in BSC formation due to the production of extracellular polymeric substances (EPS), which promote the stabilization of the soil surface, moisture retention, and protection against erosion (Hu et al., 2012; Büdel et al., 2016). Moreover, as climate change is already happening and is even worsened in some cases by anthropogenic impact, it is important to characterize the fragile Polar ecosystems. In particular, the BSC communities that are intimately linked to harsh and arid microclimatic conditions merit particular attention. Thereby, this study aims to compare communities of soil microbial phototrophs in three types of extreme Arctic environments which differ in the duration of ice-free conditions: old vegetated soils in a raised marine terrace, BSC located at a higher altitude and a poorly-developed BSC in front of a glacier foreland. We hypothesized that soil properties and microclimatic conditions greatly influence the biovolume and diversity of the soil microbial phototrophs. Furthermore, the sampling sites serve as control areas for open top chambers (OTCs) which were placed in 2011. Hence, the present assessment constitutes the baseline data for later comparisons with samples collected from inside the OTCs in future, which will provide insights on the effects of mimicked climate change on Arctic soil micro-phototrophic communities.
METHODS
Site Description
Sampling sites were located in the vicinity of Petunia Bay, the north branch of Billefjorden, Central Svalbard (Figure 1). The mean annual air temperatures in the study area range from-−3.7◦C at the sea level to <-8.4◦C (top of Mumien Peak)
in higher-elevation sites (Ambrožová and Láska, 2017). The coastal zone of Petunia Bay has a short summer (from June to September) with the mean monthly air temperatures above 0◦C
reaching maximum at 15◦C in July (Láska et al., 2012). Annual
precipitation is about 200 mm.
Three different localities were chosen for the study: a raised marine terrace (Site T), the Mumien Peak (Site P), and the foreland of the Hørbye Glacier (Site G). Site T with stable old soils uplifted above the sea level was fully covered by plants, including vascular plants such as Polygonum viviparum, Salix polaris, Carex rupestris, and Dryas octopetala (Prach et al., 2012). Site P located at the altitude of 442 m a.s.l. had mid-developed BSC with presence of mosses and lichens. The BSC were growing on weathered sedimentary rocks on unstable terrain slopes (average slope of 27◦). Finally, BSC from the recently deglaciated Site G
was poorly-developed without any presence of lichens, mosses, and vascular plants. Summary of the geographical characteristics of the sampling sites and geological characteristics of the soils (Szczucinski and Rachlewicz, 2007; Hanáˇcek et al., 2013) are presented in Table 1.
Soil Microclimate Measurements
The soil temperature (ST) and soil water content (SWC) were measured using three automatic meteorological stations (EMS Brno, CZ). The ST was monitored by a Pt100/Class A platinum resistance thermometer (EMS Brno, CZ) with an accuracy of ±0.15◦C. The SWC monitoring based on the soil capacitance
method was conducted using a Decagon 10HS soil moisture sensor (Decagon, USA) with an accuracy of ±2%, given by a calibration equation for the mineral soil. All sensors were placed in the shallow profile at 5 cm depth and data were recorded at 60-min intervals with an EdgeBox V8 multichannel datalogger (EMS Brno, CZ). The measurements were carried out in the period from 1 July 2010 to 31 July 2014, but for evaluation of soil thermal regime and water availability, only full summer seasons, defined according to the thawing period (French, 2007) when the soil temperature was higher than 0◦C, were chosen. The
microclimatic parameters served as the basis for the calculation of the length of the thawing period at each site, mean and extreme ST and SWC during the thawing period in 2011, 2012, and 2013. Obtained data were analyzed by the Mini32 software (EMS Brno, CZ) with subsequent processing using Statistica R software.
Sampling Procedure
Top soils or BSCs with a depth of 2–3 cm were collected from each site in August of 2011, 2012, and 2013. Three replicates were sampled within each site ∼5 m apart from each other and each replicate contained three soil cores (5.6 cm in diameter) mixed together. Soils from site T were fully covered by plants when collected and, subsequently, plants were removed from the
FIGURE 1 | Map of Petunia Bay and the sampling sites: T, P, and G. The modified map of Petunia Bay is based on the Svalbardkartet data, Norwegian Polar Institute.
samples. Collected samples were placed into zip bags, transported to the laboratory in dry ice and kept frozen at −20◦C for
further analyses.
Soil Physicochemical Analysis
Soil samples were passed through a sieve (2 mm mesh) and chemical analysis was performed according to Czech and European Union standards (ISO 10390, ISO 10523, ˇCSN EN 27888, ISO 11465, ˇCSN EN ISO 11732, ˇCSN EN ISO 13395, and ˇCSN EN ISO 15681–1). Conductivity was evaluated in demineralized water. Soil pH was measured in 1 M KCl. The percentage of total organic carbon (TOC) was determined by wet oxidation with acidified dichromate. NH4-N and
NO3-N concentrations were measured using a QuikChem R
8500FIAAutomated Ion Analyzer (Lachat Instruments, Loveland, USA). Phosphorus was detected as PO4-P using
ascorbic acid–molybdate and a SHIMADZU UV-1650PC spectrophotometer. Macroelements (Ca, Mg, K, Na) were analyzed using a ContrAA R atomic absorption spectrometer
(Analytik Jena, Jena, Germany).
Biovolume of Cyanobacteria and
Eukaryotic Microalgae
Cyanobacterial cell biovolume was estimated using light and epifluorescence microscopy (Kaštovská et al., 2005) as described
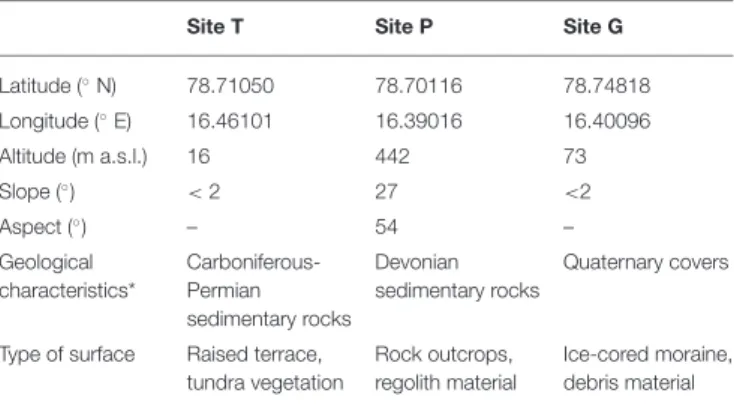
TABLE 1 | The geographical and geological characteristics of the sampling sites in Petunia Bay, Central Svalbard.
Site T Site P Site G
Latitude (◦N) 78.71050 78.70116 78.74818 Longitude (◦E) 16.46101 16.39016 16.40096 Altitude (m a.s.l.) 16 442 73 Slope (◦) < 2 27 <2 Aspect (◦) – 54 – Geological characteristics* Carboniferous-Permian sedimentary rocks Devonian sedimentary rocks Quaternary covers
Type of surface Raised terrace, tundra vegetation
Rock outcrops, regolith material
Ice-cored moraine, debris material
*Szczucinski and Rachlewicz (2007),Haná ˇcek et al. (2013).
inPushkareva et al. (2017) for the samples collected in 2011 and 2012. Three groups of cyanobacteria were determined according to their cell morphology: unicellular, filamentous, and heterocystous cyanobacteria. Moreover, diatoms and coccoid microalgae (green algae Chlorophyta and yellow-green algae Xanthophyceae) were also distinguished within the eukaryotic microalgae. Filamentous eukaryotic microalgae were not observed in the samples. Basic geometric equations for cylinders
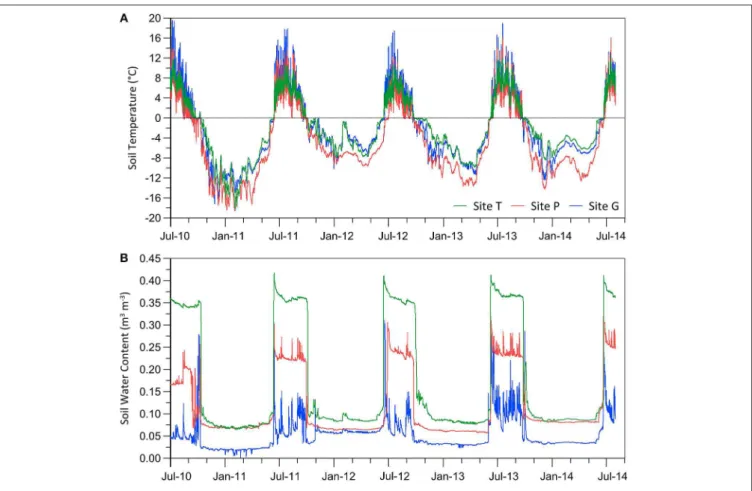
FIGURE 2 | Soil temperature (A) and soil water content (B) in the three studied sites in the period of 2010–2014.
with hemispherical ends and spheres were applied to calculate the biovolume (µm3g−1) of soil samples (Hillebrand et al., 1999).
Cyanobacterial Diversity by a
Culture-Independent Approach
To extract DNA from the nine samples collected in 2012, two DNA Isolation Kits (MOBIO, Carlsbad, CA, USA) were tested, the PowerBiofilm and PowerSoil. Both kits resulted in similar DNA yields and, therefore, the PowerBiofilm DNA Isolation Kit was used according to the manufacturer’s instructions.
The V3-V4 region of the 16S rRNA gene was amplified using the cyanobacteria-specific primers 359F and 781Ra/781Rb (Nübel et al., 1997) in separate reactions for each reverse primer (Boutte et al., 2006). Barcode sequences had been added to both forward and reverse primers and were specific to each sample to enable multiplexing. PCR reactions in triplicate for each set of primers were performed as described in Pessi et al. (2016). Triplicates were later pooled together, purified using the GeneJet PCR Purification Kit (Thermo Scientific, Waltham, MA, USA) and quantified using the Quant-iTPicoGreen dsDNA Assay Kit (Life Technologies, Carlsbad, CA, USA). Libraries were pooled in equimolar concentrations and sent to GENEWIZ (South
Plainfield, NJ, USA) where sequencing adaptors were ligated to the amplicons and paired-end sequences (2 × 300 bp) were obtained using the Illumina MiSeq v3 platform. Sequencing of three soil samples (one sample from Site T and two samples from Site G) was not successful, and thus these samples were excluded from further analyses. Raw sequences were deposited in Sequence Read Archive (SRA) with accession number PRJNA561039.
Quality filtering of obtained sequences and their clustering into operational taxonomic units (OTUs) were performed using UPARSE at 97% sequence identity (Edgar, 2013) according to
Pessi et al. (2016). Reads shorter than 370 bp and with more than 0.5 expected errors were discarded. OTUs were classified using CREST [30] based on the Greengenes database (McDonald et al., 2012). Non-cyanobacterial OTUs were discarded and the most closely related isolate for each OTU was obtained using the SeqMatch tool from RDP (Cole et al., 2014).
Rarefaction curve (Supplementary Figure 1) and alpha diversity indices (Supplementary Table 1) were calculated using QIIME 1 (Caporaso et al., 2010) after normalizing the number of sequences to those of the samples with the lowest number of sequence reads (1983 sequences). Beta diversity was calculated using the UniFrac distance metric (Lozupone and Knight, 2005) with Weighted Paired Group Method of Averaging (WPGMA).
Diversity of Eukaryotic Microalgae by a
Culture-Dependent Approach
Soil samples collected in 2012 were pre-cultivated on plates with solid BG11 medium (Stanier et al., 1979). To obtain unialgal strains, the dilution plate method was used (Elster et al., 1999). The isolated strains of eukaryotic microalgae were kept in an illuminated incubator at a temperature of 6◦C and continuous
lighting with a photon flux density of 20 µmol m−2s−1.
Genomic DNA of microalgal strains was extracted using the XS method (Tillett and Neilan, 2000) according toYilmaz et al. (2009). The 18S rRNA gene was amplified using primers NS1 (White et al., 1990) and 1650R vivi (Kipp, 2004) as follows: an initial denaturation step at 94◦C for 5 min, followed by 35
cycles of DNA denaturation at 94◦C for 30 s, primer annealing
at 55◦C for 54 s, strand extension at 72◦C for 2 min, and a
final extension step at 72◦C for 10 min. PCR products were
purified using a QIAquick PCR Purification Kit (QIAGEN, The Netherlands). Sequencing was carried out by the Laboratory of Genomics, Biology Centre of the Academy of Sciences of the Czech Republic, ˇCeské Budˇejovice with the ABI PRISM 3130 XL sequence analyzer (Applied Biosystems, Life Technologies Corp., CA, USA) using primers NS1 and 1150R (White et al., 1990). Obtained sequences were analyzed using BioEdit v7.2.5 (Hall, 1999) and deposited in GenBank with accession numbers MK929233-MK929255. The most closely related isolates were fetched from GenBank using BLAST. All sequences were aligned using MAFFT (Katoh and Standley, 2013). A phylogenetic tree comprising the algal isolate sequences and their best GenBank hits was constructed using the maximum likelihood method based on the Jukes-Cantor model in MEGA6 (Tamura et al., 2013).
Statistical Analysis
The statistical analyses were performed in the statistical software JMP 14.0.1. Normality of variance was assessed using Shapiro– Wilk’s test and, if necessary, data were Box Cox or Square Root transformed. Differences in soil chemical parameters were evaluated using the one-way ANOVA and Tukey’s HSD post-hoc test. Two-way ANOVA was used to test the effects of the factors (site and year) on soil chemistry and biovolume. The relationships between biovolume of microbial phototrophs and soil parameters were modeled using Pearson correlation coefficient (PCC).
RESULTS
Microclimatic Parameters
Soil temperature (ST) and soil water content (SWC), measured at 5 cm depth during the three full summer seasons, showed differences between the three studied sites (Figure 2;
Supplementary Table 2). The thawing period (when the
ST was above 0◦C) lasted from June till September and
varied from 72 to 107 days, depending on the site and year (Supplementary Table 2a). The shortest thawing period (72–99 days) in the studied sites was recorded in 2012. Year-to-year differences in the duration of the thawing period varied between 8 and 9 days at the low-lying Sites T and G, but reached 25 days TA
B L E 2 | S o il c h e m is tr y in th e th re e st u d ie d lo c a lit ie s w ith st a n d a rd e rr o r (S E ) m e a su re d in th e sa m p le s c o lle c te d in 2 0 1 1 , 2 0 1 2 , a n d 2 0 1 3 . p H (S E ) C o n d u c ti v it y, µ S /c m (S E ) N -N H4 , mg k g − 1(S E ) N -N O3 , mg k g − 1(S E ) P -P O4 , mg k g − 1 (S E ) O rg a n ic C , % (S E ) C a , mg k g − 1(S E ) M g , mg k g − 1 (S E ) K , mg k g − 1(S E ) N a , mg k g − 1(S E ) S it e T 2 0 1 1 7 .7 B ,a (< 0 .1 ) 1 1 4 .4 B ,a (2 2 .2 ) 5 .5 A ,b (2 .0 ) 0 .4 A ,b (0 .2 ) 0 .5 A ,c (< 0 .1 ) 1 2 .5 A ,a (1 .4 ) 5 1 7 0 A ,b (2 3 5 ) 2 3 8 B ,b (4 ) 6 4 .7 A ,b (6 .1 ) 2 0 .5 A ,a (1 0 .4 ) 2 0 1 2 7 .7 B ,a (< 0 .1 ) 1 4 6 .3 A ,a (6 .1 ) 1 5 .5 A ,a (5 .0 ) 1 .7 B ,a (1 .2 ) 5 .1 A ,b (0 .8 ) 1 3 .6 A ,a (1 .0 ) 7 9 6 2 N A 8 0 8 N A 1 0 8 .4 N A 2 1 .1 N A 2 0 1 3 7 .4 B ,b (< 0 .1 ) 1 5 5 .8 A ,a (2 .1 ) 6 .4 A ,a b (0 .9 ) 0 .3 A ,b (< 0 .1 ) 1 7 .6 A ,a (0 .9 ) 1 4 .6 A ,a (1 .5 ) 7 6 9 0 A ,a (2 1 9 ) 3 8 2 B ,a (1 4 ) 3 3 4 .4 A ,a (4 9 .1 ) 1 9 .3 A ,a (1 .5 ) S it e P 2 0 1 1 8 .5 A ,a (0 .1 ) 9 6 .0 B ,a (6 .0 ) 4 .0 A ,a (2 .9 ) 0 .7 A ,b (0 .3 ) 0 .1 B ,c (< 0 .1 ) 5 .1 B ,a (0 .6 ) 4 1 8 6 B ,a (5 2 6 ) 8 1 8 A ,b (1 2 7 ) 3 1 .7 C ,b (5 .7 ) 1 2 .4 A ,a (6 .1 ) 2 0 1 2 8 .5 A ,a (< 0 .1 ) 9 3 .7 B ,a (1 1 .3 ) 3 .4 B ,a (0 .8 ) 2 1 .5 A ,a (1 3 .8 ) 5 .9 A ,b (0 .8 ) 3 .6 B ,b (0 .3 ) 3 4 9 3 N A 1 4 7 6 N A 2 0 .7 N A 4 .4 N A 2 0 1 3 8 .3 A ,a (0 .1 ) 8 5 .5 B ,a (4 .3 ) 1 .7 B ,a (0 .2 ) 0 .4 A ,b (< 0 .1 ) 2 0 .6 A ,a (1 .9 ) 3 .6 B ,b (0 .6 ) 5 1 5 6 B ,a (6 1 5 ) 1 8 0 6 A ,a (2 9 1 ) 9 4 .8 B ,a (1 8 .5 ) 1 7 .3 A ,a (2 .7 ) S it e G 2 0 1 1 8 .4 A ,a (< 0 .1 ) 4 3 2 .3 A ,a (1 2 9 .3 ) 2 .4 A ,a (0 .9 ) 0 .2 B ,a (< 0 .1 ) 0 .1 B ,c (< 0 .1 ) 3 .4 C ,a (< 0 .1 ) 5 0 4 2 A B ,b (3 4 4 ) 1 7 6 B ,b (6 ) 4 8 .5 B ,b (2 .1 ) 1 .3 B ,b (1 .7 ) 2 0 1 2 8 .4 A ,a (0 .2 ) 8 8 .1 B ,b (5 .5 ) 1 .6 C ,a (0 .2 ) 0 .2 C ,a (< 0 .1 ) 2 .6 B ,b (0 .3 ) 3 .0 B ,a (< 0 .1 ) 5 2 9 3 N A 3 2 3 N A 5 7 .0 N A 5 .2 N A 2 0 1 3 8 .3 A ,a (< 0 .1 ) 7 3 .0 C ,c (2 .1 ) 0 .8 C ,b (< 0 .1 ) 0 .1 B ,a (< 0 .1 ) 1 6 .8 A ,a (1 .9 ) 2 .4 C ,b (0 .3 ) 7 1 7 2 A ,a (1 5 6 ) 3 4 5 B ,a (3 ) 1 0 1 .9 B ,a (4 .1 ) 2 0 .6 A ,a (3 .7 ) Tw o -W a y A N O V A (F R a ti o s ) S ite 2 3 2 .9 1 ** * 2 9 .3 8 ** * 7 4 .0 1 ** * 6 6 .0 3 ** * 3 8 .0 0 ** * 5 4 4 .8 3 ** * 2 8 .9 5 ** * 3 1 0 .1 5 ** * 9 9 .7 9 ** * 6 .9 3 * Y e a r 1 6 .4 7 ** * 2 0 .8 0 ** * 1 9 .2 9 ** * 2 3 .6 9 ** * 2 1 1 4 .5 6 ** * 5 .4 3 * 8 3 .6 8 ** * 1 1 4 .4 9 ** * 3 6 4 .4 4 ** * 1 4 .5 5 ** S ite x Y e a r n s 3 1 .1 5 ** * 6 .4 3 ** n s 1 7 .2 1 ** * 6 .8 7 ** 4 .6 2 * 9 .3 5 ** 2 8 .6 1 ** * 8 .8 9 ** S a m e le tte rs in di c a te n o s ta ti s ti c a ldi ff e re n c e be tw e e n gr ou ps a c c or di n g to on e -w a y A N O V A fol low e d by Tu ke y’ s pa ir w is e pos th oc te s ts (p < 0.05) : (A – C ), be tw e e n s ite s a t th e s a m e ye a r; (a – c ), be tw e e n ye a rs w ith in e a c h s ite . Tw o-w a y A N O V A re s u lts s h o w F ra ti o s . F o r C a , Mg , K , a n d N a , tw o-w a y A N O V A w a s don e on ly w ith s a m pl e s fr om 2011 a n d 2013. ** *p < 0 .0 0 1 , ** p < 0 .0 1 , *p < 0 .0 5 , n s , n o n -s ig n ifi c a n t. N A m e a n s th a t th re e s o il s a m pl e s w e re m ix e d to g e th e r pr ior m e a s u re m e n ts a n d th e re for e S D is n ot a va ila bl e .
at the highest elevated Site P between 2012 and 2013. During the studied thawing periods, July was the warmest month in the three sites and the highest mean ST was recorded at the Site G (8.5◦C in July) (Supplementary Table 2b). The lowest mean ST
in the thawing period was reported in June at the Site P, reaching only 0.7◦C.
The highest SWCs among the studied sites were recorded during the thawing period of 2013, wherein the mean SWC varied from 0.12 to 0.37 m3m−3(Supplementary Table 2a). The
maximum saturation level given by the highest SWC (up to 0.42 m3m−3at the Site T) was reached at the beginning of the thawing period in the second half of June, only a few days after the final snow melting (Supplementary Table 2b). The minimum SWC (0.03 m3m−3) occurred in Site G at the beginning of the
thawing season.
Large seasonal and day-to-day variations in both ST and SWC were observed during each thawing period (Figure 2). In contrast to other sites, a higher variability of the soil thermal regime was observed at the Site G, where the lowest level of SWC was also measured. Moreover, a high variation in ST was found at the higher-elevation Site P composed of weathered sedimentary rocks on unstable terrain slopes (average slope of 27◦) without
any presence of vegetation (see Table 1) though the SWC values appear very stable during the same period.
Soil Properties
Chemical parameters of the soil crusts and vegetated soil samples measured during three summers varied significantly between the sites and years (Table 2). The pH fluctuated between 7.4 and 8.5 across the studied localities and was significantly lower at Site T than in other sites. On the other hand, conductivity, TOC and NH4-N contents were high at Site T. Low nutrient
concentrations were recorded in the poorly developed BSC from the glacier foreland (Site G). The ammonium concentration (NH4-N) was higher than the nitrate (NO3-N) concentration at
all sites and ranged from 0.8 to 15.5 mg kg−1soil while the nitrate concentrations were negligible, except for the soil collected in 2012 at Site P (21.5 mg kg−1soil).
Biovolume of Microbial Phototrophs
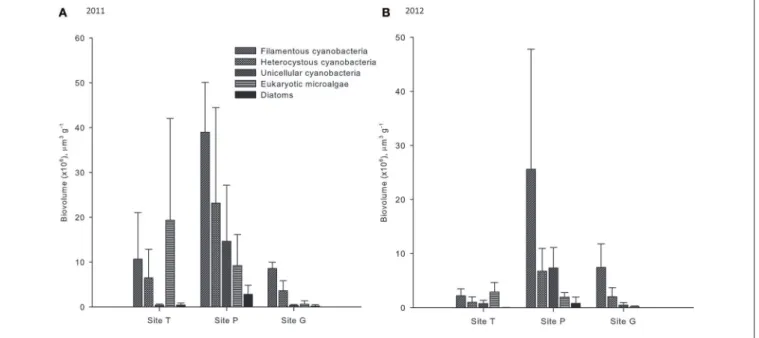
Total cyanobacterial biovolume was the highest in Site P with average values of 76.8 × 10⁶ and 39.7 × 106 µm3 g−1 for
the samples collected in 2011 and 2012, respectively (Figure 3;
Supplementary Table 3). Lower cyanobacterial biovolumes were
observed in Site G (average of 12.5 and 9.9 × 106 µm3 g−1 in 2011 and 2012, respectively) and Site T (average of 17.6 and 3.9 × 106 µm3 g−1 in 2011 and 2012, respectively). Filamentous
cyanobacteria were the dominant cyanobacteria in all studied sites and constituted a major fraction within each locality (29– 73% of total biovolume). In addition, they had higher biovolume in site P than in the other sites (average of 39.0 and 25.6 × 106 µm3 g−1 in 2011 and 2012, respectively) together with
heterocystous (average of 23.2 and 6.8 × 106µm3g−1 in 2011
and 2012, respectively) and unicellular cyanobacteria (average of 14.6 and 7.4 × 106µm3g−1in 2011 and 2012, respectively).
Eukaryotic coccoid microalgae together with diatoms had higher biovolume in the samples collected in 2011 than in those from 2012 (Figure 3; Supplementary Table 3). The highest
biovolume of eukaryotic coccoid microalgae was recorded in Site T (average of 19.4 and 2.9 in 2011 and 2012, respectively). In contrast, their lowest biovolume (average of 0.6 and 0.2 × 10⁶
µm3g−1in 2011 and 2012, respectively) was observed at Site G
where diatoms were present only in one sample collected in 2011. In addition, diatoms were very rare, but slightly more abundant in Site P than in the other two sites.
Diversity of Microbial Phototrophs
A total of 141132 quality reads were obtained for six samples using amplicon sequencing of the 16S rRNA gene. After bioinformatic analysis, 69631 cyanobacterial sequences remained and were later grouped into 137 OTUs. The majority of the OTUs belonged to the order Synechococcales (78 OTUs) and the rest of the OTUs were from the orders Chroococcales (19 OTUs), Oscillatoriales (12 OTUs), Nostocales (11 OTUs), and Gloeobacterales (10 OTUs) (Figure 4). In addition, 7 OTUs were not classified further than phylum.
To compare cyanobacterial community composition between the study sites, the dataset was normalized to 1983 sequences per sample. After the normalization, 128 OTUs remained and an average of 92, 69, and 67 OTUs were observed in Sites P, T, and G, respectively (Figure 4A; Supplementary Table 1). Good’s coverage estimator was 98–99%, indicating that the large majority of the cyanobacterial diversity was captured in the analysis (Supplementary Table 1). A total of 52 OTUs were shared between the three studied localities (Supplementary Figure 2). Furthermore, 27 OTUs were unique to Site P while 3 OTUs were only found in the Sites T and G. The three localities were dominated by cyanobacteria from the order Synechococcales (84.4–88.2% of all sequences), where the genus Leptolyngbya constituted a major fraction (52.6–74.0% of all sequences) and was the most abundant in Site G (Figure 4B). Filamentous cyanobacteria from the order Oscillatoriales ranged from 7.26 to 7.82% of all sequences in each site. Furthermore, Chroococcales (1.36–3.31% of all sequences), Gloeobacterales (1.16–2.22% of all sequences), and Nostocales (1.55–1.97 % of all sequences) were also present in the three studied sites. OTU 1 (100% similar to Phormidium sp. CYN64) was the most abundant in Site T, whereas OTU 2 (99.5% similar to Leptolyngbya antarctica ANT.L67.1) was dominant in Site P and quite abundant in the other sites (Table 3). Additionally, OTU 6 (100% similar to Leptolyngbya frigida ANT.L52B.3) dominated in Site G. These three hits were filamentous cyanobacteria collected in Antarctic lakes and ponds (Taton et al., 2006; Martineau et al., 2013).
WPGMA analysis showed that the cyanobacterial community compositions in the three localities differed from each other (Supplementary Figure 3). Moreover, the three replicates from Site P formed a well-defined cluster based on the obtained cyanobacterial OTUs, while the samples from Sites T and G clustered erratically.
A total of 23 isolates of eukaryotic microalgae including Chlorophyte (15 isolates) and Xanthophyceae (8 isolates) was obtained from the three localities (Table 4;
Supplementary Figure 4). The majority of the eukaryotic
microalgae (13 isolates) were isolated from Site T, while 6 and 4 isolates were obtained from Sites G and P, respectively. Moreover,
FIGURE 3 | Biovolume of microbial phototrophs per 1 g of dry soil in the samples collected in 2011 (A) and 2012 (B).
FIGURE 4 | Cyanobacterial community composition in three studied localities based on Illumina sequencing of the 16S rRNA gene. Data were calculated after the normalization to 1983 sequences per sample. (A) Richness expressed as the number of OTUs and (B) distribution of the reads expressed as relative abundance.
no yellow-green algae were isolated from Site P. Obtained microalgal sequences (except from isolates 4, 5, and 7) were more than 99 % similar to the sequences from NCBI database. Isolates 1 and 6 (Chloromonas-affiliated) as well as isolates 8, 9, 11, and 13 (Coccomyxa-affiliated) formed groups of related strains isolated from two or three different sites (Supplementary Figure 4). In contrast, strains related to Koliella/Stichococcus were only isolated from site T. Xanthophyceae-affiliated strains related to Heterococcus and Xanthonema were isolated from sites T and G.
Relationship Between Biovolume of
Microbial Phototrophs and Soil Chemistry
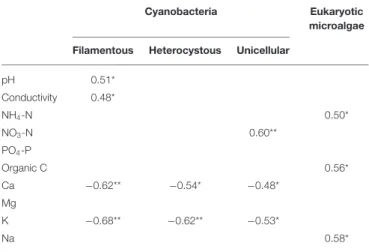
Pearson correlation coefficient showed a positive effect of pH and conductivity on biovolume of filamentous cyanobacteria (p < 0.05; Table 5). On the other hand, there were negative correlations (p < 0.05) between macroelements contents (Ca and K) and cyanobacterial biovolumes. Furthermore, biovolume of eukaryotic microalgae was positively correlated (p < 0.05) to NH4-N, TOC, and Na, while diatoms were so rare that
TABLE 3 | The most abundant*cyanobacterial operational taxonomic units (OTUs) in the three sites.
OTU Relative abundance**, % Best SeqMatch isolate hit (Accession number, ID %)
Site T Site P Site G
OTU2 17.10 22.64 13.26 Leptolyngbya antarcticaANT.L67.1 (AY493572, 99.5%)
OTU1 32.17 3.68 8.32 Phormidiumsp. CYN64 (JQ687330, 100%)
OTU6 2.24 5.56 27.69 Leptolyngbya frigidaANT.L52B.3 (AY493612, 100%)
OTU11*** 0.71 0.49 16.29 Phormidesmis priestleyiANT.LG2.4 (AY493580.1, 100%)
OTU4*** 0.40 12.12 0.15 Leptolyngbyasp. LLi18 (DQ786166, 97.5%)
OTU10 5.82 3.26 2.72 Synechococcussp. PS715 (AF216952, 99.7%)
OTU7*** 0.76 8.02 0.10 Calothrixsp. KVSF5 (EU022730, 95.1%)
OTU5 3.48 2.56 2.02 Leptolyngbyasp. ANT.L52.1 (AY493584, 97.5%)
OTU3 5.72 1.28 1.01 Arthronema africanumSAG 12.89 (AB115966, 93.1%)
OTU8 2.45 2.32 2.37 Microcoleus rushforthiiUTCC 296 (AF218377, 100%)
OTU189 3.66 0.44 2.02 Phormidiumsp. CYN64 (JQ687330, 96.4%)
OTU15*** 1.69 3.11 0.81 Leptolyngbya nostocorumUAM 387 (JQ070063, 97.8%)
OTU12*** 0.13 4.91 0.20 Calothrixsp. KVSF5 (EU022730, 94.5%)
OTU315 0.40 0.84 3.88 Arthronema africanumSAG 12.89 (AB115966, 93.4%)
OTUs are listed in decreasing order based on their total relative abundance.
*OTUs with more than 100 sequences in sum for six samples after the data normalization to 1983 sequences. **Relative abundances obtained after data normalization to 1983 sequences.
***OTUs with 100% similarity to sequences of cyanobacterial crusts in Petunia Bay (Pushkareva et al., 2015). Bold values correspond to the highest abundance within each site.
DISCUSSION
Microbial Phototrophs Inhabiting Arctic
Soil Environment
The morphological and molecular methods revealed conspicuous differences in the phototrophic community composition in the three studied localities. Site P had the highest biovolume of microbial phototrophs and cyanobacterial OTU richness as well as the highest number of unique OTUs in comparison to the other sites (Figures 3, 4A; Supplementary Figure 2). Frequent occurrence of snowfall events and the consequent fast snowmelt during summer months at high altitude provided the liquid water favoring the seasonal activity of soil microbial phototrophs (Janatková et al., 2013; Pushkareva and Elster, 2013). It could also be explained by the soil organic matter accumulated in the mucilaginous BSC, which is subjected to little turn-over due to the limited period of time where metabolic activity is possible (about 3 months). Thus, the creation of a kind of “cocoon” could mitigate the harsh conditions of a weathered rocky substrate on a slope. Though the BSC from glacier foreland Site G was also dominated by cyanobacteria, a much lower biovolume and OTU richness were observed, probably, as a consequence of frequent mechanical disturbances (cryoturbation, water erosion, etc.) connected with the low availability of mineral nutrients and organic carbon, which are the key parameters in shaping BSC communities (Housman et al., 2006; Newsham et al., 2010; Pietrasiak et al., 2013; Pushkareva et al., 2015).
Samples from Sites P and G were dominated by cyanobacteria, where filamentous taxa constituted a major fraction (Figures 3, 4) and, furthermore, sequences affiliated to Leptolyngbya spp. were prevalent (Table 3). Besides, OTU 1
(100% similar to Phormidium sp. CYN64) was the dominant cyanobacterial OTU in the Site T and similar sequences were also found to prevail in the lichenized BSC in the coastal zone of Petunia Bay in Svalbard (Pushkareva et al., 2015). Indeed, filamentous cyanobacteria usually dominate polar terrestrial ecosystem due to their motility and mucilage production (Kaštovská et al., 2005; Pushkareva et al., 2016; Rippin et al., 2018). Heterocystous cyanobacteria (Nostocales), which are an important source of fixed nitrogen in Arctic soils, had a higher biovolume in Site P than in the other sites. It has been shown that heterocystous cyanobacteria increase in quantity with elevation, because their biovolume is independent of the concentration of organic matter, unlike filamentous cyanobacteria (ˇReháková
et al., 2011). Moreover, at the OTU level, the majority of Nostocales sequences were similar to Calothrix sp. (similarity 94–95%) and sequences affiliated to this genus represented 13% of the reads in Site P. In addition, they were identical to sequences of the “OTU4” previously found in two BSCs in the nearby coastal zone of Petunia Bay (Svalbard), one from poorly developed cyanobacterial crust and one from a mid-developed with a mixture of lichens and cyanobacteria, showing evidence of a local distribution of this phylotype (Pushkareva et al., 2015). This sequence represents a new phylotype that has not yet been cultivated and thus, its precise identity is still elusive. Similarly, biovolume of unicellular cyanobacteria was higher in Site P than in other localities, possibly because they do not require a stable substrate and high organic matter content (Kaštovská et al., 2005; ˇReháková et al., 2011).
In contrast, the nutrient-rich vegetated soils from Site T had a lower cyanobacterial biovolume than in Site P as a result of light deficiency, caused by overshadowing due to the dense presence
TABLE 4 | Eukaryotic microalgae isolated from the three localities.
Microalgal isolate
Site Most closely related GenBank isolate sequence (Accession number, ID %)
Chlorophyte (Green Algae)
Isolate 1 P Chloromonas rosaeSAG51.72 (AB624565.1, 99%)
Isolate 2 T Koliella antarcticaSAG 2030 (AJ311569.1, 99%)
Isolate 3 T Chlamydomonassp. ISBAL (JN903985.1,
99%)
Isolate 4 T Pseudomuriella aurantiacaSAG 249-1 (X91268.1, 92%)
Isolate 5 G Chloromonas macrostellataSAG 72.81 (JN903986.1, 98%)
Isolate 6 T Chloromonas rosaeSAG51.72 (AB624565.1, 99%)
Isolate 7 P Bracteacoccus occidentalisACSSI 221 (MG582203.1, 95%)
Isolate 8 P Coccomyxasp. KGU-D001 (AB742451.1,
99%)
Isolate 9 G Coccomyxasp. KGU-D001 (AB742451.1,
99%)
Isolate 10 P Mychonastes zofingiensisCCAP 211/14 (GU827478.1, 100%)
Isolate 11 G Coccomyxa subellipsoideaCCAP 812/3 (HG972972.1, 100%)
Isolate 12 T Stichococcussp. SAG 2482 (KP081395.1, 99%)
Isolate 13 T Coccomyxa subellipsoideaCCAP 812/3 (HG972972.1, 100%)
Isolate 14 T Stichococcussp. WB47 (KF144240.1, 99%) Isolate 15 T Stichococcus jenerensisKP09HW3001
(KX094816.1, 99%) Xanthophyceae (Yellow-Green Algae)
Isolate 16 T Heterococcus chodatiiSAG 835-3 (AM490822.1, 100%)
Isolate 17 T Heterococcus chodatiiSAG 835-3 (AM490822.1, 99%)
Isolate 18 T Tribonema ulotrichoidesSAG 21.94 (AM490817.1, 99%)
Isolate 19 G Heterococcus caespitosusSAG 835-2a (AM490820.1, 99%)
Isolate 20 G Xanthonemasp. A14 (AM491612.1, 99%) Isolate 21 G Botrydiopsis constricta(AJ579339.1, 99%) Isolate 22 T Xanthonema sessileIBSG-V98 (AM490818.1,
99%)
Isolate 23 T Xanthonemasp. A14 (AM491612.1, 99%)
of vascular plants (Kaštovská et al., 2007). The decrease of the cyanobacterial OTU richness and biovolume in well-developed soil crusts fully covered by lichens has been shown in Svalbard (Pushkareva et al., 2015, 2017) and similar competition but with plants was probably playing a role in the case of the vegetated soils of Site T. Furthermore, the WPGMA analysis based on sequencing results showed that the three subsamples from Site P were well-grouped by their site of origin and thus were quite homogeneous (Supplementary Figure 3). On the other hand, the two subsamples from Site T were not grouped, whereas the only
TABLE 5 | Pearson correlation coefficient between the biovolume of microbial phototrophs and soil physicochemical parameters.
Cyanobacteria Eukaryotic
microalgae
Filamentous Heterocystous Unicellular
pH 0.51* Conductivity 0.48* NH4-N 0.50* NO3-N 0.60** PO4-P Organic C 0.56* Ca −0.62** −0.54* −0.48* Mg K −0.68** −0.62** −0.53* Na 0.58* **p < 0.01, *p < 0.05.
sample from Site G shared more OTUs with site P than with site T. It might be due to the unfavorable conditions in both P and G sites. Moreover, the presence of several plant species could strongly influence the composition and activity of the rhizosphere microbiota (Philippot et al., 2013) and this could lead to the cyanobacterial community heterogeneities observed within the vegetated site T.
Eukaryotic microalgae, including Chlorophyte and Xanthophyceae, prevailed over other microbial phototrophs in Site T. Besides, the majority of algal cultures, including green algae Chlorophyceae and Trebouxiophyceae and yellow-green algae Xanthophyceae, were isolated from this site (Table 4). These algae are typical habitants of polar vegetated soils and BSCs (Belnap et al., 2001; Borchhardt et al., 2017). Abundance of green and yellow-green algae has been shown to decrease in high altitude where vegetation is sparse or absent (Elster et al., 1999; ˇCapková et al., 2016). This effect could explain why their biovolume in Site P was lower than in Site T. Similarly, the biovolume of eukaryotic microalgae was the lowest in Site G due to an unfavorable microclimate, such as the low temperature and water content in summer, which negatively influence their growth and development (Elster et al., 1999).
Environmental Parameters and Their Effect
on Community Composition of Microbial
Phototrophs
The impact of microclimate and microenvironment around individual organisms are very significant, especially in the high-latitude regions (Elster, 2002). For example, water and temperature fluctuations are one of the most important ecological and physiological factors in the polar regions (Elster and Benson, 2004) affecting the growth of microorganisms and the biological activity of soils (Colesie et al., 2014). In the studied sites, the mean soil temperature (ST) in the period when liquid water was available, fluctuated from 4.1 to 6.7◦C. Colesie et al. (2014) suggested that temperature
the Polar Regions. However, temporal changes in temperature provoke a series of adaptive responses comprising resistance and tolerance to cold, freezing, drought, desiccation, and salinity stress (Tashyreva and Elster, 2012).
The highest and most stable soil water content (SWC) was recorded in the vegetated soil from the Site T during the thawing period (Figure 2; Supplementary Table 2), and could correspond to the fact that the suction of water is usually higher within the root zone of plant cover than that in bare soil (Leung et al., 2015). On the contrary, the lowest SWC with the highest seasonal variation was registered in the poorly-developed BSC in the recently deglaciated areas (Site G). The variability of soil temperature regime among the three sites showed a close relation to the water content fluctuation and saturation level of the soils. While the largest diurnal amplitudes were found for the driest soil crust from Site G (up to 11◦C),
the vegetated soil at the well-saturated Site T showed a twice lower temperature amplitude (Figure 2). On the other hand, the diurnal temperature regime at the site P showed a much smaller amplitude than lower-lying sites, as a consequence of the altitude effect on air temperature (Ambrožová and Láska, 2017), the increased snow cover occurrence and related insulation effect on the active-layer thermal regime (Westermann et al., 2009; Hrbáˇcek et al., 2016). In addition, the microbial communities responded to environmental drivers and changed over the years. In this study, the total biovolume of microbial phototrophs was higher in the samples collected in 2011 than in those from 2012. It could be due to the lower soil temperatures in 2012 and shorter thawing period (when the ST was above 0◦C), given the
negative impact of low temperatures on growth and development of soil microorganisms.
Pearson correlation coefficient showed a positive relation (p < 0.05) between pH and biovolume of filamentous cyanobacteria (Table 5), which has been already shown in several studies (e.g., Nayak and Prasanna, 2007; Pushkareva et al., 2015). Furthermore, there were negative correlations (p < 0.05) between macroelements, such as Ca and K, and biovolume of all cyanobacterial types. Perhaps, the binding of Ca to phosphate could limit P availability, which is important for many soil ecophysiological processes (e.g., nitrogen fixation) that require its high amount (Richardson and Simpson, 2011).
CONCLUSION
In this study, we compared the community composition of microbial phototrophs in the three localities with different soil chemistry and microclimatic conditions. The BSC located at higher altitude (442 m) hosted more diverse and abundant cyanobacterial communities while eukaryotic microalgae prevailed in the vegetated soil with a more stable soil water content and temperature. Vegetation cover might be the limiting factor for the community of microbial phototrophs due to the competition and light shading. On the other hand, poorly developed BSC in the glacier foreland with low soil water content and nutrient concentrations harbored less diverse and abundant communities of microbial phototrophs than in other studied localities. Furthermore, our findings indicated a
negative relationship between macroelements (Ca and K) and cyanobacterial biovolume, while a higher pH corresponded to a higher abundance of the filamentous cyanobacteria. The succession from phototrophic microbial communities dominated by cyanobacteria in harsh environmental conditions to a dominance by microalgae (green and yellow-green algae) in vegetated soils could also be the future trajectory of these High Arctic communities if higher temperatures in future are coupled with sufficient precipitations to keep a stable humidity. Therefore, our results could contribute to the understanding of the phototrophic communities in Arctic soil ecosystems and its relation to environmental factors. In comparison with future observations in the Open Top Chambers, it could be useful to predict climate change impact in the Arctic.
DATA AVAILABILITY STATEMENT
The datasets generated for this study can be found in GenBank with accession numbers MK929233-MK929255 and in Sequence Read Archive (SRA) with accession number PRJNA561039.
AUTHOR CONTRIBUTIONS
EP and JE designed the study and collected the samples. EP performed laboratory work and data analyses. KL provided meteorological data and participated in the meteorological data analysis. AW contributed to the molecular part of the study. EP wrote the manuscript. All authors performed the revision.
FUNDING
This study was supported by the Ministry of Education, Youth and Sports of the Czech Republic (projects no. LM2015078 and CZ.02.1.01/0.0/0.0/16_013/0001708). AW was research associate of the Belgian Funds for Scientific Research of Belgium (FRS-FNRS) and benefited from the FNRS projects PYROCYANO (grant CRCH1011-1513911) and BIPOLES (grant FRFC2457009) and the Belgian Federal Science Policy Office (BELSPO) projects CCAMBIO and MICROBIAN. The work of KL has been supported by the Masaryk University project MUNI/A/1251/2017: Integrated research of environmental changes in the landscape sphere III.
ACKNOWLEDGMENTS
We would like to thank Petr Kotas for help during the sampling and Igor S. Pessi for his contribution to molecular and bioinformatic analyses. We also acknowledge Benoit Durieu, Yannick Lara, and Jana Šnokhousová for laboratory help and Christophe Seppey for bioinformatic assistance.
SUPPLEMENTARY MATERIAL
The Supplementary Material for this article can be found online at: https://www.frontiersin.org/articles/10.3389/fevo. 2019.00393/full#supplementary-material
REFERENCES
ACIA (2005). Arctic Climate Impact Assessment.Cambridge: Cambridge University Press.
Ambrožová, K., and Láska, K. (2017). Air temperature variability in the vertical profile over the coastal area of Petuniabukta, central Spitsbergen. 38, 41–60. doi: 10.1515/popore-2017-0004
Belnap, J., and Lange, O. L. (2003). Biological Soil Crusts: Structure, Function, and Management. Springer-Verlag. doi: 10.1007/978-3-642-56475-8
Belnap, J., Rosentreter, R., Leonard, S., Kaltenecker, J. H., Williams, J., and Eldridge, D. (2001). Biological Soil Crust: Ecology and Manangement. Ecology and Manangement of Microbiotic Soil Crusts. Denver, CO: United States Department of the Interior Bureau of Land Management National Science and Technology Center Information and Communications Group.
Borchhardt, N., Baum, C., Mikhailyuk, T., and Karsten, U. (2017). Biological soil crusts of arctic svalbard-water availability as potential controlling factor for microalgal biodiversity. Front. Microbiol. 8:1485. doi: 10.3389/fmicb.2017.01485
Boutte, C., Grubisic, S., Balthasart, P., and Wilmotte, A. (2006). Testing of primers for the study of cyanobacterial molecular diversity by DGGE. J. Microbiol. Methods 65, 542–550. doi: 10.1016/j.mimet.2005.09.017
Bowker, M. A., Maestre, F. T., and Escolar, C. (2010). Biological crusts as a model system for examining the biodiversity-ecosystem function relationship in soils. Soil Biol. Biochem. 42, 405–417. doi: 10.1016/j.soilbio.2009.10.025
Büdel, B., and Colesie, C. (2014). “Biological soil crusts,” in Antarctic Terrestrial Microbiology: Physical and Biological Properties of Antarctic Soil Habitats, ed D Cowan (Berlin: Springer-Verlag), 131–161. doi: 10.1007/978-3-642-45213-0_8 Büdel, B., Duli´c, T., Darienko, T., Rybalka, N., and Friedl, T. (2016). “Cyanobacteria and Algae of Biological Soil Crusts,” in Biological Soil Crusts: An Organizing Principle in Drylands. Ecological Studies (Analysis and Synthesis), Vol. 226, eds B. Weber, B. Büdel, and J. Belnap (Cham: Springer), 55–80. doi: 10.1007/978-3-319-30214-0_4
ˇCapková, K., Hauer, T., ˇReháková, K., and Doležal, J. (2016). Some like it high! Phylogenetic diversity of high-elevation cyanobacterial community from biological soil crusts of western himalaya. Microb. Ecol. 71, 113–123. doi: 10.1007/s00248-015-0694-4
Caporaso, J. G., Kuczynski, J., Stombaugh, J., Bittinger, K., Bushman, F. D., Costello, E. K., et al. (2010). QIIME allows analysis of high-throughput community sequencing data. Nat. Publ. Gr. 7, 335–336. doi: 10.1038/nmeth.f.303
Cole, J. R., Wang, Q., Fish, J. A., Chai, B., McGarrell, D. M., Sun, Y., et al. (2014). Ribosomal database project: data and tools for high throughput rRNA analysis. Nucleic Acids Res. 42, 633–642. doi: 10.1093/nar/gkt1244
Colesie, C., Green, T. G. A., Türk, R., Hogg, I. D., Sancho, L. G., and Büdel, B. (2014). Terrestrial biodiversity along the Ross Sea coastline, Antarctica: lack of a latitudinal gradient and potential limits of bioclimatic modeling. Polar Biol. 37, 1197–1208. doi: 10.1007/s00300-014-1513-y
Edgar, R. C. (2013). UPARSE: highly accurate OTU sequences from microbial amplicon reads. Nat. Methods 10, 996–998. doi: 10.1038/nmeth.2604 Elster, J. (2002). Elster, J. (2002). “Ecological classification of terrestrial algal
communities of polar environment,” in Geoecology of Antarctic Ice-Free Coastal Landscapes, eds L. Beyer and M. Bolter (Berlin; Heidelberg: Springer-Verlag), 303–326. doi: 10.1007/978-3-642-56318-8_17
Elster, J., and Benson, E. (2004). “Life in polar terrestrial environmentawith a focus on algae and cyanobacteria,” in Life in the Frozen State, eds B. J. Fuller, N. Lane, and E. E. Benson (Florida, FL: CRC Press), 111–150. doi: 10.1201/9780203647073.ch3
Elster, J., Lukešová, A., Svoboda, J., Kopecký, J., and Kanda, H. (1999). Diversity and abundance of soil algae in the polar desert, Sverdrup Pass, central Ellesmere Island. Polar Rec. 35:231. doi: 10.1017/S0032247400015515
French, H. M. (2007). The Periglacial Environment. 3d ed. Chichester: Wiley & Sons. doi: 10.1002/9781118684931
Hall, T. A. (1999). BioEdit: a user-friendly biological sequence alignment editor and analysis program for Windows 95/98/NT. Nucleic Acids Symp. Ser. 41, 95–98.
Hanáˇcek, M., Nývlt, D., Flašar, J., Stacke, V., Mida, P., Lehejˇcek, J., et al. (2013). New methods to reconstruct clast transport history in different glacial sedimentary environments: Case study for Old Red sandstone clasts from
polythermal Hørbyebreen and Bertilbreen valley glaciers, Central Svalbard. Czech Polar Rep. 3, 107–129. doi: 10.5817/CPR2013-2-13
Hillebrand, H., Dürselen, C. D., Kirschtel, D., Pollingher, U., and Zohary, T. (1999). Biovolume calculation for pelagic and benthic microalgae. J. Phycol. 35, 403–424. doi: 10.1046/j.1529-8817.1999.3520403.x
Housman, D. C., Powers, H. H., Collins, A. D., and Belnap, J. (2006). Carbon and nitrogen fixation differ between successional stages of biological soil crusts in the Colorado Plateau and Chihuahuan Desert. J. Arid Environ. 66, 620–634. doi: 10.1016/j.jaridenv.2005.11.014
Hrbáˇcek, F., Láska, K., and Engel, Z. (2016). Effect of snow cover on the active-layer thermal regime – a case study from James Ross Island, Antarctic Peninsula. Permafr. Periglac. Process. 27, 307–315. doi: 10.1002/ppp.1871
Hu, C., Gao, K., and Whitton, B. A. (2012). “Semi-arid regions and deserts,” in Ecology of Cyanobacteria II: Their Diversity in Space and Time, ed B. A. Whitton (Springer Science+Business Media B.V.), 345–369. doi: 10.1007/978-94-007-3855-3_12
Huang, L., Zhang, Z., and Li, X. (2014). Carbon fixation and its influence factors of biological soil crusts in a revegetated area of the Tengger Desert, northern China. J. Arid Land 6, 725–734. doi: 10.1007/s40333-014-0027-3
Janatková, K., ˇReháková, K., DoleŽal, J., Šimek, M., Chlumská, Z., Dvorský, M., et al. (2013). Community structure of soil phototrophs along environmental gradients in arid Himalaya. Environ. Microbiol. 15, 2505–2516. doi: 10.1111/1462-2920.12132
Kaštovská, K., Elster, J., Stibal, M., and Šantruˇcková, H. (2005). Microbial assemblages in soil microbial succession after glacial retreat in Svalbard (high arctic). Microb. Ecol. 50, 396–407. doi: 10.1007/s00248-005-0 246-4
Kaštovská, K., Stibal, M., Šabacká, M., ˇCerná, B., Šantruˇcková, H., and Elster, J. (2007). Microbial community structure and ecology of subglacial sediments in two polythermal Svalbard glaciers characterized by epifluorescence microscopy and PLFA. Polar Biol. 30, 277–287. doi: 10.1007/s00300-006-0181-y
Katoh, K., and Standley, D. M. (2013). MAFFT multiple sequence alignment software version 7: improvements in performance and usability. Mol. Biol. Evol. 30, 772–780. doi: 10.1093/molbev/mst010
Kipp, V. (2004). Biodiversität und phylogenetische Stellung eukaryotischer Algen in kalzifizierenden Biofilmen (Diploma thesis). Universität Göttingen. Langhans, T. M., Storm, C., and Schwabe, A. (2009). Biological soil crusts and
their microenvironment: impact on emergence, survival and establishment of seedlings. Flora Morphol. Distrib. Funct. Ecol. Plants 204, 157–168. doi: 10.1016/j.flora.2008.01.001
Langhans, T. M., Storm, C., and Schwabe, A. (2010). Regeneration processes of biological soil crusts, macro-cryptogams and vascular plant species after fine-scale disturbance in a temperate region: recolonization or successional replacement? Flora Morphol. Distrib. Funct. Ecol. Plants 205, 46–60. doi: 10.1016/j.flora.2008.12.001
Láska, K., Witoszová, D., and Prošek, P. (2012). Weather patterns of the coastal zone of Petuniabukta, central Spitsbergen in the period 2008-2010. Polish Polar Res. 33, 297–318. doi: 10.2478/v10183-012-0025-0
Leung, A. K., Garg, A., and Ng, C. W. W. (2015). Effects of plant roots on soil-water retention and induced suction in vegetated soil. Eng. Geol. 193, 183–197. doi: 10.1016/j.enggeo.2015.04.017
Lozupone, C., and Knight, R. (2005). UniFrac : a new phylogenetic method for comparing microbial communities unifrac : a new phylogenetic method for comparing microbial communities. Appl. Environ. Microbiol. 71, 8228–8235. doi: 10.1128/AEM.71.12.8228-8235.2005
Martineau, E., Wood, S. A., Miller, M. R., Jungblut, A. D., Hawes, I., Webster-Brown, J., et al. (2013). Characterisation of Antarctic cyanobacteria and comparison with New Zealand strains. Hydrobiologia 711, 139–154. doi: 10.1007/s10750-013-1473-1
McDonald, D., Price, M. N., Goodrich, J., Nawrocki, E. P., DeSantis, T. Z., Probst, A., et al. (2012). An improved Greengenes taxonomy with explicit ranks for ecological and evolutionary analyses of bacteria and archaea. ISME J. 6, 610–618. doi: 10.1038/ismej.2011.139
Nayak, S., and Prasanna, R. (2007). Soil pH and its role in cyanobacterial abundance and diversity in rice field soils. Appl. Ecol. Environ. Res. 5, 103–113. doi: 10.15666/aeer/0502_103113
Newsham, K. K., Pearce, D. A., and Bridge, P. D. (2010). Minimal influence of water and nutrient content on the bacterial community
composition of a maritime Antarctic soil. Microbiol. Res. 165, 523–530. doi: 10.1016/j.micres.2009.11.005
Nübel, U., Garcia-Pichel, F., and Muyzer, G. (1997). PCR primers to amplify 16S rRNA genes from cyanobacteria. Appl. Environ. Microbiol. 63, 3327–3332. Pessi, I. S., Maalouf, P., de, C., Laughinghouse, I. V., H. D., Baurain, D., and
Wilmotte, A. (2016). On the use of high-throughput sequencing for the study of cyanobacterial diversity in Antarctic aquatic mats. J. Phycol. 52, 356–368. doi: 10.1111/jpy.12399
Pessi, I. S., Pushkareva, E., Lara, Y., Borderie, F., Wilmotte, A., and Elster, J. (2018). Marked succession of cyanobacterial communities following glacier retreat in the high Arctic. Microb. Ecol. 77, 136–147. doi: 10.1007/s00248-018-1203-3 Philippot, L., Raaijmakers, J. M., Lemanceau, P., and Van Der Putten, W. H. (2013).
Going back to the roots: the microbial ecology of the rhizosphere. Nat. Rev. Microbiol. 11, 789–799. doi: 10.1038/nrmicro3109
Pietrasiak, N., Regus, J. U., Johansen, J. R., Lam, D., Sachs, J. L., and Santiago, L. S. (2013). Biological soil crust community types differ in key ecological functions. Soil Biol. Biochem. 65, 168–171. doi: 10.1016/j.soilbio.2013.05.011
Prach, K., Klimešová, J., Košnar, J., Redˇcenko, O., and Hais, M. (2012). Variability of contemporary vegetation around Petuniabukta, central Spitsbergen. Polish Polar Res. 33, 383–394. doi: 10.2478/v10183-012-0026-z
Pushkareva, E., and Elster, J. (2013). Biodiversity and ecological classification of cryptogamic soil crusts in the vicinity of Petunia Bay, Svalbard. Czech Polar Rep. 3, 7–18. doi: 10.5817/CPR2013-1-3
Pushkareva, E., Johansen, J. R., and Elster, J. (2016). A review of the ecology, ecophysiology and biodiversity of microalgae in Arctic soil crusts. Polar Biol. 39, 2227–2240. doi: 10.1007/s00300-016-1902-5
Pushkareva, E., Kvíderová, J., Šimek, M., and Elster, J. (2017). Nitrogen fixation and diurnal changes of photosynthetic activity in Arctic soil crusts at different development stage. Eur. J. Soil Biol. 79, 21–30. doi: 10.1016/j.ejsobi.2017.02.002 Pushkareva, E., Pessi, I. S., Wilmotte, A., and Elster, J. (2015). Cyanobacterial community composition in Arctic soil crusts at different stages of development. FEMS Microbiol. Ecol. 91:fiv143. doi: 10.1093/femsec/fiv143
ˇReháková, K., Chlumská, Z., and Doležal, J. (2011). Soil cyanobacterial and microalgal diversity in dry mountains of Ladakh, NW Himalaya, as related to site, altitude, and vegetation. Microb. Ecol. 62, 337–346. doi: 10.1007/s00248-011-9878-8
Richardson, A. E., and Simpson, R. J. (2011). Soil microorganisms
mediating phosphorus availability. Plant Physiol. 156, 989–996.
doi: 10.1104/pp.111.175448
Rippin, M., Borchhardt, N., Williams, L., Colesie, C., Jung, P., Büdel, B., et al. (2018). Genus richness of microalgae and Cyanobacteria in biological soil crusts from Svalbard and Livingston Island: morphological versus molecular approaches. Polar Biol. 41, 909–923. doi: 10.1007/s00300-018-2252-2 Stanier, R. Y., Deruelles, J., Rippka, R., Herdman, M., and Waterbury, J. B.
(1979). Generic assignments, strain histories and properties of pure cultures of cyanobacteria. Microbiology 111, 1–61. doi: 10.1099/00221287-111-1-1 Stewart, K. J., Grogan, P., Coxson, D. S., and Siciliano, S. D. (2014). Topography
as a key factor driving atmospheric nitrogen exchanges in arctic terrestrial
ecosystems. Soil Biol. Biochem. 70, 96–112. doi: 10.1016/j.soilbio.2013. 12.005
Szczucinski, W., and Rachlewicz, G. (2007). Geological setting of the Petuniabukta Region. Landf. Anal. 5, 212–215.
Tamura, K., Stecher, G., Peterson, D., Filipski, A., and Kumar, S. (2013). MEGA6: molecular evolutionary genetics analysis version 6.0. Mol. Biol. Evol. 30, 2725–2729. doi: 10.1093/molbev/mst197
Tashyreva, D., and Elster, J. (2012). “Production of dormant stages and stress resistance of polar cyanobacteria,” in Life on Earth and Other Planetary Bodies, Cellular Origin, Life in Extreme Habitats and Astrobiology, eds A. Hanslmeier, S. Kempe, and J. Seckbach (Dordrecht: Springer Science+Business Media Dordrecht), 367–386. doi: 10.1007/978-94-007-4966-5_21
Taton, A., Grubisic, S., Ertz, D., Hodgson, D. A., Piccardi, R., Biondi,
N., et al. (2006). Polyphasic study of antarctic cyanobacterial
strains. J. Phycol. 42, 1257–1270. doi: 10.1111/j.1529-8817.2006.
00278.x
Tillett, D., and Neilan, B. A. (2000). Xanthogenate nucleic acid isolation from cultured and environmental cyanobacteria. J. Phycol. 36, 251–258. doi: 10.1046/j.1529-8817.2000.99079.x
Westermann, S., Lüers, J., Langer, M., Piel, K., and Boike, J. (2009). The annual surface energy budget of a high-arctic permafrost site on Svalbard, Norway. Cryosph 3, 245–263. doi: 10.5194/tc-3-245-2009
White, T. J., Bruns, T., Lee, S., and Taylor, J. (1990). “Amplification and direct sequencing of fungal ribosomal RNA genes for phylogenetics,” in PCR Protocols, eds M. A. Innis, D. H. Gelfand, J. J. Sninsky, and T. J. White (Academic Press), 315-322. doi: 10.1016/B978-0-12-372180-8.50042-1
Williams, L., Loewen-Schneider, K., Maier, S., and Büdel, B. (2016). Cyanobacterial diversity of western European biological soil crusts along a latitudinal gradient. FEMS Microbiol. Ecol. 92:fiw157. doi: 10.1093/femsec/fiw157
Yilmaz, M., Phlips, E. J., and Tillett, D. (2009). Improved methods for the isolation of cyanobacterial dna from environmental samples. J. Phycol. 45, 517–521. doi: 10.1111/j.1529-8817.2009.00651.x
Yoshitake, S., Uchida, M., Koizumi, H., Kanda, H., and Nakatsubo, T. (2010). Production of biological soil crusts in the early stage of primary succession on a High Arctic glacier foreland. N. Phytol. 186, 451–460. doi: 10.1111/j.1469-8137.2010.03180.x
Conflict of Interest:The authors declare that the research was conducted in the absence of any commercial or financial relationships that could be construed as a potential conflict of interest.
Copyright © 2019 Pushkareva, Wilmotte, Láska and Elster. This is an open-access article distributed under the terms of the Creative Commons Attribution License (CC BY). The use, distribution or reproduction in other forums is permitted, provided the original author(s) and the copyright owner(s) are credited and that the original publication in this journal is cited, in accordance with accepted academic practice. No use, distribution or reproduction is permitted which does not comply with these terms.