Assessing chlorinated ethene degradation in a large scale contaminant
plume by dual carbon
–chlorine isotope analysis and quantitative PCR
Daniel Hunkeler
a,⁎
, Yumiko Abe
a, Mette M. Broholm
b, Simon Jeannottat
a, Claus Westergaard
c,
Carsten Suhr Jacobsen
e,f, Ramon Aravena
d, Poul L. Bjerg
baCentre for Hydrogeology and Geothermics, University of Neuchâtel, Neuchâtel, Switzerland bDepartment of Environmental Engineering, Technical University of Denmark, Lyngby, Denmark cOrbicon, Viborg, Denmark
dDepartment of Earth and Environmental Sciences, University of Waterloo, Waterloo, Canada eGeological Survey of Denmark and Greenland, Copenhagen, Denmark
fDepartment of Basic Sciences and Environment, Faculty of Life Sciences, Copenhagen University, Copenhagen, Denmark
a b s t r a c t
The fate of chlorinated ethenes in a large contaminant plume originating from a tetrachloroethene (PCE) source in a sandy aquifer in Denmark was investigated using novel methods including compound-specific carbon and chlorine isotope analysis and quantitative real-time polymerase chain reaction (qPCR) methods targeting Dehaloccocoides sp. and vcrA genes. Redox conditions were characterized as well based on concentrations of dissolved redox sensitive compounds and sulfur isotopes in SO42−.
In the first 400 m downgradient of the source, the plume was confined to the upper 20 m of the aquifer. Further downgradient it widened in vertical direction due to diverging groundwaterflow reaching a depth of up to 50 m. As the plume dipped downward and moved away from the source, O2and NO3−decreased to below detection levels, while dissolved Fe2+and SO42−increased above
detectable concentrations, likely due to pyrite oxidation as confirmed by the depleted sulfur isotope signature of SO42−. In the same zone, PCE and trichloroethene (TCE) disappeared and
cis-1,2-dichloroethene (cDCE) became the dominant chlorinated ethene. PCE and TCE were likely transformed by reductive dechlorination rather than abiotic reduction by pyrite as indicated by the formation of cDCE and stable carbon isotope data. TCE and cDCE showed carbon isotope trends typical for reductive dechlorination with an initial depletion of13C in the daughter products followed by an enrichment of13C as degradation proceeded. At 1000 m downgradient of the
source, cDCE was the dominant chlorinated ethene and had reached the sourceδ13C value
confirming that cDCE was not affected by abiotic or biotic degradation.
Further downgradient (up to 1900 m), cDCE became enriched in13C by up to 8‰ demonstrating
its further transformation while vinylchloride (VC) concentrations remained low (b1 μg/L) and ethene was not observed. The correlated shift of carbon and chlorine isotope ratios of cDCE by 8 and 3.9‰, respectively, the detection of Dehaloccocides sp genes, and strongly reducing conditions in this zone provide strong evidence for reductive dechlorination of cDCE. The significant enrichment of13C in VC indicates that VC was transformed further, although the
mechanism could not be determined. The transformation of cDCE was the rate limiting step as no accumulation of VC occurred. In summary, the study demonstrates that carbon–chlorine isotope analysis and qPCR combined with traditional approaches can be used to gain detailed insight into the processes that control the fate of chlorinated ethenes in large scale plumes.
Keywords: Groundwater Chlorinated ethenes Biodegradation Stable isotopes qPCR
⁎ Corresponding author. Centre for Hydrogeology and Geothermics, University of Neuchâtel, Rue Emile Argand 11, CH-2009 Neuchâtel, Switzerland. Tel.: + 41 32 718 25 60; fax: + 41 32 718 26 03.
1. Introduction
Chlorinated ethenes such as tetrachloroethene (PCE) and trichloroethene (TCE) had been widely used as solvents for more than 50 years. As a result of heavy use of PCE and TCE, many aquifers in the industrially developed world are contaminated by them (Squillace et al., 1999). Due to their complex distribution in the subsurface, engineered remedi-ation of DNAPL contaminated sites is challenging. Hence, natural attenuation of these contaminants in aquifers has gained significant interest as an alternative or complemen-tary remedial strategy (Wiedemeier et al., 1999). Chlorinated ethenes can be degraded by different pathways depending on the redox conditions. During reductive dechlorination, chlo-rinated ethenes serve as electron acceptors (Holliger et al., 1993). Sequential reductive dechlorination of PCE yields TCE, cis-dichloroethene (cDCE), vinyl chloride (VC), and eventu-ally ethene and ethane. As the number of chlorine substi-tuents decreases, the tendency of chlorinated ethenes to become dechlorinated decreases, and consequently more strongly reducing conditions are required (Bradley, 2000). Frequently, cDCE and VC accumulate as a result of incomplete reductive dechlorination caused by an inadequate redox potential, the lack of available electron donor or absence of specific bacteria able to reductively dechlorinate these compounds (Friis et al., 2006a,b). Complete reductive dechlorination of PCE to ethene has been observed in mixed and enriched culture studies (Bradley, 2000; Freedman and Gossett, 1989), but to date the genus Dehalococcoides which utilizes H2 as the electron donor is the only isolated and
identified group of microorganisms which dechlorinate cDCE and VC to ethene (Cupples et al., 2003; He et al., 2003; Loffler et al., 2000; Maymo-Gatell et al., 1999). In addition to reductive dechlorination, microbial oxidation of cDCE and VC to CO2 has been observed under aerobic (Bradley and Chapelle, 1998, 2000b), iron/manganese-reducing conditions (Bradley and Chapelle, 1997; Bradley et al., 1998b; Jennings et al., 2009) and with humic acids as electron acceptor (Bradley et al., 1998a). However, more recent studies demonstrated that low levels of O2are sufficient for aerobic
VC oxidation (Gossett, 2010) and might also explain VC oxidation in earlier seemingly anoxic microcosms. Fermen-tative degradation of VC to methane and to CO2via acetate
under methanogenic conditions has also been reported (Bradley and Chapelle, 2000a). Apart from the microbial degradation pathways, iron-bearing minerals such as pyrite and magnetite are known to abiotically reduce PCE, TCE and cDCE to acetylene via dichloroelimination and VC to ethene by reductive dechlorination (Lee and Batchelor, 2002). Acetylene can be further transformed to acetaldehyde, acetate and ethanol as observed in a laboratory study (Liang et al., 2009).
Although much is known about the degradation pathways of chlorinated ethenes, the field demonstration of their degradation remains challenging especially for cDCE and VC that can be degraded to different products. Recently, new tools have been proposed to identify and quantify chlorinated ethene degradation including compound-specific stable car-bon and chlorine isotope analysis (Abe et al., 2009b) and quantitative real-time polymerase chain reaction (qPCR) (Scheutz et al., 2008). The advances in qPCR methods make
it possible to link the detection of specific bacteria to the occurrence of contaminant degradation (Hendrickson et al., 2002; Lu et al., 2006). So far compound-specific isotope analysis has mainly focused on carbon isotopes and it was demonstrated that reductive dechlorination is associated with significant carbon isotope fractionation, especially for cDCE and VC transformation (Hunkeler et al., 1999). Carbon isotope enrichment factor ranging from −14.1 to −29.7‰ were reported for cDCE and from−21.4 to −30.3‰ for VC (Hunkeler and Morasch, 2010). Abiotic reductive dechlorina-tion of TCE by pyrite was also shown to cause strong carbon isotope fractionation with a carbon isotope enrichment factor of−21.7‰ (Liang et al., 2009). Carbon isotope analysis has been used to demonstrate reductive dechlorination in groundwater (Hunkeler et al., 1999; Sherwood Lollar et al., 2001; Imfeld et al., 2008;) and streambed sediments (Abe et al., 2009a). However, when using isotopes to differentiate between degradation pathways, a dual isotope approach is usually preferable because the relative shift of isotope ratios of two elements usually varies depending on the pathway (Elsner et al., 2005). Combined carbon and chlorine isotope analysis has not been applied yet to gain insight into chlorinated ethene degradation at thefield scale for several reasons. There is less information available for chlorine isotope fractionation for different degradation pathways than for carbon isotopes. Recent laboratory studies have demonstrated that chlorine isotope fractionation during reductive dechlorination of cDCE and VC is significantly larger than during aerobic oxidation of cDCE and VC, highlighting the potential for using carbon–chlorine isotope analysis to identify reaction pathways (Abe et al., 2009b). However, the magnitude of chlorine isotope fractionation during abiotic transformation of chlorinated ethenes by reduced-iron phases and anaerobic oxidation of cDCE and VC are not known yet. The limited use of chlorine isotope analysis is also due to the difficulty of analyzing chlorine isotope ratios atfield relevant concentrations using conven-tional techniques and due to conceptual complexities in interpretation of chlorine isotope data given the high abun-dance of the heavy isotope. Recent advances in analytical methods have made it possible to measure chlorine isotope ratios rapidly atfield relevant concentrations without com-plex prepartion procedures (Shouakar-Stash et al., 2006). Furthermore, a theoretical framework was developed that demonstrates that chlorine isotope fractionation follows in good approximation to a Rayleigh trend despite the high abundance of the heavy isotopes (Elsner and Hunkeler, 2008). These developments open the possibility to apply a combined carbon–chlorine isotope approach at the field scale. The main goal of this study was to evaluate the fate of chlorinated ethenes in a large scale plume. In addition to the characterization of contaminant distribution and redox conditions, carbon and chlorine isotope analysis and qPCR were used to gain insight into the contaminant fate. The study provides thefirst field data for carbon versus chlorine isotope fractionation during degradation of cDCE, which is often the bottleneck for complete degradation of chlorinated ethenes. The investigated plume is situated up to 50 m below the surface and has a length of more than 2 km, which makes analytical tools that provide a maximum of information for each sampling location attractive in order to reduce drilling
costs. Of particular interest was the fate of cDCE and VC that were found at the plume front and whether these new tools make it possible to detect potentially slow but still relevant degradation of cDCE at the site. In addition, the occurrence of abiotic degradation by iron-bearing minerals was evaluated. 2. Study site
The study site is located in the town of Rødekro in southern Jutland, Denmark. The groundwater contamination was caused by a regional dry-cleaning facility which operated from 1967 to 1980. The dry cleaner only used PCE which might however have contained TCE as an impurity. PCE
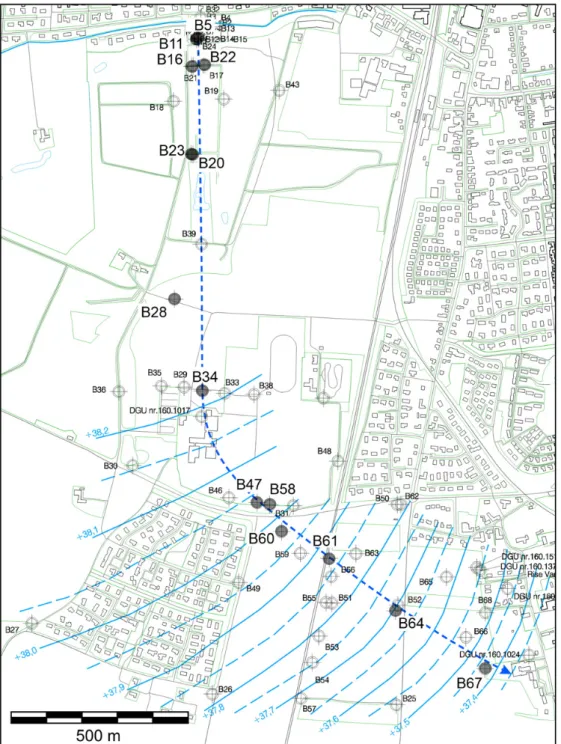
release occurred due to a leaking underground storage tank and/or leakage from dry-cleaning machines and pipes connecting the tank to the machines and other spills. Hydraulic head data from 55 multilevel monitoring wells and the contaminant distribution indicate that groundwater flows towards the south for approximately 1 km, and then alters its direction to the southeast (Fig. 1).
The geology of the aquifer is illustrated for a section parallel to the groundwater flow direction (Fig. 2). The unconfined aquifer of Quaternary age consists mainly of relatively homogeneous fluvio-glacial sand with occasional presence of gravel, silt and clay lenses (Fig. 2). This part of Jutland aquifers generally contain a very low level of organic
Fig. 1. Monitoring well locations at the site with groundwater equipotential lines (main sampling campaign, February 2006) and approximateflowline along the center of the plume (dashed line). Note that hydraulic heads were only measured for distancesN1000 m during the main sampling campaign. The geological section runs along theflowline.
matter and significant amounts of iron mainly in the amphibole/pyroxene fraction (Postma et al., 1991; Postma and Brockenhuusschack, 1987). The average hydraulic gradi-ent throughout the study area corresponded to 1.3‰. Based on a pumping test, the local hydraulic conductivity was estimated to be 6.5·10− 4m/s (55 m/day). Using Darcy's law and assuming a porosity of 0.3 typical for sand aquifers in Jutland (Postma et al., 1991), an average groundwater velocity of 0.24 m/day was obtained.
3. Study methods 3.1. Sampling campaigns
The plume characterization took place in several phases due to the large extension of the contamination. Preliminary investigations were carried out during the years 2001 to 2005 concurrently as monitoring wells were installed. A total of 55 multilevel wells with 150 screens were sampled for redox parameters (O2, NO3−, Mn2+, Fe2+, SO42−, CH4) and for
chlorinated ethenes, ethene and ethane concentrations after completing the well installation. Based on these preliminary investigations, 37 screens from 14 multilevel wells located along the core of the plume over a distance of nearly 2 km were selected for a more detailed investigation. These wells were sampled in February 2006 for contaminant concentra-tions and stable carbon isotope analysis. Samples from several wells were analyzed also for redox sensitive species (NO3−, SO42−, Fe2+, Mn2+, CH4) to evaluate the stability of
redox conditions at the site by comparing the data with the results from the previous campaigns after well installation. The contaminant concentrations and stable carbon isotope ratios shown in this study originate from this sampling campaign unless otherwise indicated and the sampling campaign is denoted as the main sampling campaign. Since concentrations of redox sensitive species generally varied by less than 30% between sampling campaigns, data sets from the preliminary investigations and the main sampling campaign were combined to characterize the redox condi-tions in the plume at greater spatial resolution. The results
from the preliminary and main sampling campaigns are summarized in Table S1.
In addition, two complementary smaller sampling campaigns were carried out in September 2006 and April 2007 at a total of 14 screens. The goal of these sampling campaigns was to determine additional parameters that provide insight into the fate of cDCE and VC focusing on the front of the plume where cDCE dominates. The measured parameters include carbon isotope ratios at low concentrations of VC, combined carbon–chlorine isotope analysis of cDCE, concentration measurements of ethene, ethane and acetylene, qPCR of Dehalococcoides cells/genes and sulfur isotope ratios of SO42−.
3.2. Groundwater sampling
Each monitoring location consists of 1 to 7 PVC pipes of a minimum of 63 mm diameter installed to different depths for multilevel sampling. Each PVC pipe has a screened interval ranging from 1 to 4 m. In general, smaller screened intervals (1 m) were installed in the source and near-source zones and larger screened intervals further downgradient. Groundwater was sampled after purging at least three well volumes of water using a submersible pump placed at 12 m below the ground level. Samples for anion and cation analyses were filtered with a sterile filter (0.45 μm) and collected in 100 mL polystyrene bottles. Samples for cation analysis were imme-diately acidified with 1 M nitric acid to pH 2 in the field. For the stable carbon and chlorine isotope analyses of chlorinated ethenes, samples were collected in 40 mL standard VOC glass vials without headspace. For stable carbon isotope analysis of VC at low concentrations, samples were collected in 1-L Schott bottles without headspace. For sulfur isotope analysis, duplicate samples of 500 mL were collected in Schott bottles. Samples for contaminant concentrations and stable carbon/ chlorine isotopes were collected without headspace, and stable isotope samples were treated immediately with concentrated NaOH to pH 10 to inactivate microbial activity. Samples for Dehalococcoides sp. cell and VC reductase A (vcrA) gene analyses were taken in 500 mL Schott bottles without headspace.
Fig. 2. Geological cross section along aflowline through the center of the plume indicated inFig. 1. Boreholes near theflowline were projected onto the cross section. Elevations are indicated in m above sea level (m asl). The numbers next to the wells indicate the well number in Table S1. WT: Water table.
3.3. Analyses
Temperature, pH, dissolved oxygen and the electric conduc-tivity of samples were measured on site. Major anion and cation concentrations were measured with an ion chromatograph (DX-120, Dionex, USA) with a detection limit of 0.5 mg/L. Dissolved iron was measured with a ICP-MS method with a detection limit of 10μg/L in the preliminary and main sampling campaign and colorimetrically (DR/890 Colorimeter, Hach, USA) during the complementary sampling campaigns (detection limit 30μg/L). Dissolved manganese was determined byflame atomic absorp-tion spectrometry with a detecabsorp-tion limit of 5 ug/L. Concentraabsorp-tions of chlorinated ethenes were determined by an accredited commercial laboratory using Purge&Trap GC-MS with detection limits of 0.02μg/L and relative standard deviations of 9.2% (PCE), 7.5% (TCE), 14% (cDCE) and 7.7% (VC). Ethene and methane was analyzed by the same laboratory using headspace GC-FID (detection limits of 10μg/L for ethene and methane), except for the complementary sampling campaigns. In the complementary sampling campaigns, the analyses were performed by a different laboratory using headspace GC-FID and additionally included ethane and acetylene concentrations with detection limits of 0.5μg/L for ethene and ethane, 5 μg/L for acetylene and 10 μg/L for methane. Concentrations of benzene, toluene, ethylbenzene and xylene-isomers (BTEX) were analyzed with a GC-FID after pentane extraction.
Carbon isotope ratios of chlorinated ethenes were analyzed by a GC coupled to an isotope ratio mass spectrometer (DeltaPlus XP, Thermo Scientific, USA) via a combustion interface. The system was equipped with a purge-and-trap concentrator (Velocity XPT, Teledyne Tekmar, USA) connected to a cryogenic trap. A 20-mL sample was purged for 10 min at the purging rate of 40 mL/min and cooled at a cryogenic trap at −140 °C. Minimum required concentrations for PCE, TCE, cDCE and VC carbon isotope analysis were approximately 5, 10, 10, and 5μg/L, respectively. In order to achieve a lower VC detection limit (0.2μg/L), a 1-L sample was purged for 20 min at the purging rate of 80 mL/min while stirring with a magnetic stirrer, followed by analysis using the same procedure as described above. Chlorine isotope analysis was performed as described previously ( Shoua-kar-Stash et al., 2006). All isotope ratios are reported relative to an international standard (VPDB for carbon, SMOC for chlorine) using the delta notationδ=(R/Rstd−1)⁎1000(‰) where R and
Rstd are the isotope ratio of the sample and the standard,
respectively.
Dehalococcoides sp. cells and VC reductase A (vcrA) genes were quantified using quantitative real-time polymerase chain reaction (qPCR). DNA was extracted from the centrifugation pellet of a 200-mL water sample using the Fast Soil DNA kit (BIO101, Carlsbad, CA) after a modified protocol including a freeze–heat step and extended bead beating as previously described (Baelum et al., 2006). The DNA was diluted and tested for purity by a green fluorescent protein gene test (Lindberg et al., 2007) and found sufficiently clean for the use for qPCR analysis with no inhibition of the reaction. A preliminary PCR analysis for bacterial DNA with general 16S primers confirmed the occurrence of DNA amplification. The presence of Dehalococcoides sp. gene was quantified using the primers specific to two sequences in the 16SrRNA gene of Dehalococcoides sp. in 16S rRNA (Hendrickson et al., 2002) as well as the vcrA gene (Holmes et al., 2006). First, a
determination in the 16SrRNA gene was carried out with the primer pair for the region between 774 and 1212 bp, followed by the more sensitive primer pair for the 1–259 bp region and finally with the vcrA primer pair. The quantification limits for Dehalococcoides sp. cells with primer 774–1212 and primer 1–259 are 2.2·106and 2.2·105cells/mL sample, respectively,
and the quantification limit for vcrA is 2.2·106cells/mL.
4. Results and discussion 4.1. Redox conditions
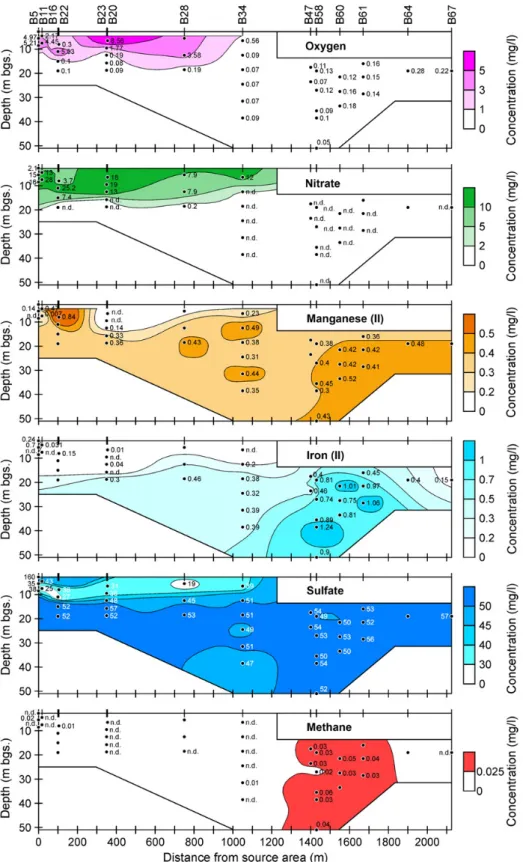
Concentrations of redox sensitive species analyzed in this study (Table S1) are illustrated in Fig. 3. In general, groundwater from less than 12 to 15 m below the surface containedN1 mg/L of O2and/or NO3−, suggesting oxidizing
conditions. At the location with the highest BTEX concen-tration (B5-3, 7.5μg/L), dissolved O2wasb0.5 mg/L and the
smallest NO3−concentration of the two source zone sampling
locations (B5 and B11) was measured (2.1 mg/L) indicating that the BTEX had some effect on the redox conditions. However, the presence of NO3−suggests that the BTEX did not
create strongly reducing conditions. Groundwater below 15 m depth was deprived of O2 and NO3− and contained
dissolved Mn2+, dissolved Fe2+, and elevated SO42−
concen-trations (Fig. 3). The redox conditions may be characterized as manganese/iron reducing in this area (Christensen et al., 2000). The correlation between the disappearance of O2and
NO3− and the increase of SO42− and Fe2+ concentrations
suggests that oxidation of pyrite takes place. Pyrite is known to be present in the sandy aquifers in Jutland (Postma et al., 1991), and pyrite oxidation with O2and NO3−was previously
observed at otherfield sites (Postma et al., 1991; Schwientek et al., 2008). Sulfur isotopes in SO42− were analyzed in
samples from several wells (B23-1/3/4, B34-2, and B58-2/4) to further evaluate the origin of the sulfate. Theδ34S values for SO42−varied between−2.6 and −5.0‰ which lies in the
typical range of−20 to 0‰ for SO42−originating from pyrite
oxidation (Clark and Fritz, 1997) and is distinctly different from values for modern marine SO42−(+ 21‰). Hence, the
trend towards more reducing conditions with depth is likely influenced by the presence of pyrite in deeper zones of the aquifer, although the pyrite distribution was not determined in the study.
In deeper zones of the aquifer and further downgradient (N1000 m) from the source, slightly higher Fe2+
concentra-tions (N0.5 mg/L) were detected indicating iron reducing conditions (Fig. 3). In addition, traces of methane were detected, despite high SO42−levels, which may originate from
strongly reducing zones within the clay and silt lenses. 4.2. Concentration evolution along the plume centerline
Fig. 4 shows the distribution of individual chlorinated ethenes in a vertical section along the plume centerline. The complete data set is provided in Table S1. The highest concentrations were detected in B5-3 and B11-3 close to the source. In these wells, PCE concentrations of respectively 96 mg/L (579μM) and 32 mg/L (193 μM) close to the PCE solubility were measured indicating that PCE DNAPL was likely present close to these wells (Table S1). In these two
wells, PCE amounts to more than 72% of the total chlorinated ethene concentration on a molar basis with the remainder consisting of TCE, cDCE and traces of VC (b0.1% to total) indicating that biodegradation is moderate in the source zone compared to further downgradient. In the first 400 m, the plume is present in the upper 20 m of the aquifer due to the presence of a clayey zone deeper down. It then plunges and
widens progressively likely due to diverging groundwater flow around a clay zone located further downgradient and groundwater recharge pushing the plume downwards (Fig. 3). As the plume dives to greater depth and migrates to greater distance from the source, it encounters more reducing conditions (see Section 4.1) For sampling points b15 m depth located within 1050 m from the source, PCE was
Fig. 3. Concentrations of redox sensitive species in a vertical section along the center of the plume indicated inFig. 1. The top boundary corresponds approximately to the location of the water table. Depths are indicated in meter below ground surface (m bgs).
generally present at the highest concentration of all chlori-nated ethenes, while in deeper zones cDCE domichlori-nated (Fig. 4). The locations where PCE was no longer dominant generally coincides with the locations where O2 and NO3−
concentrations were b0.5 mg/L and the SO42− and Fe2+
concentrations were elevated (Fig. 2, Table S1). PCE and TCE could be transformed by microbial reductive dechlorination. Once the strong oxidants O2and NO3−have been consumed,
PCE and TCE start to serve as electron acceptors. Alternatively, in the presence of pyrite, PCE and TCE may be transformed abiotically viaβ-elimination (Lee and Batchelor, 2002). The predominance of cDCE in deeper zones of the site demon-strates that reductive dechlorination of PCE and TCE occurs. Although acetylene was not detected at the site, a possible parallel transformation of PCE and TCE by β-elimination cannot be ruled out as acetylene may be further transformed to acetaldehyde, acetate and ethanol (Liang et al., 2009). Furthermore, the fate of cDCE is not clear based on the concentration data. It could potentially be oxidized coupled to the reduction of manganese (Bradley et al., 1998b). Alterna-tively, in the more reduced downgradient zone where methane is detected further reductive dechlorination could occur. However, VC is only detected in traces and ethene and
ethane concentrations are below 0.5μg/L (Table 1). Finally, cDCE may simply be transported further downgradient without any degradation.
4.3. Presence of Dehalococcoides sp. cells
The presence of Dehalococcoides sp. cells was investigated using qPCR based on water samples. The number of Dehalococcoides sp. cells and vcrA genes were below the quantification limit of 2.2·105cells/L and 2.2·106genes/L,
respectively. However, a signal for Dehalococcoides sp cells was detected with the most sensitive method (primer 1–259) in groundwater from wells B60-1 and B60-3 located close to the front of the plume (at 1550 m from the source, Fig. 4). Most studies report that the presence of Dehalococcoides sp. cells coincides with detectable level of VC and ethene (Hendrickson et al., 2002; Lu et al., 2006) andScheutz et al. (2008) found growth of Dehalococcoides containing vcrA genes to coincide with an increase in ethene concentrations. A study that compared Dehalococcoides sp. densities with cDCE dechlorination rates concluded that ratesN0.3 year− 1
occur where densities are N1·107cells/L (Lu et al., 2006).
Fig. 4. Concentration contours and stable carbon isotope ratios (δ13C
‰) in a vertical section along the center of the plume indicated inFig. 1. The top boundary corresponds approximately to the location of the water table. Depths are indicated in meter below ground surface (m bgs).
Based on this relationship, no or only slow reductive dechlorination of cDCE is expected to occur at the site. 4.4. Carbon and chlorine evolution along the plume centerline
Carbon isotope ratios (δ13C) of chlorinated ethenes (Table
S1) are illustrated inFig. 4. In the uppermost screen of well B5 (B5-3) in the source zone,δ13C of PCE, TCE and cDCE slightly
decreased in the respective order (−24.92, −26.18 and −26.35‰). The small difference among their δ13C values
might be caused by nearly complete transformation of small amounts of PCE to TCE and to cDCE in some zones accompanied by re-dissolution of PCE from the DNAPL source. Indeed, PCE concentrations close to solubility in B5-3 (96 mg/L or 579μM) and B11-3 (32 mg/L or 193μM) confirm that they are located in the source zone. Similarδ13C values for PCE, TCE and cDCE in the
source zone were previously observed at other field sites (Hunkeler et al., 1999). The concentration-weighted average δ13C (denoted as isotope balance) at well B5-3 of−25.03‰ can
be considered to represent the isotope ratio of the PCE source. The averageδ13C of PCE, TCE and cDCE leaving the source zone
(average of B5-1/2/3 and B11-2/3) corresponded to−25.6‰, −25.9‰ and −25.1‰, respectively. In the following, the isotope evolution isfirst discussed for the zone where PCE and TCE disappeared (up to 1050 m) and then for the front of the plume further downgradient.
Between 400 and 1050 m of the plume, PCE became enriched in13C with increasing depth and distance,
demon-strating its transformation (Fig. 4). The TCE became depleted in13C compared to its source value in deeper zones of B23 (350 m), while it has a similar δ13C as the source in B28
(750 m) andfinally became enriched in13C in the two deeper
sampling points of B34 (1050 m). The cDCE became also depleted in 13C in the deeper zones of B23 (−41.78 and
−38.47‰) and B28 (−31.77‰). However, its δ13C reached a
value of around−25‰ in deeper zones of well B34 where the
highest cDCE concentrations were detected. These trends are consistent with reductive dechlorination of PCE to TCE and cDCE. Reductive dechlorination leads to production of daughter products that are initially depleted in13C explaining
the trends towards more negativeδ13C of TCE and cDCE. As reductive dechlorination proceeds, the intermediates become enriched in13C as observed for TCE while thefinal product
approaches the isotope signature of the source. Hence, the carbon isotope data confirm that PCE and TCE are trans-formed by reductive dechlorination rather than by abiotic reaction with pyrite. In the latter case, TCE and cDCE would not become depleted in13C compared to the source as these compounds are not produced in significant quantities by abiotic PCE/TCE reduction with pyrite. Furthermore, if PCE and TCE were degraded by β-elimination in addition to reductive dechlorination, the remaining cDCE should become enriched in13C compared to the source value. Assuming that the isotope enrichment factor for β-elimination of PCE and cDCE are in a similar range as for TCE, the transformation of as little as 5% of the PCE, TCE or cDCE byβ-elimination would lead to a shift inδ13C larger than 2‰. The good agreement of
the δ13C of cDCE in deeper zones of B34 (−24.35 to
−25.90‰) with the source PCE (−25.03‰) demonstrates that PCE and TCE are predominantly transformed by reductive dechlorination and that no significant degradation beyond cDCE occurs in thefirst 1050 m of the plume.
In contrast, at the plume front between B47 (1550 m) and B64 (1900 m), cDCE and VC become enriched in 13C
reaching values of up to−17.49 and −12.56‰, respectively (Fig. 4). Furthermore, the concentration-weighted average δ13C value of all detected chlorinated ethenes shifts from
−25.56‰ in B58 to −16.82‰ in B60 (Table 1). These trends indicate the loss of carbon from the pool of chlorinated ethene species and that both cDCE and VC are transformed to one or several non-chlorinated products. Transformation may occur by sequential reductive dechlorination. However,
Table 1
Concentrations, stable isotope ratios and detection of Dehalococcoides sp. cells in sampling points at the plume front. Sampling took place during the main sampling campaign in Feb. 2006 unless otherwise indicated.–: not measured; +: detected but below the quantification limit. The source d13C value is estimated to
be−25.0‰. The locations of the wells are given inFig. 1and 2. Well
number
Depth Isotope balance d13C
cDCE VC Ethenea Ethanea Acetylenea Dehalococcoides
δ13C δ37Cl δ13C
m ‰ VPDB ug/L ‰ VPDB ‰ VSMOC ug/L ‰ VPDB ug/L ug/L ug/L DNAacells/ml
B34-2b −31.5 −24.43 560 −24.35c/−23.75d 7.2c/5.7d 0.98 −30.63 b0.5d b0.5d b5d b2.2∙105 B58-6 −19 −25.50 100.4 −25.50 – 0.62 −25.38c – – – – B58-5 −27 −25.54 96.3 −25.54/−25.50d 6.76d 0.70 −25.59c b0.5d b0.5d b5d – B58-4 −35.5 −25.56 110.5 −25.56/−25.07d 6.79d 0.56 −23.02c b0.5d b0.5d b5d – B58-3 −38.5 −24.99 69.2 −25.04/– – 0.60 −21.42c – – – – B58-2 −51 −24.35 37.1 −24.35/−24.26d 7.19d 0.73 −17.98c b0.5d b0.5d b5d b2.2∙105 B60-3 −21.5 −24.78 130.3 −24.78/−25.10d 6.78d 0.90 −24.58c b0.5′/d b0.5c/d b5′cd +e B60-2 −27.5 −25.12 230.6 −25.13/−23.73d 7.27d 0.73 −23.12c b0.5′/″ b0.5c//d b5c/d b2.2∙105 B60-1 −33.5 −16.82 12.1 −/−17.49d 10.61d 0.73 −16.82c b0.5″ b0.5d b5d +e B61-3 −16 −23.41 18.1 −23.58c/−23.67d 7.76d 0.25 −15.34c – – – b2.2∙105 B61-2 −21.5 −23.92 70.2 −24.00c/−24.21d 7.8′/7.5d 0.65 −18.75c b0.5′/″ b0.5c/d b5c/d b2.2∙105 B61-1 −28.5 −21.01 13.0 −21.73c/−21.48d 9.1′/8.67d 0.72 −12.56c b0.5′/″ b0.5c/d b5c/d b2.2∙105 B64 −19 −20.51 5.7 −20.92/−20.90c 9.0c 0.27 −15.07c b0.5′/″ b0.5c/d b5c/d – a Also measured at B23-1/3/4 but not detected.
b Depth with highest cDCE concentration. c Sampled in Sept. 2006.
d Sampled in April 2007.
ethene and ethane remained below 1μg/L at the front of the plume (Table 1), which could indicate that anaerobic oxidation or abiotic degradation may play a role.
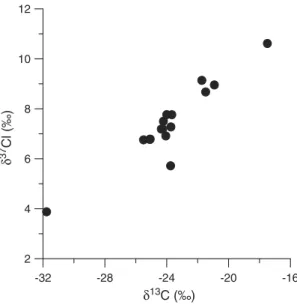
4.5. Carbon and chlorine isotope evolution at the plume front In order to gain additional insight into the degradation mechanism, chlorine isotope ratios of cDCE were measured for wells at the plume front (Table 1). For reductive dechlorination a significant Cl isotope effect occurs since C–Cl bonds are involved in the initial transformation step. For anaerobic oxidation, the isotope effect is not known yet but is expected to be smaller because the initial step likely involves the electron rich C–C bond and hence does not significantly affect chlorine isotope ratios. The chlorine isotope ratio steadily increased at the plume front (Fig. 5) and the shift inδ37Cl correlated well with the shift inδ13C (Fig. 5). Theδ37Cl
versusδ13C shift (0.48 ± 0.05‰) was larger than in a previous
laboratory study (0.081 ± 0.004‰) with an enrichment culture containing Dehalococcoides ethenogenes (Abe et al., 2009b). The stronger chlorine isotope fractionation at the field site could be due to the presence of other cDCE dechlorinating microorganisms or a contribution of abiotic cDCE degradation to acetylene and further products (Lee and Batchelor, 2002). Since reference fractionation factors for abiotic degradation and different cDCE degrading strains are currently lacking, it is not possible to distinguish between these two possibilities. Dehalococcoides DNA and traces of methane were detected in the front of the plume indicating conditions under which complete reductive dechlorination can occur (Fig. 3). These observations suggest that reductive dechlorination at least partially contributed to cDCE degra-dation at the plume front.
The strong enrichment of 13C in VC demonstrates that
transformation of VC occurred although ethene and ethane wereb1 μg/L. It was not possible to measure δ37Cl values for VC due to its low concentrations (b1 μg/L). VC could be trans-formed by reductive dechlorination, which is associated with strong carbon isotope fractionation, followed by a further
degradation of ethene as observed in a previous study (Bradley and Chapelle, 2002). Alternatively, VC could be transformed to CO2and CH4(Bradley and Chapelle, 1999a,b, 2000a).
Thermo-dynamic considerations indicate that the mechanism could involve a highly exergonic reductive dechlorination step (Dolfing, 1999), and thus this pathway would be associated with strong carbon isotope fractionation as well. Hence, while carbon isotope ratios of VC indicate significant degradation of VC, the degradation mechanism cannot be identified unequiv-ocally. VC concentrations remain low likely because VC transformation is faster than VC production. This hypothesis is consistent with the stronger enrichment of13C in VC than cDCE at the plume front as expected when the consumption of the intermediate (VC) is more rapid than its production (Van Breukelen et al., 2005). Hence, transformation of cDCE is likely the rate limiting step for complete chlorinated ethene degradation at the plume front.
5. Conclusions
At sites with variable redox conditions and the presence of pyrite, such as the one presented in this study, multiple degradation processes can potentially occur including biotic reductive dechlorination, abiotic β-elimination, and biotic oxidation of lower chlorinated by-products under oxic or anoxic conditions. The study indicates that carbon isotopes are suitable for determining the relative importance of reductive dechlorination versusβ-elimination for the trans-formation of the highly chlorinated ethenes. Concentration analysis alone would make it difficult to evaluate the significance of β-elimination as the characteristic degradation product, acetylene, is rapidly transformed further (Liang et al., 2009). The carbon isotope approach relies on the preferential removal of isotopically light chlorinated ethene molecules during β-elimination, which leads to a strong enrichment of13C in the remaining chlorinated ethene and ethene pool. This isotope enrichment is detected if as little as 5% of the chlorinated ethenes are transformed by β-elimination. Using this approach, it was possible to demon-strate that β-elimination played no significant role in chlorinated ethene transformation in thefirst 1050 m of the site despite the presence of pyrite. One of the limitations of the approach is that the carbon isotope balance of chlorinated ethenes can, in some instances, shift solely due to the differential retardation of various chlorinated ethenes (Van Breukelen et al., 2005). The combined use of carbon and chlorine isotope analysis could potentially be used to confirm the role of the two processes. However, chlorine versus carbon isotope fractionation during reductive dechlorination andβ-elimination are not yet available.
Another key question at sites with chlorinated ethenes is often whether complete or only partial degradation occurs. While reductive dechlorination can usually be evaluated based on the accumulation of intermediate products, it is virtually impossible to demonstrate transformation pathways leading to common compounds such as CO2, Cl− and CH4
based on concentration analysis. This study clearly demon-strates the value of isotope analysis to assess the degradation of cDCE and VC at the plume front. While a shift in the carbon isotope ratio clearly indicated transformation, it remains difficult to identify the degradation mechanism, which is a
-32 -28 -24 -20 -16 δ13C (‰) 2 4 6 8 10 12 δ 37 Cl (‰)
Fig. 5. Correlation of chlorine and carbon isotope ratios of cis-1,2-dichloroethene for wells at the plume front (seeTable 1) and wells B23-4 and B28-1.
prerequisite to quantify degradation based on isotope data. The use of combined carbon–chlorine isotope analysis and the detection of specific microorganisms at the functional gene level can provide additional insight into degradation mechanisms. In this study, both carbon/chlorine isotope analysis, suggesting cleavage of C–Cl bonds, and qPCR, demonstrating the presence of Dehalococcoides sp., are consistent with the occurrence of reductive dechlorination at the plume front. However, the utilized qPCR approach will only reveal known microorganisms and hence provides an incomplete picture of the microbial processes occurring at the plume front. Once the degradation processes are identified, carbon isotope data can be evaluated in a quantitative manner. Assuming that cDCE is transformed by reductive dechlorination and taking into account the range of isotope enrichment factors observed for reductive dechlorination of cDCE (−14.1 to −29.7‰, (Hunkeler and Morasch, 2010)), a detectable shift inδ13C (2‰) is expected after 6–13% of the
cDCE was degraded. Hence the isotope method is very sensitive to detect cDCE degradation. For VC, carbon isotope enrichment factors are even larger and hence less degrada-tion is needed for a noticeableδ13C shift.
In summary, the study demonstrates that the combination of stable isotope analysis and methods of molecular micro-biology has a high potential to identify and also quantify degradation processes at chlorinated ethene contaminated sites. The methods are currently limited by the lack of reference values for chlorine isotope fractionation and the lack of knowledge of some of the microorganisms that are involved in the degradation process.
Supplementary materials related to this article can be found online atdoi:10.1016/j.jconhyd.2010.09.009.
Acknowledgements
The authors gratefully acknowledge the site access, information and funding provided by the Region of Southern Denmark and The Danish Ministry of The Environment. The authors also thank the two anonymous reviewers and the editor for their helpful comments.
References
Abe, Y., Aravena, R., Parker, B.L., Hunkeler, D., 2009a. Evaluating the fate of chlorinated ethenes in streambed sediments by combining stable isotope, geochemical and microbial methods. J. Contam. Hydrol. 107 (1–2), 10–21.
Abe, Y., Aravena, R., Zopfi, J., Shouakar-Stash, O., Cox, E., Roberts, J.D., Hunkeler, D., 2009b. Carbon and chlorine isotope fractionation during aerobic oxidation and reductive dechlorination of vinyl chloride and cis-1, 2-dichloroethene. Environ. Sci. Technol. 43 (1), 101–107.
Baelum, J., Henriksen, T., Hansen, H.C.B., Jacobsen, C.S., 2006. Degradation of 4-chloro-2-methylphenoxyacetic acid in top- and subsoil is quantita-tively linked to the class III tfdA gene. Appl. Environ. Microbiol. 72 (2), 1476–1486.
Bradley, P.M., 2000. Microbial degradation of chloroethenes in groundwater systems. Hydrogeol. J. 8, 104–111.
Bradley, P.M., Chapelle, F.H., 1997. Kinetics of DCE and VC mineralization under methanogenic and Fe(III)-reducing conditions. Environ. Sci. Technol. 31 (9), 2692–2696.
Bradley, P.M., Chapelle, F.H., 1998. Effect of contaminant concentration on aerobic microbial mineralization of DCE and VC in stream-bed sediments. Environ. Sci. Technol. 32 (5), 553–557.
Bradley, P.M., Chapelle, F.H., 1999a. Methane as a product of chloroethene biodegradation under methanogenic conditions. Environ. Sci. Technol. 33, 653–656.
Bradley, P.M., Chapelle, F.H., 1999b. Role of acetotrophic methanogens in methanogenic biodegradation of vinyl chloride. Environ. Sci. Technol. 33, 3473–3476.
Bradley, P.M., Chapelle, F.H., 2000a. Acetogenic microbial degradation of vinyl chloride. Environ. Sci. Technol. 34 (13), 2761–2763.
Bradley, P.M., Chapelle, F.H., 2000b. Aerobic microbial mineralization of dichloroethene as sole carbon substrate. Environ. Sci. Technol. 34 (1), 221–223.
Bradley, P., Chapelle, F.H., 2002. Microbial mineralization of ethene under sulfate reducing conditions. Bioremed. J. 6 (1), 1–8.
Bradley, P.M., Chapelle, F.H., Lovley, D.R., 1998a. Humic acids as electron acceptors for anaerobic microbial oxidation of vinyl chloride and dichloroethene. Appl. Environ. Microbiol. 64 (8), 3102–3105.
Bradley, P.M., Landmeyer, J.E., Dinicola, R.S., 1998b. Anaerobic oxidation of (1, 2–14 C)-dichloroethene under Mn(IV)-reducing conditions. Appl. Environ. Microbiol. 64 (4), 1560–1562.
Christensen, T.H., Bjerg, P.L., Banwart, S.A., Jakobsen, R., Heron, G., Albrechtsen, H.J., 2000. Characterization of redox conditions in ground-water contaminant plumes. J. Contam. Hydrol. 45 (3–4), 165–241. Clark, I.D., Fritz, P., 1997. Environmental Isotopes in Hydrogeology. Lewis
Publishers, Boca Raton, Florida, USA. 328 pp.
Cupples, A.M., Spormann, A.M., McCarty, P.L., 2003. Growth of a Dehalococ-coides-like microorganism on vinyl chloride and cis-dichloroethene as electron acceptors as determined by competetive PCR. Appl. Environ. Microbiol. 69 (7), 4342.
Dolfing, J., 1999. Comment on “Methane as a product of chloroethene biodegradation under methanogenic conditions”. Environ. Sci. Technol. 33 (13), 2302–2303.
Elsner, M., Hunkeler, D., 2008. Evaluating chlorine isotope effects from isotope ratios and mass spectra of polychlorinated molecules. Anal. Chem. 80 (12), 4731–4740.
Elsner, M., Zwank, L., Hunkeler, D., Schwarzenbach, R.P., 2005. A new concept linking observable stable isotope fractionation to transformation path-ways of organic pollutants. Environ. Sci. Technol. 39, 6896–6916. Freedman, D.L., Gossett, J.M., 1989. Biological reductive dechlorination of
tetrachloroethylene and trichloroethylene to ethylene under methano-genic conditions. Appl. Environ. Microbiol. 55 (9), 2144–2151. Friis, A.K., Albrechtsen, H.J., Cox, E., Bjerg, P.L., 2006a. The need for
bioaugmentation after thermal treatment of a TCE-contaminated aquifer: laboratory experiments. J. Contam. Hydrol. 88 (3–4), 235–248. Friis, A.K., Heron, G., Albrechtsen, H.J., Udell, K.S., Bjerg, P.L., 2006b. Anaerobic
dechlorination and redox activities after full-scale Electrical Resistance Heating (ERH) of a TCE-contaminated aquifer. J. Contam. Hydrol. 88 (3–4), 219–234.
Gossett, J.M., 2010. Sustained aerobic oxidation of vinyl chloride at low oxygen concentrations. Environ. Sci. Technol. 44 (4), 1405–1411. He, J.Z., Ritalahti, K.M., Aiello, M.R., Loffler, F.E., 2003. Complete detoxification
of vinyl chloride by an anaerobic enrichment culture and identification of the reductively dechlorinating population as a Dehalococcoides species. Appl. Environ. Microbiol. 69 (2), 996–1003.
Hendrickson, E.R., Payne, J.A., Young, R.M., Starr, M.G., Perry, M.P., Fahnestock, S., Ellis, D.E., Ebersole, R.C., 2002. Molecular analysis of Dehalococcoides 16S ribosomal DNA from chloroethene-contaminated sites throughout North America and Europa. Appl. Environ. Microbiol. 68 (2), 485–495. Holliger, C., Schraa, G., Stams, A.J.M., Zehnder, A.J.B., 1993. A highly purified
enrichment culture couples the reductive dechlorination of tetrachlor-oethene to growth. Appl. Environ. Microbiol. 59 (9), 2991–2997. Holmes, V.F., He, J.Z., Lee, P.K.H., Varez-Cohen, L., 2006. Discrimination of
multiple Dehalococcoides strains in a trichloroethene enrichment by quantification of their reductive dehalogenase genes. Appl. Environ. Microbiol. 72 (16), 5877–5883.
Hunkeler, D., Morasch, B., 2010. Isotope fractionation during transformation processes. In: Press, C. (Ed.), Environmental Isotopes in Biodegradation and Bioremediation. CRC Press, Boca Raton, pp. 79–125.
Hunkeler, D., Aravena, R., Butler, B.J., 1999. Monitoring microbial dechlorination of tetrachloroethene (PCE) using compound-specific carbon isotope ratios: microcosms and field experiments. Environ. Sci. Technol. 33 (16), 2733–2738.
Imfeld, G., Nijenhuis, I., Nikolausz, M., Zeiger, S., Paschke, H., Drangmeister, J., Grossmann, J., Richnow, H.H., Weber, S., 2008. Assessment of in situ degradation of chlorinated ethenes and bacterial community structure in a complex contaminated groundwater system. Water Res. 42 (4–5), 871–882.
Jennings, L.K., Chartrand, M.M.G., Lacrampe-Couloume, G., Lollar, B.S., Spain, J.C., Gossett, J.M., 2009. Proteomic and transcriptomic analyses reveal genes upregulated by cis-dichloroethene in Polaromonas sp strain JS666. Appl. Environ. Microbiol. 75 (11), 3733–3744.
Lee, W., Batchelor, B., 2002. Abiotic reductive dechlorination of chlorinated ethylenes by iron-bearing soil minerals. 1. Pyrite and magnetite. Environ. Sci. Technol. 36 (23), 5147–5154.
Liang, X.M., Philp, R.P., Butler, E.C., 2009. Kinetic and isotope analyses of tetrachloroethylene and trichloroethylene degradation by model Fe(II)-bearing minerals. Chemosphere 75 (1), 63–69.
Lindberg, E., Albrechtsen, H.J., Jacobsen, C.S., 2007. Inhibition of real-time PCR in DNA extracts from aquifer sediments. Geomicrobial. J. 24, 343–352. Loffler, F.E., Sun, Q., Li, J.R., Tiedje, J.M., 2000. 16S rRNA gene-based detection
of tetrachloroethene-dechlorinating Desulfuromonas and Dehalococ-coides species. Appl. Environ. Microbiol. 66 (4), 1369–1374.
Lu, X.X., Wilson, J.T., Kampbell, D.H., 2006. Relationship between Dehalo-coccoides DNA in ground water and rates of reductive dechlorination at field scale. Water Res. 40 (16), 3131–3140.
Maymo-Gatell, X., Anguish, T., Zinder, S.H., 1999. Reductive dechlorination of chlorinated ethenes and 1, 2-dichloroethane by “Dehalococcoides ethenogenes” 195. Appl. Environ. Microbiol. 65 (7), 3108–3113. Postma, D., Brockenhuusschack, B.S., 1987. Diagenesis of iron in proglacial
sand desposits of late-weichselian and poste-weichselian age. J. Sediment. Petrol. 57 (6), 1040–1053.
Postma, D., Boesen, C., Kristiansen, H., Larsen, F., 1991. Nitrate reduction in an unconfined sandy aquifer–water chemistry, reduction processes, and geochemical modeling. Water Resour. Res. 27 (8), 2027–2045. Scheutz, C., Durant, N.D., Dennis, P., Hansen, M.H., Jorgensen, T., Jakobsen, R.,
Cox, E.E., Bjerg, P.L., 2008. Concurrent ethene generation and growth of
Dehalococcoides containing vinyl chloride reductive dehalogenase genes during an enhanced reductive dechlorination field demonstration. Environ. Sci. Technol. 42 (24), 9302–9309.
Schwientek, M., Einsiedl, F., Stichler, W., Stogbauer, A., Strauss, H., Maloszewski, P., 2008. Evidence for denitrification regulated by pyrite oxidation in a heterogeneous porous groundwater system. Chem. Geol. 255 (1–2), 60–67.
Sherwood Lollar, B., Slater, G.F., Sleep, B., Witt, M., Klecka, G.M., Harkness, M., Spivack, J., 2001. Stable carbon isotope evidence for intrinsic bioreme-diation of tetrachloroethene and trichloroethene at area 6, Dover Air Force Base. Environ. Sci. Technol. 35, 261–269.
Shouakar-Stash, O., Drimmie, R.J., Zhang, M., Frape, S.K., 2006. Compound-specific chlorine isotope ratios of TCE, PCE and DCE isomers by direct injection using CF-IRMS. Appl. Geochem. 21, 766–781.
Squillace, P.J., Moran, M.J., Lapham, W.W., Clawges, R.M., Zogorski, J.S., 1999. Volatile organic compounds in untreated ambient groundwater of the United States, 1985–1995. Environ. Sci. Technol. 33 (23), 4176–4187. Van Breukelen, B.M., Hunkeler, D., Volkering, F., 2005. Quantification of
sequential chlorinated ethene degradation using a reactive transport model incorporating isotope fractionation. Environ. Sci. Technol. 39, 4189–4197.
Wiedemeier, T.H., Newell, C.J., Rifai, H.S., Wilson, J.T., 1999. Natural Attenuation of Fuels and Chlorinated Solvents in the Subsurface. John Wiley & Sons, New York. 617 pp.