HAL Id: cea-01300577
https://hal-cea.archives-ouvertes.fr/cea-01300577
Submitted on 11 Apr 2016
HAL is a multi-disciplinary open access
archive for the deposit and dissemination of
sci-entific research documents, whether they are
pub-lished or not. The documents may come from
teaching and research institutions in France or
abroad, or from public or private research centers.
L’archive ouverte pluridisciplinaire HAL, est
destinée au dépôt et à la diffusion de documents
scientifiques de niveau recherche, publiés ou non,
émanant des établissements d’enseignement et de
recherche français ou étrangers, des laboratoires
publics ou privés.
Evidence for feedback in action from the molecular gas
content in the z
1.6 outflowing QSO XID2028
M. Brusa, C. Feruglio, G. Cresci, V. Mainieri, M. T. Sargent, M. Perna, P.
Santini, F. Vito, A. Marconi, A. Merloni, et al.
To cite this version:
M. Brusa, C. Feruglio, G. Cresci, V. Mainieri, M. T. Sargent, et al.. Evidence for feedback in action
from the molecular gas content in the z 1.6 outflowing QSO XID2028. Astronomy and Astrophysics
- A&A, EDP Sciences, 2015, 578, pp.A11. �10.1051/0004-6361/201425491�. �cea-01300577�
DOI:10.1051/0004-6361/201425491 c
ESO 2015
Astrophysics
&
Evidence for feedback in action from the molecular gas
content in the z
∼
1.6 outflowing QSO XID2028
?,??
M. Brusa
1,2,3, C. Feruglio
4,5,6, G. Cresci
7, V. Mainieri
8, M. T. Sargent
9, M. Perna
1,3, P. Santini
6, F. Vito
1,3,
A. Marconi
10, A. Merloni
2, D. Lutz
2, E. Piconcelli
6, G. Lanzuisi
1,3, R. Maiolino
11, D. Rosario
2, E. Daddi
12,
A. Bongiorno
6, F. Fiore
6, and E. Lusso
71 Dipartimento di Fisica e Astronomia, Università di Bologna, viale Berti Pichat 6/2, 40127 Bologna, Italy
e-mail: marcella.brusa3@unibo.it
2 Max-Planck Institut für Extraterrestrische Physik, Giessenbachstrasse 1, 85748 Garching bei München, Germany 3 INAF–Osservatorio Astronomico di Bologna, via Ranzani 1, 40127 Bologna, Italy
4 IRAM–Institut de RadioAstronomie Millimétrique, 300 rue de la Piscine, 38406 Saint-Martin d’Hères, France 5 Scuola Normale Superiore, Piazza dei Cavalieri 7, 56126 Pisa, Italy
6 INAF–Osservatorio Astronomico di Roma, via Frascati 33, 00044 Monte Porzio Catone (RM), Italy 7 INAF–Osservatorio Astronomico di Arcetri, Largo Enrico Fermi 5, 50125 Firenze, Italy
8 European Southern Observatory, Karl-Schwarzschild-str. 2, 85748 Garching bei München, Germany 9 Astronomy Centre, Department of Physics and Astronomy, University of Sussex, Brighton, BN1 9QH, UK
10 Dipartimento di Astronomia e Scienza dello Spazio, Università degli Studi di Firenze, Largo E. Fermi 2, 50125 Firenze, Italy 11 Cavendish Laboratory, University of Cambridge, 19 J. J. Thomson Ave., Cambridge CB3 0HE, UK
12 Laboratoire AIM, CEA/DSM-CNRS-Université Paris Diderot, IRFU/Service d’Astrophysique, Bât. 709, CEA-Saclay,
91191 Gif-sur-Yvette Cedex, France
Received 9 December 2014/ Accepted 3 March 2015
ABSTRACT
Aims.Gas outflows are believed to play a pivotal role in shaping galaxies, as they regulate both star formation and black hole growth. Despite their ubiquitous presence, the origin and the acceleration mechanism of these powerful and extended winds is not yet understood. Direct observations of the cold gas component in objects with detected outflows at other wavelengths are needed to assess the impact of the outflow on the host galaxy interstellar medium (ISM).
Methods.We observed with the Plateau de Bure Interferometer an obscured quasar at z ∼ 1.5, XID2028, for which the presence of an ionized outflow has been unambiguously signalled by NIR spectroscopy. The detection of12CO(3−2) emission in this source allows
us to infer the molecular gas content and compare it to the ISM mass derived from the dust emission. We then analyzed the results in the context of recent insights on scaling relations, which describe the gas content of the overall population of star-forming galaxies at a similar redshifts.
Results. The star formation efficiency (∼100) and gas mass (Mgas= 2.1−9.5 × 10¹⁰M ) inferred from the CO(3−2) line depend on
the underlying assumptions on the excitation of the transition and the CO-to-H2 conversion factor. However, the combination of this information and the ISM mass estimated from the dust mass suggests that the ISM/gas content of XID2028 is significantly lower than expected for its observed M?, sSFR and redshift, based on the most up-to-date calibrations (with gas fraction <20% and depletion
timescale <340 Myr).
Conclusions.Overall, the constraints we obtain from the far infrared and millimeter data suggest that we are observing QSO feedback able to remove the gas from the host.
Key words.galaxies: active – galaxies: star formation – quasars: individual: XID2028 – galaxies: ISM
1. Introduction
There are both theoretical (e.g.Hopkins et al. 2008) and obser-vational (e.g.Sanders et al. 1988;Yan et al. 2010) arguments that support the notion that luminous star-forming galaxies (here-after: “Starbursts”) and luminous, unobscured active galactic
? Based on observations with the Plateau de Bure millimetre
interfer-ometer, operated by the Institute for Radio Astronomy in the Millimetre Range (IRAM), which is funded by a partnership of INSU/CNRS (France), MPG (Germany) and IGN (Spain).
??
A FITS file for the spectrum shown in Fig. 1 is only available at the CDS via anonymous ftp to
cdsarc.u-strasbg.fr(130.79.128.5) or via
http://cdsarc.u-strasbg.fr/viz-bin/qcat?J/A+A/578/A11
nuclei (AGN; hereafter luminous AGN or “QSO”) are basically the same systems caught in different stages of the coeval growth of (massive) galaxies and the supermassive black holes (SMBH) sitting in their centres. In particular, Starbursts should trace ob-jects caught in the rapid SMBH growth phase characterized by efficient star formation (SF) in a dust-enshrouded, dense envi-ronment, while the unobscured QSOs are systems radiating at the Eddington limit, where the SMBH is almost fully assembled. Given that both SF and AGN activity are thought to be sus-tained by the availability of cold gas in galaxies (see e.g.Menci et al. 2008;Vito et al. 2014), millimeter observations of molecu-lar transitions are needed to directly probe the presence and state of this gas. In the past decade, observations of cold molecular
A&A 578, A11 (2015) gas reservoirs at high redshift (seeCarilli & Walter 2013, for a
comprehensive review) turned out to be crucial in studying the gas content and consumption rate in both normal and peculiar systems. For example, the gas properties of “normal” galaxies are being investigated in increasing detail up to high-z (Tacconi et al. 2013;Genzel et al. 2015; Sargent et al. 2014), and as a function of many of the structural and physical properties of the systems (e.g. star formation rate, SFR; stellar mass; colours; see e.g. Genzel et al. 2015;Sargent et al. 2014). This has be-come possible thanks to the large investment of time at millime-ter arrays, mainly the Plateau de Bure Inmillime-terferomemillime-ter (PdBI). In particular, it has been reported that, among massive systems, (M? > 1010 M ), the gas fraction increases across the main
se-quence (MS; defined between the SFR and the stellar mass of galaxies) at fixed redshift (seeMagdis et al. 2012a,b;Saintonge et al. 2012;Tacconi et al. 2013;Sargent et al. 2014) and is hence closely related to the specific star formation rate (sSFR). This fits a scenario where the redshift evolution of the sSFR is consistent with being driven by the gas fraction (see alsoLilly et al. 2013). Similar conclusions are reached in works involving dust fitting methods to derive the gas mass (see e.g.Santini et al. 2014).
The first molecular studies of local ultra-luminous infrared galaxies (ULIRGs) and submillimeter galaxies (SMG) at higher redshifts, i.e. targeting objects in the “Starburst” phase, showed that these systems typically have a low molecular gas content with respect to their current SFR, or alternatively higher star formation efficiencies (SFEs). Indeed, empirically defining the SFE as the ratio of the IR luminosity to the CO luminosity (in units of L /(K km s−1pc2)), “Starbursts” have SFE > 200 (see
e.g.Daddi et al. 2010;Genzel et al. 2010) larger than those ob-served in normal star-forming galaxies with the same molecu-lar gas content (Tacconi et al. 2010, SFE ∼ 50−200). In other words, their consumption timescale is shorter with respect to normal galaxies and they will exhaust their gas reservoirs in a short timescale (<∼100 Myr). This is consistent with the hypoth-esis that “Starbursts” in general (and ULIRGs/SMGs in partic-ular) are objects at the peak of their SF activity in the heavily obscured phase.
On the other hand, high values of the LIR/L0(CO) ratio have
also been observed in high-z unobscured QSO host galaxies (SFE > 200; e.g.Solomon & Vanden Bout 2005;Riechers 2011; Riechers et al. 2011), although their SFR is expected to be al-ready substantially suppressed as they are at a subsequent phase of “Starbursts” in the evolutionary sequence. In this case a sig-nificant fraction of the gas could have been previously removed during the “blow-out” phase, and the observed high SFE in un-obscured QSOs can be ascribed to region of residual, on-going SF, pointing towards a possible effect of “positive feedback” on the galaxy from the AGN (Silk 2013;Zubovas & King 2014).
A full characterization of the gas properties of objects, e.g. caught in the short-lived “transition” phase between the Starburst and QSO stages, is still missing for a full understanding of the results of the aforementioned studies in terms of the role of the physical processes that govern the co-eval BH-galaxy growth. This phase is expected to be characterized by gas reser-voirs not yet depleted and by complex kinematics, including strong winds and outflows. Brusa et al.(2010) proposed that sources in the “blow-out” phase at z ∼ 1.5 can be isolated on the basis of their observed X-ray-to-optical-to-NIR colours and presented the source XID2028 (z = 1.5927), detected in the XMM-COSMOS survey, as the prototype of this class. XID2028 is a luminous (Lbol ∼ 2 × 1046 erg s−1), mildly obscured QSO
hosted in a massive galaxy, with M∗∼ 4.5×10¹¹M and a SFR ∼
270 M yr−1as measured by Herschel from PEP and SPIRE data
(Lutz et al. 2011;Béthermin et al. 2012). At its centre, XID2028 has a SMBH with mass MBH ∼ 3 × 10⁹ M (Bongiorno et al.
2014), which is accreting at ∼5% of its Eddington luminosity. The presence of a massive outflow in the ionized gas compo-nent of XID2028, traced by the [O III]λ5007 emission, has been unambiguously and independently confirmed by X-Shooter slit spectroscopy (Brusa et al. 2015;Perna et al. 2015) and SINFONI J-band IFU observations: in fact, XID2028 hosts one of the most massive ( ˙Mion > 250 M yr−1, with v > 1500 km s−1) and most
extended (out to scales of ∼13 kpc) outflows detected in a high-z QSO (Cresci et al. 2015). Most importantly, the outflow lies exactly in the centre of a cavity in star-forming regions in the host galaxy (as traced by narrow Hα emission line map and rest-frame U-band imaging; seeCresci et al. 2015) thus suggesting that the wind is removing the gas from the host galaxy (“negative feedback”), and at the same time is also triggering star formation by outflow-induced pressure at the edges (“positive feedback”; e.g.Zubovas & King 2014). XID2028 therefore represents a test case to study QSO “feedback in action”. However, the evidence of feedback in this source mostly comes from measurements of the on-going star formation in the source traced by the narrow Hα emission line that in principle may be affected by e.g. differ-ential extinction effects in the host galaxy.
Direct observations of the cold gas component in this galaxy are needed to assess whether the ionized outflow has an impact on the cold gas reservoir. With this aim, we present observations of the CO(3−2) transition of XID2028, redshifted to 2 mm, ob-tained with the PdBI. We compare the gas masses derived from CO with the gas mass inferred from the dust mass and based on far infrared (FIR) data. These two methods allow us to in-vestigate whether AGN feedback has already been effective in diminishing the cold gas mass in the host, or whether the feed-back phase is still associated with cold gas-rich galaxies similar to MS star-forming galaxies, with important consequences for galaxy-AGN coevolutionary models.
The paper is organized as follows: Sect. 2 presents the PdBI observations and data analysis, Sect. 3 discusses the re-sults, while Sect. 4 summarizes our conclusions. Throughout the paper, we adopt the cosmological parameters H0 =
70 km s−1Mpc−1,Ω
m = 0.3 and ΩΛ = 0.7 (Spergel 2003). In
quoting magnitudes, we use the AB system, unless otherwise stated. We adopt a Chabrier initial mass function to derive stel-lar masses and SFRs for the target and comparison samples. The physical scale is 100∼ 8.5 kpc at the redshift of the source.
2. Millimeter observations 2.1. Data reduction
We observed XID2028 with receivers tuned to a frequency of 133.37 GHz, corresponding to the expected frequency of the CO(3−2) emission line, with the PdBI array in the most com-pact (D) configuration. W split the observations into three tracks (31 May, 1, 6, June 2014). The system temperature (Tsys) was
between 100 and 300 K, and water vapor 4−6 mm. The quasar 1005+058 (0.3 Jy at 133.7 GHz) was used as a phase and am-plitude calibrator. We used MCW349 (with a flux of 1.8 Jy) for absolute flux calibration, which yields an absolute flux accuracy of about 5% at the observed frequency. Calibration and map-ping were done in the GILDAS environment. The flagging of the phase visibilities was fixed at <45◦rms. The total observing
time was 5.6 h (3.06 h on source), for a total of 3673 visibilities available, before applying any flag. We then removed one scan (3994 in 01-June track) due to problems with the tracking. We A11, page 2 of8
Fig. 1.Left panel: spectrum of XID2028 integrated over the beam. The solid line shows a Gaussian fit with FWZI= 770 km s−1and centred at the
frequency corresponding to the redshift of the source. Right panel: integrated map of CO(3−2), in the channels corresponding to the “systemic” peak of the line. Contour levels are 1σ each (σ = 0.23 Jy km s−1). The synthesized beam is shown in the bottom-left corner. The black cross
marks the phase centre (i.e. the ACS nucleus). The blue and red cross mark the positions of the blue and red line components, as derived from our spectroastrometric analysis.
did not use data from antenna 1 from the 06-June track in the final data set because of the presence of a tuning parasite, which produced a spurious signal at a frequency (133.21 GHz) close to the observed frame frequency of the CO(3−2) transition. After flagging bad visibilities, the total on source time is 2.54 h (six-antenna equivalent), and the 1σ sensitivity is 1.36 mJy/beam in 20 MHz channels, for a total of 3052 visibilities. The clean beam of the observations is 4.500× 3.400, with an angle of 38 degrees.
The phase centre of the data set was set to the HST position of the QSO nucleus (RA= 10:02:11.29, Dec = +01:37:06.79).
2.2. Analysis
We estimated the 2 mm continuum by collapsing the line-free channels of the data set and fitting the visibilities. The continuum is not detected with a 3σ upper limit on its flux of 0.3 mJy.
The redshift of the host galaxy (z = 1.5927) was adopted to convert the frequency to velocity space. Figure 1shows the line spectrum integrated over the beam. The line displays two peaks: one centred around the systemic redshift (FWHM ∼ 550 ± 200 km s−1 from a Gaussian fit), and another centred at ∼1000 km s−1(henceforth referred to as “red feature”). The peak
at the systemic position is significant at 5σ, while the “red ture” is at a lower significance (∼3σ). Moreover, the “red fea-ture” peaks at ∼133.0 GHz, close to a known parasite signal at 132.9 coming from antenna 4 and identified in all tracks. We cre-ated a new table flagging data on Antenna 4. The total exposure time decreased to 1.8 h and the total number of visibilities to be used for the scientific analysis also considerably decreased. The red feature is not significant anymore (S/N < 3). However, the significance of the detection over the systemic line also de-creased at S/N ∼ 4. For this reason, we decided to keep the full data sets in the analysis and, in the absence of deeper, more highly resolving observations, which could confirm the presence of a second dynamically distinct component, we will consider the red feature as spurious.
The zero spacing flux, estimated by fitting the averaged visi-bilities in the velocities ranging from −340 to+440 km s−1with a point source function, is S0(CO)= 1.6 ± 0.3 mJy (5.3σ), and returns a centroid at (RA, Dec= 10:02:11.24 01:37:05.48). The
integrated flux over the full velocity range of the systemic line (with Full Width Zero Intensity, FWZI ∼ 770 km s−1) is
there-foreR S0(CO)dv= 1.23 ± 0.23 Jy km s−1. This measure depends
only on the data calibration (including flagging of the antennas) and does not depend on any other assumption, like e.g. mask-ing, extraction region, ad-hoc centroid. The quoted errors take the statistical errors of the uv plane fit and the errors on the absolute flux calibration (5%) into account. The right panel of Fig.1 shows the integrated map over the systemic line emis-sion. We verified that the flux extracted from the integrated map (S = 1.55 ± 0.3 mJy) on a region slightly larger than the beam is in agreement with that estimated by fitting the visibilities.
Figure2shows the HST/ACS image (background) with the contours from the K-band image (blue) superimposed, which should trace the extension of the host galaxy. The black contours are from the map obtained on the line detected at the systemic position (e.g. from Fig. 1 right, in steps of signal-to-noise ra-tio (S/N), starting from 1σ) and the black cross marks the line centroid.
From both Figs.1and2it is clear that the line peak is offset by ∼100from the QSO nucleus position. From previous observa-tions with the same phase calibrator (1005+058), we can exclude errors in the absolute astrometry. The error associated with the beam and the S/N of the source translates into a positional uncer-tainty of 0.4600× 0.3600. We note, however, that the displacement
may be due to the limited uv coverage of the data, and that a CO-offset is typical of low S/N data (see e.g.Casey et al. 2011). Better S/N and uv coverage are needed to refine the location of the gas reservoir.
A dynamical mass can be estimated from the CO line width assuming a size (R) and an inclination (i) of a rotating molec-ular gas disk. The size can be inferred using the spectroastro-metric technique (Gnerucci et al. 2011;Carniani et al. 2013, and references therein), applied to the CO data cube. By integrat-ing the CO data in the red (0,+400 km s−1) and blue (−400,
0 km s−1) line channels, we measure a difference in the line cen-troids of ∼1.5 ± 0.200(with an error of 0.3 pixels for each
detec-tion). The centroids of these detections are also shown in Fig.1 (right panel) as blue and red crosses to mark the blue and red line channels, respectively. The measured shift corresponds to
A&A 578, A11 (2015)
Fig. 2.HST/ACS image (F814W filter) with superimposed K-band
con-tours from CFHT (blue, arbitrary levels chosen to trace the whole K-band emission). Black contours represent CO(3−2) emission from the integrated map in the channels corresponding to the “systemic” peak of the line (same levels as in right panel of Fig.1; starting from 1 sigma). The black cross (with associated ellipse) marks the line cen-troid. The image is about 1000
across. The beam size is 4.500
× 3.400
, with an angle of 38 degrees.
∼13 kpc at the source redshift and translates to R ∼ 6.5±0.8 kpc, in agreement with the extension seen in the K-band data (see also Cresci et al. 2015). Applying Eq. (5) ofGnerucci et al.(2011), we infer a Mdyn(sin i)2= 4.5 × 10¹¹ M and, assume an
inclina-tion of 60 deg, a Mdyn ∼ 6.0 ± 2.3 × 10¹¹ M once all the
un-certainties in the quantities are taken in account. We will discuss in the following how this compares with the total mass derived from M?+Mgas.
3. Results and discussion
Deriving the luminosity L0CO[1−0] of the ground-state transi-tion (which is generally regarded as the best indicator of the to-tal gas reservoir) requires an assumption on r31, the luminosity
ratio between the CO(3−2) and the CO(1−0) transitions, which depends on the nature of the systems: a ratio of ∼0.7−1 is typi-cally reported for SMG galaxies and QSOs (seeCarilli & Walter 2013, and references therein), while an average ratio of ∼0.42 has been determined for MS star-forming galaxies at a similar redshift as XID2028 (e.g.Daddi et al. 2015).
The CO(3−2) luminosity of XID028 is L0(CO[3−2]) =
1.9 ± 0.4 × 10¹⁰ K km s−1pc2 (∼9.3 ± 2 × 10⁵ L ),
follow-ing Solomon & Vanden Bout(2005). This value is in between the average values observed in this molecular transition for U/LIRGs (L[CO(3−2)] = 2.6 ± 0.5 × 10⁹ K km s−1pc2) and
SMGs (L[CO(3−2)]4.4 ± 1.1 × 10¹⁰ K km s−1pc2), as reported
in the work ofIono et al. (2009). On the other hand, the SFR (∼270 M yr−1) and M?(∼4.5×10¹¹M ) of XID2028 are
consis-tent with those observed in a MS galaxy at z ∼ 1.5 (seeMainieri et al. 2011;Bongiorno et al. 2014;Brusa et al. 2015).
The CO(2−1) transition in XID2028 is not detected down to a sensitivity of 0.23 mJy/beam over the full 770 km s−1line
width (corresponding to a 3σ upper limit on the line integrated flux of 0.53 Jy km s−1), from a separate, 3 mm-band PdBI
observation of XID2028 in October 2014 (Sargent, priv. comm.). This suggests a near thermal CO-excitation state1, and there-fore r31 around unity, i.e. larger than the standard value
usu-ally adopted for MS galaxies, which is more consistent with the QSO/Starburst scenario. Given the complex nature of the system, we derive the CO(1−0) luminosity under the conserva-tiveassumption that r31 = 0.7 (consistent with the constraints
we have from millimeter data alone), and we will apply dif-ferent αCO factors to derive molecular gas masses under the
QSO/ULIRG and MS assumptions, discussing the implications of the findings in the different cases. The inferred L0(CO[1−0])
luminosity for XID2028 (abbreviated as L0(CO) in the follow-ing) is therefore L0(CO) = 2.6 × 10¹⁰ K km s−1pc2 (∼1.2 ×
106L ).
3.1. Star formation efficiency
Figure 3 (left panel) shows L0(CO) against the total infrared
luminosity (LIR, computed between 8−1000 µm) for XID2028
(red circle). The IR luminosity of XID2028 is very well con-strained by Herschel/PACS and SPIRE data (log LIR = 12.47;
seeBrusa et al. 2015;Perna et al. 2015), and has been estimated from fitting all bands with photometry with rest-frame wave-length >50 µm withDale & Helou(2002) Starbursts templates, using the same technique as inSantini et al.(2009). Although recent works on FIR emission of AGN show that even the flux observed at rest-frame wavelengths longer than 60 µm can be AGN-dominated (e.g. Mullaney et al. 2011), in XID2028 the QSO contribution is expected to be negligible. This contribution is shown in Fig.2ofPerna et al.(2015), where the most recent SED fitting decomposition for this object is presented. The ob-served IR luminosity corresponds to a SFR of ∼270+50−100M yr−1,
using the SFR-IR luminosity relation (Kennicutt 1998), and tak-ing the uncertainties in the flux normalization of the Starburst component related to the AGN-host SED decomposition into account.
We compare this measurement with the compilation of low-and high-redshift normal star-forming galaxies with measured αCO presented in Sargent et al. (2014) and the SMG-sample
fromBothwell et al.(2013), involving both outliers and galaxies consistent with the locus of the main sequence at their redshift. We also plot the unobscured QSOs at 1 < z < 4 presented in Riechers(2011)2. For these sources, the IR luminosities are ex-tracted from theCarilli & Walter(2013) compilation. Finally, in Fig.3we show SW022550 and SW022513 at z ∼ 3.4 (Polletta et al. 2011), ULASJ1539 at z ∼ 2.5 (Feruglio et al. 2014), and the MIPS-selected sources at z ∼ 2 fromYan et al.(2010). All these systems have been proposed to be in the “transition phase” between a heavily obscured Starburst phase and the unobscured QSO phase.
The SFE of XID2028 (SFE ∼ 110) is on the lower side of the SFEs measured for high-z SMG and unobscured QSOs (SFE ∼ 100−1000). Instead, the SFE is consistent with those re-ported (albeit with much larger uncertanties because of the lack of a complete multiwavelength coverage and reliable measure-ments of LIR) in the obscured QSOs systems proposed to be in
the “transition phase” mentioned above.
1 r
31 >∼ 1.0 assuming CO[2−1] is thermalized, and r31 >∼ 0.9
assum-ing CO[2−1] is sub-thermally excited r21 = 0.84, standard value for
MS objects
2 In the case of lensed quasars, the values are corrected for the
ampli-fication, as reported in Riechers (2011). A11, page 4 of8
Fig. 3.Left panel: L0
(CO[1−0]) against the IR luminosity (8−1000 µm) showing a compilation of MS galaxies at 0 < z < 2.5 from theSargent
et al.(2014) work (Sa14; grey symbols), local ULIRGs from from So97, crosses SMGs fromBothwell et al.(2013; Bo13, filled brown squares),
1 < z < 4 QSOs with data from Riechers (2011) and Carilli & Walter (2013; R11/C&W13, light blue circles). The measurement for XID2028 obtained assuming r31= 0.7 is shown as a red circle. Obscured QSOs proposed to be in the transition phase presented inAravena et al.(2008),
Polletta et al.(2011),Feruglio et al.(2014) and the MIPS-selected sources fromYan et al.(2010) are also marked, as labelled. Right panel:
inverse, integrated Kennicutt-Schmidt relation between SFR and molecular gas mass. The colour points correspond to the position of XID2028 with different CO-to-H2conversion factors: αCO= 3.6 (top; blue), and αCO= 0.8 (bottom; red). The green star shows the ISM mass inferred from
the dust SED. All the values for XID2028 are slightly offset in the x-axis for clarity. Other points are taken from the same samples presented in the left panel. For the Bo13, R11/C&W13, and Ya10 samples we plot the median value with associated 16% and 84% percentiles. For the obscured QSOs all the authors used αCO = 0.8. In both panels, the solid black line is the best-fit relation for MS galaxies, and the dashed line defines the
locus of strong SB galaxies with approximately 15 times shorter depletion time (Mmol/SFR) than MS galaxies (Sargent et al. 2014).
3.2. Molecular gas mass from CO data
Estimating the molecular gas mass based on the CO luminos-ity critically hinges on the CO-to-H2 conversion factor αCO,
de-fined as the ratio between the mass of molecular gas (Mmol) to
the integrated CO(1−0) luminosity (αCO = Mmol/L0(CO)[1−0]
in units of M /(K km s−1pc2)). This value depends on the
inter-stellar medium (ISM) conditions, and two distinct assumptions are often adopted: αCO ∼ 4 for extended SF disks/MS galaxies
of solar metallicity, and αCO ∼ 0.8 for compact luminous
sys-tems (Downes & Solomon 1998; seeCarilli & Walter 2013; and Bolatto et al. 2013, for in-depth discussions).
From a morphological point of view we do not have a clear classification of the properties of the host galaxy. Given that the HST image suffers from substantial extinction (AV ∼ 3; see
dis-cussion inPerna et al. 2015) and, in any case, is dominated by the central active nucleus, it cannot be used for a reliable morpho-logical analysis. However, no clear signatures of merging struc-tures are visible in the rest-frame U-band. The low-resolution (with respect of HST) K-band image is instead consistent with both an elliptical galaxy and a spiral galaxy, possibly interacting with a north-east system (see Fig.2). Even if the MS is mainly populated by “normal” spiral and disk galaxies (see e.g.Wuyts et al. 2011a), we note that XID2028 would lie among the popula-tion that occupies the upper envelope of the MS at z ∼ 1.5. These galaxies may also have cushier light profiles, intermediate be-tween disky galaxies and red and dead systems (seeWuyts et al. 2011b, their Fig. 1, right panel). In any case, if after point-source subtraction this galaxy was to be shown to have an early-type or disturbed host galaxy morphology, it would actually be highly consistent with the statistical findings ofWuyts et al.(2011b).
In the vast majority of studies targeting SMGs, QSOs, and ULIRGs systems (see e.g.Aravena et al. 2008;Riechers et al. 2011;Polletta et al. 2011;Feruglio et al. 2014, among others), αCO= 0.8 has been adopted even in absence of better
informa-tion on the physical properties of the system (e.g. compactness of the source). Under the assumption of Starbursts/QSO scenario, we obtain for XID2028 a gas mass Mmol∼ 2.1 ± 0.4 × 10¹⁰M .
To infer the molecular gas mass under the MS hypothesis, we consider a metallicity dependent conversion factor αCO(see
e.g.Genzel et al. 2012;Bolatto et al. 2013). In the following we will assume for XID2028 a value of 12+ log(O/H) = 9.07, the metallicity inferred from the so-called fundamental metal-licity relation (FMR,Mannucci et al. 2010), which relates the metal content with the stellar mass and the SF of the galaxy in-dependently of redshift (Cresci et al. 2012). Applying the re-lations describing redshift-dependent variations of αCO in the
SFR-M? plane ofSargent et al.(2014) to XID2028, one would expect3 α
CO ∼ 3.6, and the corresponding molecular gas mass
would then be Mmol∼ 9.5 ± 1.9 × 10¹⁰M .
The two values for Mgasinferred under the two different
as-sumptions are plotted in Fig.3b (with the statistical errors asso-ciated with the line detection), where the molecular gas mass is shown as a function of the SFR (for the same samples presented in Fig.3a).
3 A virtually identical conversion factor would be inferred using the
relation between metallicity and αCOcalibrated inGenzel et al.(2012)
once the offsets between different metallicity calibrations are taken into account.
A&A 578, A11 (2015) 3.3. Molecular gas mass from FIR emission
We also adopt an independent method to compute the total gas mass in this source, using the dust mass derived from FIR pho-tometry. For this purpose, we assume a metallicity-dependent gas to dust ratio, following the calibration presented bySantini et al.(2014) and recently extended to AGN samples in the work byVito et al.(2014). This estimate is independent from αCO,
al-though it depends on the metallicity (Z) of the system and on the assumptions that the dust-to-gas ratio scales linearly with Z through a constant factor (Draine et al. 2007).
The dust mass is obtained via SED decomposition of the AGN and host galaxy contributions, using a combination of the Silva et al.(2004) AGN templates and theDraine & Li(2007) dust templates to fit the 100−500 µm range. For objects at z > 1, submillimeter data are in principle required to properly sam-ple the dust emission free from AGN contamination. However, we note that for XID2028 the best-fit SED decomposition per-formed followingVito et al.(2014) is consistent with the upper limit of the continuum at 2 mm (see Sect. 2.2).
We obtain a total dust mass of Mdust = 7.7 ± 4.2 × 10⁸ M .
Assuming the FMR metallicity (see above) and theSantini et al. (2014) calibration, this translates into a Mgas ∼ 4.5 ± 2.4 ×
1010 M
(without considering the uncertainty of the
dust-to-gas-ratio calibdust-to-gas-rations, e.g. a factor of ∼2, seeSandstrom et al. 2013). We note that using theLeroy et al.(2011) metallicity dependence of the dust-to-gas ratio would yield consistent results, within the errors.
The value inferred from the dust fit approach is plotted as a green star in Fig. 3b. If we use this estimate for Mgas, and the
observed L0(CO), we can derive an effective αCOfor this source,
αCO(dust)∼ 2.4 × r31(αCO(dust)∼ 1.7 given our adopted excitation
correction r31= 0.7).
3.4. Gas fraction and depletion timescale
The uncertainty in the derived gas mass from the CO data is dominated by the assumption in αCO(a factor of 4.5) with
re-spect to the statistical uncertainties (20%). Given that the value derived from the dust fit is in between those for the two dif-ferent assumptions in αCO, in the following we will refer to
this value as our best estimate for the molecular gas mass, i.e. Mgas= 4.5 × 10¹⁰ M . We will also refer to the values from the
CO data under the MS and QSO/Starburst assumptions as upper and lower limit, respectively, i.e. Mgas= (1.7−11.4)×1010M . In
this case we also take into account the statistical uncertainties of the detection and the overall uncertainty in the assumed dust-to-gas ratio. We note that the total dust-to-gas mass inferred from the dust continuum fit includes both the molecular and atomic compo-nents. However, the atomic mass usually constitutes a negligible fraction of the total gas mass.
The stellar mass of XID2028 is M? ∼ 4.5 × 10¹¹ M from
the most recent SED fitting decomposition (Perna et al. 2015). This value is a result of the inclusion in the multicomponent SED fitting of a mildly obscured QSO component, given that we observe the broad line region (BLR) emission in the Hα line complex (Bongiorno et al. 2014). In Sect. 2.2 we reported a dynamical mass Mdyn ∼ 6 ± 2 × 10¹¹ M . Although the
es-timate of the dynamical mass suffers from large uncertainties, it is quite reassuring that it is consistent with the value we obtain from the sum of the stellar and molecular mass compo-nents (Mtot ∼ 4.6−5.6 × 10¹¹ M , taking into account the range
of Mgas).
We can then calculate the molecular gas fraction, µmol,
de-fined as the ratio of the molecular gas mass and the stellar mass (µmol = Mmol/M?; see e.g. Sargent et al. 2014; Genzel
et al. 2015). Given the molecular gas masses inferred in the previous section, the gas fraction translates into ∼5% for the QSO/Starburst and ∼21% for the MS scenarios. The value from the dust mass measurement is in between these two estimates (∼10%). Similarly, we can estimate the depletion timescale (de-fined as Mgas/SFR; e.g. the rate at which the gas is converted
into stars) and we infer tdepl = 75, 340, and 160 Myr using the
QSO/Starburst, MS and dust-fit derived gas masses, respectively. 3.5. Evidence for QSO feedback
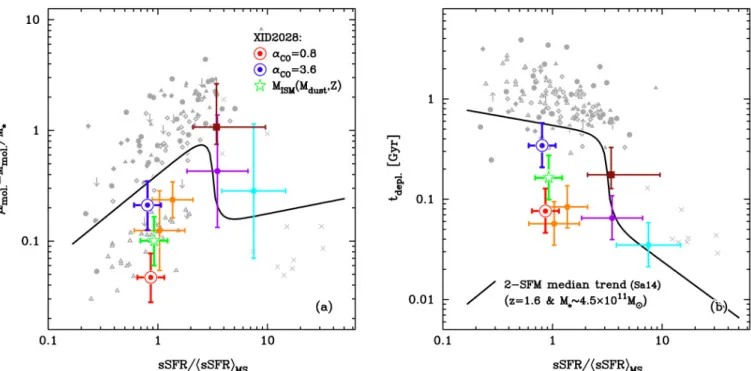
Figure4(left panel) shows the gas fraction in XID2028 for the three assumptions described above, plotted against the sSFR-excess with respect to the main sequence, e.g. sSFR/sSFRMS =
0.86, where the mass- and redshift-dependence of the character-istic sSFR of MS galaxies follows the calibration inSargent et al. (2014), which is based on a large compilation of literature data. In this plot we show the same samples used in Fig.3(with the exception of unobscured QSOs and the MIPS selected sources for which no stellar mass estimates are available) and we plot as a solid line the median trend with normalized sSFR, expected for a galaxy of the same mass and redshift of XID2028 (taken from the 2-Star Formation Mode description of normal and star-bursting (off-MS) galaxies inSargent et al. 2014).
Taking the best Mgas estimate for our target, and even
tak-ing the uncertainty on αCO assumption into account, XID2028
is among the objects with the lowest gas fraction for its sSFR detected so far in the high-z Universe and associated with nor-mal star-forming galaxies (green star in Fig.4), especially when compared to systems with similar masses (solid line). The µmol
is instead more similar to that expected for “Starburst” galax-ies of a similar mass and redshift (see value of black trend line at sSFR/hsS FRiMS >∼ 4), but XID2028 does not share the same
burst of star formation with these sources. Instead, the gas frac-tion of XID2028 is similar to normal galaxies in the local uni-verse (open triangles), despite its higher redshift.
An alternative way of visualizing the gas content and con-sumption is illustrated in the right panel of Fig.4, where the depletion timescale is plotted against the MS-normalized sSFR of the host galaxy. Assuming our best Mgasestimate, XID2028
lies at shorter depletion timescales with respect to MS galaxies (at any redshift), i.e. it is consuming its residual gas more rapidly than normal star-forming galaxies. This qualifies XID2028 as a clear outlier with respect to the average population, and a rare object, consistent with the hypothesis that it is caught in the very short transition phase in which the QSO feedback is released.
Similar conclusions can be reached examining the posi-tion of our source with respect to the Kennicutt-Schmidt rela-tion (Kennicutt 1998): assuming the physical scales inferred in Sect. 2.2, and that the molecular gas and the SF episodes are dis-tributed uniformly over this region, XID2028 would lie slightly above (a factor ∼2.5) the correlation observed for normal and Starburst galaxies. However, the SFR density measured in this way is to be considered a lower limit, given that the SF regions seem to be patchy (seeCresci et al. 2015). Therefore, XID2028 would further deviate above the K-S relation, towards regions of short depletion timescales.
It is important to note that, even when using the MS assump-tion, the molecular gas fraction and depletion timescale would be considerably lower than those expected for systems of the same host galaxies properties of XID2028 (blue point in Fig.4). A11, page 6 of8
Fig. 4.Gas fraction µmol(left panel)and depletion timescale (right panel) plotted versus the sSFR-excess for the same samples and with the same
colour code presented in Fig.3. The values for XID2028 are slightly offset in the x-axis for clarity. All quantities are normalized to the expected values for normal and Starburst galaxies predicted by the calibration presented inSargent et al.(2014). The black line traces the expected variation (median) with sSFR for a MS spiral galaxy with identical mass and redshift as XID2028 (seeSargent et al. 2014). The step at sSFR/hsSFRi ∼ 4 reflects the transition from the main sequence locus to the sSFR-regime where high-SFE Starbursts dominate. XID2028 lies a factor ∼2 to ∼10 below the black line. I.e. it shows significant lower gas fraction and depletion timescale than those expected for the properties of its host galaxy.
In particular, the depletion timescale observed in XID2028 for the MS scenario is a factor of ∼2 lower than the expectations of Sargent et al. (2014) and a factor ∼3 lower than that ob-tained by the parameterization of MS and off-MS galaxies pre-sented in Genzel et al.(2015, using their global fit we expect for XID2028 tdep(G15)global ∼ 970 Myr). The discrepancy with
the calibrations is more extreme if the values obtained in the QSO scenario are adopted (red circles in Fig. 4). We also note that our chain of assumptions in deriving Mgas is very
conser-vative. For example, we use r31 = 0.7 instead of r31 >∼ 0.9
as suggested by the non-detection of CO[2−1] emission, which would have instead provided a 20% smaller CO[1−0] flux. This conservative assumption also compensates for a possible over-estimate of the value of the CO[3−2] flux, which could result from measuring the line flux at the phase centre rather than at the slightly offset centroid. The result of the lack of molecu-lar gas in XID2028, with Mgas <∼ 1011 M , is therefore quite
robust.
A short depletion timescale with respect to MS galaxies was also found for SMGs in theBothwell et al.(2013) sample, and other AGN/Starburst systems plotted in Fig.4 (Aravena et al. 2008;Polletta et al. 2011;Feruglio et al. 2014).Yan et al.(2010) also reported a short depletion timescale of ∼40 Myr for the sam-ple of MIPS-selected ULIRGs. The short desam-pletion timescale in SMGs was interpreted as higher SFE in the galaxy (e.g.Genzel et al. 2010;Daddi et al. 2010), probably due to higher density of the ISM in these compact systems. This may also be the case for ULASJ1534 and the COSBO11, which have sSFRs comparable to SMGs, and for which we expect compact gas reservoirs.
Instead, in XID2028 a significant fraction of the gas is expected to be expelled from the galaxy already. The SF is then probably maintained only in the denser environments, less affected by the negative feedback, and possibly enhanced
by positive feedback because of the outflow-induced pressure (e.g.Silk 2013). The fact that XID2028 has a smaller gas reser-voir and shorter depletion time than that measured for MS galax-ies of similar sSFR therefore constitutes a new probe (in addi-tion to the analysis presented inCresci et al. 2015) that QSO feedback in the form of powerful outflows is able to affect star formation in the host and expel a significant fraction of gas from the host galaxy.
4. Summary
We presented the first molecular line luminosity measurement, via CO(3−2) observations obtained at the PdBI, in a luminous obscured QSO at z ∼ 1.5. The target is thought to be in the “blow-out” phase, and the presence of a powerful outflow with significant impact on the host galaxy has been unveiled through previous NIR observations (Perna et al. 2015;Cresci et al. 2015). We complemented the PdBI data with FIR dust fitting, and report the following results:
– We measure a SFE ('110) at the lower end of those re-ported in the literature for a large number of QSOs and Starburts/SMG galaxies (see Iono et al. 2009; Carilli & Walter 2013), and consistent with that inferred for obscured QSOs at higher redshift;
– We infer a molecular gas mass (Mmol) in the range 2.1 ±
0.4 ÷ 9.5 ± 1.9 × 10¹⁰ M
applying the QSO/Starburst or
MS conversion factors to the measured L0CO line luminosity, respectively, and a total gas mass Mgas∼ 4.5 × 10¹⁰ M from
dust continuum fitting;
– A value for the molecular gas mass <1011M
is also
A&A 578, A11 (2015) through spectroastrometric methods (see Sect. 2.2), given the
high stellar mass of XID2028;
– We also infer a molecular gas fraction µmol ∼ 5−20%. This
translates into a gas depletion timescale tdepl∼ 70−340 Myr,
depending on the assumptions on αCO(see Fig.4).
– The value of tdepl is considerably lower (<∼30%) than those
observed in systems hosted in similar massive (M? >
1011M
) MS galaxies (MS-normalized sSFR ∼ 1), and
con-sistent with those observed for SMGs and for the other few systems proposed to be in the transition phase.
We propose that in XID2028 the QSO wind, detected in the ion-ized gas component out to 10-kpc scales, has already removed most of the molecular gas from the host galaxy. All the obser-vational constraints (low molecular gas content, lowest µmolat a
fixed sSFR when compared to M?> 1011 M systems, and
low-est sSFR at a fixed µmol) are consistent with this type of scenario,
where the gas in the host galaxy of XID2028 is indeed already depleted/dispersed by the effects of the strong QSO feedback (see also Coppin et al. 2008; and Yan et al. 2010, for similar interpretation). In dense regions (e.g. clumpy Mgasreservoirs),
possibly located at the edge of the outflow cavity (Cresci et al. 2015), the residual gas is converted into stars at a high rate simi-lar to that observed in SMGs, where the low depletion timescale is indeed ascribed to the efficient SF triggered in dense and com-pact gas reservoirs.
The measure of the intensity of the CO(3−2) emission in XID2028 represents a first step towards a mapping experiment using high spatial resolution to study the morphology and the kinematics of the molecular gas reservoir and of the clumpy structures in the distribution of SF regions seen in HST and SINFONI maps. Sensitive ALMA and/or NOEMA observations of XID2028 will finally give the spatial resolution to locate molecular clouds (see e.g.Aravena et al. 2014) and reveal any possible molecular outflow component.
Acknowledgements. Based on observations carried out under project number X–8 with the IRAM PdBI. IRAM is supported by INSU/CNRS (France), MPG (Germany), and IGN (Spain). We gratefully acknowledge the alloca-tion of IRAM DDT time, and we thank the staff of the IRAM Observatory for their support of this program. M.B., M.P., and G.L. acknowledge support from the FP7 Career Integration Grant “eEASy” (“SMBH evolution through cosmic time: from current surveys to eROSITA-Euclid AGN Synergies”, CIG 321913). M.B. gratefully acknowledges fundings from the DFG cluster of excel-lence “Origin and Structure of the Universe” (www.universe-cluster.de). We acknowledge financial support from INAF under the contracts INAF-2011 (“Black Hole growth and AGN feedback through cosmic time”), PRIN-INAF-2012 (“The Lifecycle of early Black Holes”) and PRIN MIUR 2010-2011 (“The dark Universe and the cosmic evolution of baryons”). We thank Dennis Downes and Andrea Comastri for enlightening discussions. We thank the anony-mous referee for his/her interest in the results of our work, a very careful read-ing of the paper, and useful suggestions that improved the presentation of the results.
References
Aravena, M., Bertoldi, F., Schinnerer, E., et al. 2008,A&A, 491, 173
Aravena, M., Hodge, J. A., Wagg, J., et al. 2014,MNRAS, 442, 558
Béthermin, M., Le Floc’h, E., Ilbert, O., et al. 2012,A&A, 542, A58
Bolatto, A. D., Wolfire, M., & Leroy, A. K. 2013,ARA&A, 51, 207
Bongiorno, A., Maiolino, R., Brusa, M., et al. 2014,MNRAS, 443, 2077
Bothwell, M. S., Smail, I., Chapman, S. C., et al. 2013,MNRAS, 429, 3047
Brusa, M., Civano, F., Comastri, A., et al. 2010,ApJ, 716, 348
Brusa, M., Bongiorno, A., Cresci, G., et al. 2015,MNRAS, 446, 2394
Carilli, C. L., & Walter, F. 2013,ARA&A, 51, 105
Carniani, S. , Marconi, A., Biggs, A., et al. 2013,A&A, 559, A29
Casey, C. M., Chapman, S. C., Neri, R., et al. 2011,MNRAS, 415, 2723
Coppin, K. E. K., Swinbank, A. M., Neri, R., et al. 2008,MNRAS, 389, 45
Cresci, G., Mannucci, F., Sommariva, V., et al. 2012,MNRAS, 421, 262
Cresci, G., Mainieri, V., Brusa, M., et al. 2015,ApJ, 799, 82
Daddi, E., Elbaz, D., Walter, F., et al. 2010,ApJ, 714, L118
Daddi, E., Dannerbauer, H., Liu, D., et al. 2015,A&A, 577, A46
Dale, D. A., & Helou, G. 2002,ApJ, 576, 159
Downes, D., & Solomon, P. M. 1998,ApJ, 507, 615
Draine, B. T., & Li, A. 2007,ApJ, 657, 810
Draine, B. T., Dale, D. A., Bendo, G., et al. 2007,ApJ, 663, 866
Feruglio, C., Bongiorno, A., Fiore, F., et al. 2014,A&A, 565, A91
Genzel, R., Tacconi, L. J., Gracia-Carpio, J., et al. 2010,MNRAS, 407, 2091
Genzel, R., Tacconi, L. J., Combes, F., et al. 2012,ApJ, 746, 69
Genzel, R., Tacconi, L. J., Lutz, D., et al. 2015,ApJ, 800, 20
Gnerucci, A., Marconi, A., Cresci, G., et al. 2011,A&A, 533, A124
Hopkins, P. F., Hernquist, L., Cox, T. J., & Kereš, D. 2008,ApJS, 175, 356
Kennicutt, Jr. R. C. 1998,ARA&A, 36, 189
Iono, D., Wilson, C., Yun, M. S., et al. 2009,ApJ, 695, 1537
Leroy, A. K., Bolatto, A., Gordon, K., et al. 2011,ApJ, 737, 12
Lilly, S. J., Carollo, C. M., Pipino, A., Renzini, A., & Peng, Y. 2013,ApJ, 772, 119
Lutz, D., Poglitsch, A., Altieri, B., et al. 2011,A&A, 532, A90
Magdis, G. E., Daddi, E., Béthermin, M., et al. 2012a,ApJ, 760, 6
Magdis, G. E., Daddi, E., Sargent, M. T., et al. 2012b,ApJ, 758, L9
Mainieri, V., Bongiorno, A., Merloni, A., et al. 2011,A&A, 535, A80
Mannucci, F., Cresci, G., Maiolino, R., Marconi, A., & Gnerucci, A. 2010,
MNRAS, 408, 2115
Menci, N., Fiore, F., Puccetti, S., & Cavaliere, A. 2008,ApJ, 686, 219
Mullaney, J. R., Alexander, D. M., Goulding, A. D., & Hickox, R. C. 2011,
MNRAS, 414, 1082
Perna, M., Brusa, M., Cresci, G., et al. 2015,A&A 2015, 574, A82
Polletta, M., Nesvadba, N. P. H., Neri, R., et al. 2011,A&A, 533, A20
Riechers, D. A. 2011,ApJ, 730, 108
Riechers, D. A., Carilli, C., Maddalena, R. J., et al. 2011,ApJ, 739, L32
Saintonge, A., Tacconi, L. J., Fabello, S., et al. 2012,ApJ, 758, 73
Sanders, D. B., Soifer, B. T., Elias, J. H., Neugebauer, G., & Matthews, K. 1988,
ApJ, 328, L35
Sandstrom, K. M., Leroy, A. K., Walter, F., et al. 2013,ApJ, 777, 5
Santini, P., Rosario, D. M., Shao, L., et al. 2009,A&A, 504, 751
Santini, P., Maiolino, R., Magnelli, B., et al. 2014,A&A, 562, A30
Sargent, M. T., Daddi, E., Béthermin, M., et al. 2014,ApJ, 793, 19
Silk, J. 2013,ApJ, 772, 112
Silva, L., Maiolino, R., & Granato, G. L. 2004,MNRAS, 355, 973
Solomon, P. M., & Vanden Bout, P. A. 2005,ARA&A, 43, 677
Tacconi, L. J., Genzel, R., Neri, R., et al. 2010,Nature, 463, 781
Tacconi, L. J., Neri, R., Genzel, R., et al. 2013,ApJ, 768, 74
Vito, F., Maiolino, R., Santini, P., et al. 2014,MNRAS, 441, 1059
Wuyts, S., Förster Schreiber, N., Lutz, D., et al. 2011a,ApJ, 738, 106
Wuyts, S., Förster, S., Natascha, M., et al. 2011b,ApJ, 742, 96
Yan, L., Tacconi, L. J., Fiolet, N., et al. 2010,ApJ, 714, 100
Zubovas, K., & King, A. R. 2014,MNRAS, 439, 400


![Fig. 3. Left panel: L 0 (CO[1−0]) against the IR luminosity (8−1000 µm) showing a compilation of MS galaxies at 0 < z < 2.5 from the Sargent et al](https://thumb-eu.123doks.com/thumbv2/123doknet/13455315.411186/6.892.111.805.116.459/fig-left-panel-luminosity-showing-compilation-galaxies-sargent.webp)