HAL Id: hal-00707095
https://hal.archives-ouvertes.fr/hal-00707095
Submitted on 16 Jun 2012HAL is a multi-disciplinary open access archive for the deposit and dissemination of sci-entific research documents, whether they are pub-lished or not. The documents may come from teaching and research institutions in France or abroad, or from public or private research centers.
L’archive ouverte pluridisciplinaire HAL, est destinée au dépôt et à la diffusion de documents scientifiques de niveau recherche, publiés ou non, émanant des établissements d’enseignement et de recherche français ou étrangers, des laboratoires publics ou privés.
Bridging the Gap Between Organisational Needs and
ERP Functionality
Colette Rolland, Naveen Prakash
To cite this version:
Colette Rolland, Naveen Prakash. Bridging the Gap Between Organisational Needs and ERP Func-tionality. Requirements Engineering, Springer Verlag, 2000, pp.1. �hal-00707095�
Bridging The Gap Between Organisational Needs And ERP
Functionality
Colette Rolland & Naveen Prakash
Université Paris1 Panthéon Sorbonne CRI, 90 rue de Tolbiac,
75013 Paris, France rolland@univ-paris1.fr
British Council 17 Kasturba Gandhi Marg,
110001 New Delhi, India praknav@hotmail.in
Abstract
We argue that ERP installations are difficult to align to specific requirements of the enterprise because of the low level at which ERP functionality is described. We raise this level from a functional description to a goal-oriented one. We use SAP R/3 to illustrate this. A SAP goal expresses the task that a SAP function carries out and abstracts away from the performance of this task. Since a SAP goal can be achieved in many ways, we introduce the notion of SAP strategies. We organise goals and strategies as a directed graph called a map. We illustrate the map with the Materials Management Module of SAP. In order to evaluate and compare the use of the map with the functional approach, we develop an evaluation framework. The evaluation and comparison is presented. The materials management map is then used to align the SAP module to the stores and purchase department of an academic institute.
1. Introduction
ERP systems provide a software solution comprising several interconnected modules covering most of the key functions (Human Resource Management, Sales, Treasury, etc.) of an enterprise. According to benchmarking done by the Partner Group in 1998, the installation of an ERP system has the following drawbacks:
1. High costs
2. Difficult & time consuming implementation 3. Need for enterprise process re-engineering
4. Difficult alignment to specific requirements of the enterprise 5. Need for massive allocation of internal resources
6. Lack of technical support by the ERP system vendor 7. High possibility of cultural clash
Our concern is with drawback 4 above and to a certain extent with 7 as well. We illustrate our approach by considering the Materials Management Module of SAP R/3. At the highest level, SAP provides a number of modules for different areas of a business. These modules contain components each for a specific sub-area. These components are composed of a set of functions. To enable customising, SAP permits variations in function operation. For example, it allows physical inventory check to be
performed by sampling, periodic monitoring or continuously and the exact variant is chosen during customising. The description of SAP R/3 [ASAP 99] components/functions and variants highlights the “whats and hows” of their operation. It naturally deals with the data that is to be maintained/supplied and the actions that are carried out. The mapping of a business process to this level of description is evidently not a straight-forward task. SAP R/3 obtains this mapping by forcing organisations to realign their processes to the SAP R/3 Enterprise Model.
In Figure 1 we show this at the lower level by the relationship between enterprise
business processes and the functions of the SAP Enterprise Model. At this level the
alignment to organisational needs is difficult to achieve because (a) the amount of detail to be handled is very large and mastering it gets very difficult and (b) organisations think in terms of their goals and objectives and not in terms of SAP functions. The latter results in a mismatch between organisational requirements and their resolution in SAP.
Enterprise Goals SAP Goals
Enterprise Processes SAP Enterprise Model
Abstracting Abstracting Matching Aligning Intentional level Operational Level SAP Functions
Figure 1 : Levels of description
To obviate these difficulties we propose that the expression of the functionality of an ERP system should be done in a goal driven manner. Goal-oriented approaches have been found useful in both requirements engineering [Potts 1994], [Bubenko 1994], [Cockburn 1995], [Rolland 1998b] and BPR [Lee 1993], [Anton 1994], [Yu 1994], [Ould 1995], [Hsiao 1998]. In the former they have proved useful in aligning system functions to organisational requirements whereas in the latter goals drive the re-engineering of business processes; thus, they can help in resolving problem (b) above. By avoiding unnecessary details, goal-oriented approaches help in focusing attention on what is to be achieved and the strategies required to achieve them, thus contributing to the resolution of problem (a).
Our proposal is that the alignment should be done at the higher level of enterprise
business goals. As shown in Fig. 1, this means that we should develop the notion of SAP goals. A SAP goal expresses the task that a function carries out and abstracts away
from the performance of this task. In so doing, it emphasises the purpose of the function, its goal. This helps in selecting the SAP function that meets the organisation’s goals.
Goal modelling constructs AND/OR goal hierarchies [Loucopoulos 1997] where AND represents goal decomposition and OR represents alternative ways of achieving a higher goal. Both constructs are relevant for SAP goals. The former helps us in reasoning
about tasks at different levels of abstraction. The latter gives us the notion of the strategy for goal achievement. This is useful because SAP strategies will make explicit the different ways in which an organisation can perform a task and thus, help in the selection of the appropriate SAP function variant.
We conclude that the alignment problem would be mitigated by the development of a
representation system based on goals and strategies. In this system, the tasks performed
by functions would be goals and the different ways in which tasks are performed would be goal-achievement strategies. We propose to use the notion of a map to represent SAP goals/strategies. A map is a directed labelled graph, with nodes as intentions and
strategies as edges. An edge entering a node identifies a strategy that can be used for
achieving the intention of the node. The map therefore, shows which intentions can be achieved by which strategies once a preceding intention has been achieved. Evidently, the map is capable of expressing organisational goals and their achievement. In this paper we show how it can form the bridge between the high level expression of goals/goal-achievement achievement and the low level functional view of SAP.
The layout of the paper is as follows: In the next section we present the notion of a map. In the following section, we provide an overview of SAP R/3 and a short description of the Materials Management Map. In section 4 the business of Materials Management is represented as a map. In section 5, we discuss how this representation helps resolving the alignment problem. We illustrate the use of the map to align the requirements of Materials Management in an academic institution in section 6. Finally, we draw some conclusions and identify future work in section 7.
2. The Concept of a Map
A map is a process model expressed in intentional terms. It provides a representation system based on a non-deterministic ordering of intentions and strategies. We will use it as a means for representing SAP goals/strategies and as a basis for aligning SAP functions to organisational requirements.
2.1 Introducing the map
A map is a labelled directed graph with intentions as nodes and strategies as edges between intentions. The directed nature of the graph shows which intentions can follow which one. An edge enters a node if its strategy can be used to achieve the intention of the node. Since, there can be multiple edges entering a node, the map is capable of representing the many strategies that can be used for achieving an intention.
An intention is a goal that can be achieved by the performance of a process. It refers to a task that is expressed at the intentional level and is part of the process. Each map has two special intentions, Start and Stop, to start and end the process respectively.
A strategy is an approach, a manner to achieve an intention. The strategy Sij
characterises the flow from the source intention Iito the target intention Ij and the way Ij
A section is the key element of a map. It is a triplet <Ii, Ij, Sij> and represents a way to
achieve the target intention Ij from the source intention Iifollowing the strategy Sij. Each
section of the map captures the condition to achieve an intention and the specific manner in which the task associated with the target intention can be performed.
Sections of a map are connected to one another. This occurs :
(a) when a given task can be performed using different strategies. This is represented in the map by several sections between a pair of intentions. Such a map topology is called a multi-thread.
(b) when a task can be performed by several combinations of strategies. This is represented in the map by a pair of intentions connected by several sequences of sections. Such a topology is called a multi-path. In general, a map from its Start to its
Stop intentions is a multi-path and may contain multi-threads.
As an example consider the map of Figure 2 which contains six sections MS0 to MS5. It can be seen that MS1 and MS2 together constitute a multi-thread whereas MS4, MS1 and MS4, MS3, MS2 are two paths between Ikand Iiconstituting a multi-path.
Ski Sii Sij1 Sij2 MS0: Start, Ik,Sstart k MS1: Ii, Ij,Sij1 MS2: Ii, Ij,Sij2 MS3: Ii, Ii,Sii MS4: Ik, Ii,Ski MS5: Ij, Stop, Sj stop Ij Ik Ii Start Stop Sstart k Sj stop Figure 2: A map 2.2 Refining a section
It is possible to refine a section of a map at level i into an entire map at a lower level
i+1 to view a task together with its strategy as a complex graph of subtasks and their
associated strategies. Refinement as defined here is an abstraction mechanism by which a complex assembly of sections at level i+1 is viewed as a unique section at level i. Since refinement results in a map, it produces multi-path/multi-thread structures at level
i+1. As a result, a pair of subtasks can be connected through several sequences of
strategies and different paths are provided to support different combinations of strategies and subtasks. Thus, a level i section is a more complex structure than a simple composition structure in that it provides (a) several alternative decompositions of the aggregate structure into its constituents Ci and (b) different alternatives to Ci constituents.
As an example, consider the refinement of section MS1 above presented in Figure 3. At a lower level of detail, the unique section <Ii, Ij, Sij> is a map including two multi-threads from Start to Im, and from Imto Ij and composed of several paths from Start to
Stop. Start Ij Stop Ii Sij Im Ii Sstm1 Sstm2 Smi Sim Sststop Sistop MS1 Smi2 Ii Im Smi1
Figure 3 : A section refinement
2.3 Unbundling sections
In a multi-thread, strategies are usually related by an AND/OR relationship; one or several of the set being applicable in a given situation. In cases of an exclusive OR relationship, it is possible to bundle the set of alternative strategies as shown in Figure 3 above with the section <Im, Ii, Smi> ( the bold dotted line). This section is a bundle of <Im, Ii, Smi1> and <Im, Ii, Smi2> as shown in the Figure. This allows us to (a) make explicit alternative threads in a multi-thread and (b) make the graphical representation easier to understand.
2.4 Sections as map components
Our position is that the map can be viewed as a complex assembly of process chunks that we refer to as map components. This is achieved by simply relating each section in a map to a map component. For example, the map of Figure 2 is composed of 6 map components, MS0 to MS5. Each component is a cohesive chunk, coupled with other chunks in the map but, being possibly coupled with other chunks in different maps. In this sense, a map component is reusable. We will see later on that this will form the basis for constructing the assembly of SAP functions that meet the requirements of a specific organisation.
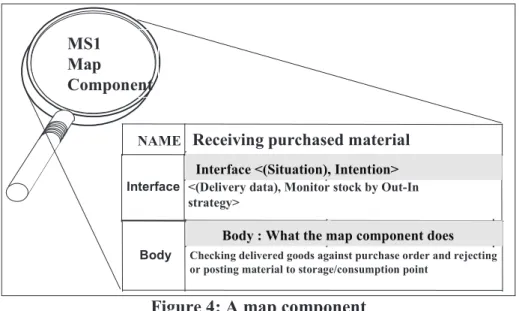
As an autonomous chunk we propose to describe each map component by its interface and its body. The body is what the component really does or intends to do whereas the interface is the visible part of the component. By extension, a map is itself a component and has its own interface and body.
The interface of a map component is a couple <(situation), intention> where the
to the goal that can be fulfilled in that situation. We include the name of the strategy in the statement of the intention. Therefore, the map component for a section <Ii,Ij,Sij1> has an intention interface of the form Ij with Sij. It will be noticed that the situation of a map component expresses the state reached after the achievement of the intention Ii.
Thus, there is a tight connection between the map components and the map : (a) each section in the map is associated to a component; (b) the interface intention of the component is the target intention of the section completed by the name of the section strategy and (c) the interface situation refers to the state resulting from the fulfilment of the source intention of the section.
The body describes the way in which the intention is achieved. Depending on the abstraction level of the intention, this can be done in terms of intention achievement or in operational terms. The former corresponds to an intention which requires refinement before it can be operationalised in a real process whereas the latter corresponds to a directly operationalisable intention. In the first case the map component is refined as a map at a lower level of abstraction thereby providing a meaningful way of understanding a component as a complex assembly of components. This refinement continues till the operational level is reached. At this level the body describes an operational process leading to the construction of some product. Map component refinement is therefore a means to articulate the consequences of satisfying a high level component intention on the product under development. In the case at hand, this will help us to associate the intentional SAP goals (Fig. 1) to operationalised SAP functions and computer interfaces.
NAME Receiving purchased material
<(Delivery data), Monitor stock by Out-In strategy>
Interface <(Situation), Intention>
Checking delivered goods against purchase order and rejecting or posting material to storage/consumption point
Body : What the map component does
MS1 Map Component
Interface
Body
Figure 4: A map component
The body of the map component MS1 shown in Figure 4 for example, describes a process chunk providing IT support to accept or reject delivered material against purchase orders based on checks and reconciliation procedures and to monitor the stock accordingly. For MS1, the interface has “Delivery data” as its situation and “Monitor
Stock by Out-In strategy” as its intention.
As pointed out earlier, a map is a multi-path, multi-thread structure which contains several process models. In this sense, a map is a multi-process-model [Rolland 1999]. A process model is any path from Start to Stop. The exact process model to be used can be decided either dynamically or statically. The former is suitable when a process exhibits large deviations from its process model. To handle these, we need to construct the process model “on-the-fly”. The latter is suitable in those situations where a map describes a generic solution to a class of problems that require customising for specific organisations. This is the case for ERP maps.
We define map customising as a means to construct process models statically. Map customising is composed of two main activities, pruning and grafting which eliminate and introduce respectively elements of the map. These elements are intentions, strategies, strategies of a bundle and sections. Pruning eliminates those parts of the map that are irrelevant whereas grafting introduces elements to satisfy specific needs that are not available in the original map. These two therefore help in the construction of a customised map specifically tailored to the needs of an organisation.
2.5 Summary
The map has the following main properties
- Map intentions express tasks and hide the details of task implementation. - Map strategies are made explicit, thus showing the different ways of
achieving a task.
- The map is a multiple assembly of tasks (through multi-path) with multiple ways of achieving tasks (through multi-threads) thus representing multiple variations in a class of business processes.
- Map refinement is a means for expressing tasks at any level of complexity. - Map recursion allows customising at different levels of abstraction.
3. SAP
In this section we provide an overview of SAP R/3 functionality and outline its materials management module. This information has been obtained from Using SAP R/3 [ASAP 99]. The materials management module will be used in the next section to build a materials management map.
3.1 Overview
SAP R/3 aims to provide a complete infrastructure for corporate information processing. It does this by offering a set of standard business applications. These can be tailored to meet the specific needs of an organisation.
The set of standard applications consists of about 20 modules like Materials Management, Production Planning, Sales and Distribution, Financial Accounting etc. Each module consists of a number of components. The Materials Management module has 7 components. Each component has a number of functions. Thus, the Inventory Management component of the Materials Management module provides, among others, functions for Goods Receipt and Goods Issue.
Modules of R/3 do not work in isolation but may be inter-related to one another. For example, the Invoice Verification component of the Material Management module sends data to the Financial Accounting and Assets Management modules. Similarly, the components of a given module may be dependent on one another. For example, the Materials Requirements Planning component prepares purchase order requisitions for processing by the Purchasing component. Finally, functions of a component are also inter-related. Thus, the function for generating a materials forecast is used by the function for forecasting material requirements.
Some modules, components of modules, and functions of components are optional. Further, SAP provides, through ABAP/4, a means to introduce new functionality to meet any situations that it cannot handle. As a result of this flexibility, each R/3 installation can be built to fit the client organisation. The process of adapting SAP R/3 to an organisation is called customising. It consists of selecting the components and fine tuning their functions. Customising is facilitated by a set of tools available as part of R/3 BASIS which is the core of SAP R/3. Thus, R/3 Analyser, a constituent of R/3 BASIS, is used to select the functions of interest from the R/3 Reference Model. Fine tuning is mainly concerned with the data to be manipulated and the transactions to manipulate them. For example, the material type can be tuned to the practice of the company.
3.2 Material Management Module
Following the overall architecture of SAP software, the application area of materials management is a R/3 module. This module provides automated support for the day-to day operations of any type of business that entails the consumption of materials. It consists of seven components as follows:
1. MM-MRP Materials Requirements Planning: It determines the requirement of materials and automatically generates purchase requisitions to be forwarded to the purchasing department.
2. MM-PUR Purchasing: The component aims to automate the routine tasks of purchasing like creating purchase orders by reuse of already existing ones, tracking purchase requisitions, responding to requests for quotation, and generating reports. 3. MM-IM Inventory Management: It supports planning, data-entry, and
documentation of all goods movements to/from and within the storage location in the warehouses of a company.
4. MM-WM Warehouse Management: It keeps track of storage all materials stored in possibly highly complex warehousing structures. It helps in optimising material flow and capacity in the warehouse and storing goods in the most favourable locations. Additionally, it supports the processing of all goods movements together with the MM-IM component.
5. MM-IV Invoice Verification: It checks invoices received by EDI or on paper to ensure that they are cleared for payment only when there is agreement between the purchase order, delivery effected, and the invoice. It transmits information to the Financial Accounting, Controlling, and Assets Management modules.
6. MM-IS Information System: It contains the Purchasing Information System (PURCHIS component) and the Inventory Management system (Inventory Controlling).
Components of modules contain functions. For example, in the MM-MRP component there are functions to do the following :
• Forecast-Based Planning: Generates purchase order requisitions according to material forecast.
• Reorder Point Planning: Generates purchase order requisitions based on reorder point.
• Documenting Material Requirements Plan: Displays material requirements planning list and current situation of stock.
• Generating Material Forecast: Calculates material requirements using historical consumption data. This is done by one of the many forecasting models available in R/3.
• Choosing Lot-Sizing Procedures: Supports the choice of a lot-sizing procedure from a pre-defined set or the definition of a user-specific procedure.
4. The Material Management Map
In its most abstract form, materials management has the intention of satisfying material need effectively in an organisation, i.e. supplying material in the right quantity at the right place and time at the minimum cost. When treated as a component, the material management map in Figure 5 has <(As-Is Model), Satisfy Material Need Efficiently> as its interface.
The map contains two intentions, Purchase Material and Monitor Stock. This is based on the view [Garg 99] of materials management as “procuring raw material and ensuring effectiveness of the logistics pipeline through which materials flow”. This view shows that material procurement and its subsequent monitoring are the two key intentions. Evidently, there is an ordering between these two intentions: stock cannot be monitored unless it has been procured. This is shown in Fig. 5 by the section <Purchase
Material, Monitor Stock, Out-In strategy >.
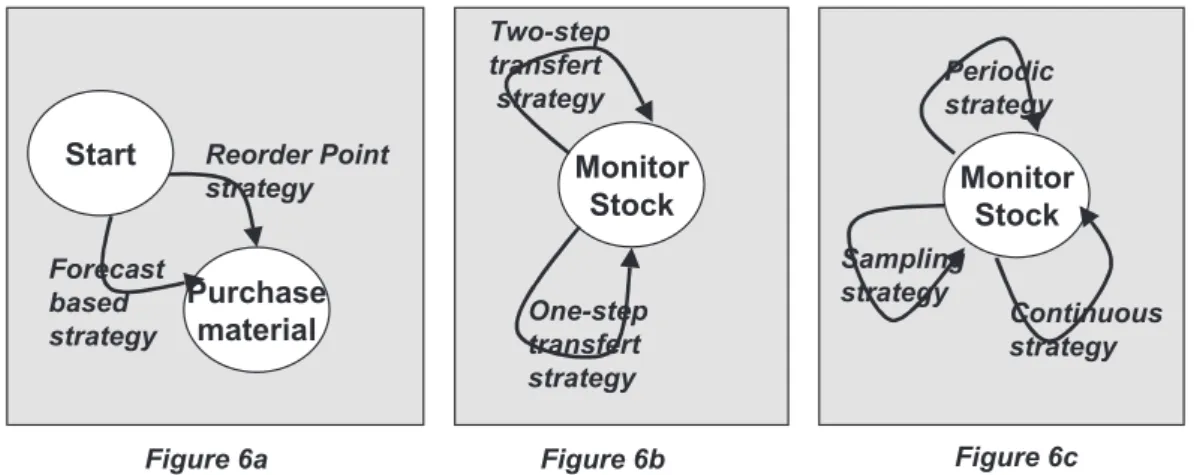
Since Purchase Material is an intention, the ways in which purchase orders can be generated become strategies for its achievement. This is shown in Fig. 5 by the two strategies (a) Planning strategy and (b) Manual strategy. The former is a bundle consisting of the Reorder point strategy and Forecast based strategy (see Figure 6a). The latter allows the buyer to manually enter a purchase requisition leading to the generation of the purchase order. The bundled strategies correspond to the SAP functions of MM-MRP Forecast Based Planning and Reorder Point Planning respectively whereas the manual strategy is part of the MM-PUR component.
The paths from Start to Monitor Stock via Purchase Material are the normal ones. However, it may happen that material is purchased without generating a purchase order. This is the case when material is purchased against a bill-for-expenses. This is shown in Fig. 5 by the Bill for expenses strategy which directly connects the Start intention to
Monitor Stock. It makes explicit the fact that materials management includes the
exceptional case where material is purchased without a purchase order. In SAP, purchasing material against bill-for-expenses is a function of MM-IV, the Invoice Verification component.
The map shows that there is only one thread between Purchase Material and Monitor
Stock, that using the Out-In strategy. This strategy represents the ways in which
compliance of delivered material with the purchase order can be ensured and stock entry made. This refinement of the section <Purchase Material, Monitor Stock, Out-In
strategy> is shown in Figure 7 and will be discussed later. In SAP, this section is
covered by functions of the MM-IM and MM-WM components.
If the delivery is not made in due time then the Reminder strategy can be followed to remind the vendor to deliver material.
Stop Planning strategy Start Purchase Material Monitor Stock Out-In strategy Bill for expenses strategy Reminder strategy Quality inspection strategy Inventory balance strategy Valuation strategy In-In strategy Reservation strategy Manual strategy Financial control strategy
Figure 5: The material management map
Monitor Stock is the second key intention of the material management map. The
intention represents the management goal of ensuring effectiveness of material logistics while maintaining financial propriety. It gives rise to a number of sections as shown in the Fig. 5 each of which is a way by which this management goal can be fulfilled. Effectiveness of material logistics requires
• Control of material movement to/from warehouses • On-time transfer of material to consumption points • Quality control of the material transferred
These correspond in the map to the In-In, Reservation, and Quality inspection
strategies.
Financial propriety requires
• Physical stock taking of the material • Valuing the stock for balance sheets
These are represented in the map by the Inventory balance and Valuation strategies respectively.
Support for movement of goods from a warehouse is represented by the section
<Monitor Stock, Monitor Stock, In-In strategy>. As shown in the Figure, this section is
a bundle of two sections (see Fig. 6b) having strategies One-step transfer and Two-step
transfer respectively. The latter corresponds to the case when the stock to be transferred
spends a long time in transit whereas the former is the case of immediate transfer. In SAP, this bundled section is covered partly by MM-IM and MM-WM and has a relationship with Financial Accounting, Assets Management, and Controlling.
Purchase material
Start Reorder Point
strategy Forecast based strategy Monitor Stock Two-step transfert strategy One-step transfert strategy Monitor Stock Periodic strategy Continuous strategy Sampling strategy
Figure 6a Figure 6b Figure 6c
Figures 6 : Bundles of the material management map
The Reservation strategy is a way of ensuring on-time material availability. This allows a material reservation to be made for delivery at the appropriate time to the appropriate consumption point. In SAP, this is handled by the MM-IM component.
The Quality inspection strategy allows material to be moved so that its quality can be inspected.
The Inventory balance strategy is one of the two ways of maintaining financial propriety. It is a bundle of three strategies, namely, periodic, continuous and sampling strategies as shown in Fig. 6c. This bundle is handled by the MM-IM component in SAP.
The Valuation strategy is the second way of ensuring financial propriety. It allows the stock to be valued for purposes of preparing a balance sheet. This strategy can also be treated as a bundle of mutually exclusive strategies such as LIFO and FIFO. In SAP, only LIFO valuation is available as a function in MM-IM.
The complete fulfilment of Satisfy Material Need Effectively requires that the financial aspects of material procurement are properly handled. This is done by the Financial control strategy allowing the flow from Monitor Stock to Stop. In SAP, this takes the form of the Invoice Verification component, MM-IV.
The map of Fig. 5 contains 11 components, three of which are bundles. These have been numbered in Table 1 and each component has been given a name. The Table gives the signature of each component and provides a description of the body which shows how the intention is operationalised in SAP R/3. In this way, the Table establishes a relationship between the intentional view of the map, the SAP goals and their implementation in SAP functions.
Code Name Signature Description
C1 Purchasing based on
planning < (Stock data), Purchase Material by planning strategy >
Automatically generates purchase order requisitions which are converted into purchase orders. C2 Purchasing manually <(Stock data), Purchase
material by manual strategy>
Manual creation of purchase requisitions. Proposals are submitted to the purchase department for approval and electronic signature
C3 Receiving stock by bill for expenses
< (Stock data), Monitor stock by bill for
expenses>
Allows the direct entry of material items in stock. C4 Reminding on delayed delivery < (Purchase order), Purchase Material by reminder strategy> Automatically generates a
proposal of reminder to be sent to the vendor and enters a note in the purchase order history. C5 Receiving stock of
purchased material
<(Purchase order, delivery data), Monitor Stock by Out-In
strategy>
Checks delivery against purchase order and posts to
consumption/storage point. (see component refinement in Fig. 7)
C6 Reserving material <(Stock data, reservation request), Monitor Stock for reservation>
Posts the material requested under the heading ‘reserved stock’.
C7 Inspecting stock quality <(Quality data), Monitor Stock by quality
inspection strategy>
Posts materials in quality inspection stock and documents inspection results. If quality conforms to the predefined quality requirements then the material is moved to unrestricted use stock.
C8 Conducting a physical inventory
<(Stock data), Monitor Stock by inventory balance strategy>
Supports the taking of a physical inventory by creating physical inventory documents.
C9 Evaluating the value of stock
<(Stock data), Monitor Stock by valuation strategy>
Assigns and records values automatically to materials on an on going basis.
C10 Moving stock <(movement request), Monitor Stock with In-In strategy>
Posts material withdrawals, creates goods issues and transfer orders, and updates the quantity and value of the warehouse stock C11 Verifying invoice
against delivery
<(Good receipt), Stop by invoice verification strategy>
Checks automatically invoices against purchase orders and goods receipts and blocks payments if necessary.
The map in Figure 7 is the refinement of the C5 component of Table 1. The Out-In strategy does not permit stock entries unless they have been checked. This is reflected in Fig. 7 by the ordering of the two intentions, Accept Delivery and Enter Goods in Stock. There are two ways of achieving the intention, Accept Delivery, the Okay strategy and
Reconciliation strategies. The latter comprises three reconciliation strategies, Reconciliation by PO recovery, Reconciliation of unit difference, and Reconciliation of under/over delivery. Each of these provides a way of accepting delivery that are within
specified tolerances. The Okay strategy of accepting deliveries applies in the case where delivery conforms to the purchase order. Finally, the Rejection strategy provides a way of rejecting a bad delivery. This strategy allows a flow from Start to Stop in recognition of the fact that a bad delivery does not cause a stock entry.
There is a multi-thread from Accept Delivery to Enter Goods in Stock based on two strategies, Out-In direct consumption and Out-In storage based strategy. The former is for entering goods in stock when delivery is made directly to the consumption location whereas according to the latter, the goods are stored in the warehouse.
The Monitor Stock intention of the C5 map component of Fig. 5 is fully satisfied when
the Completeness strategy of its refined map is used to reach Stop. This strategy takes
into account all the consequences of entering goods in stock.
Reconciliation by PO recovery Reconciliation of unit difference Out-In storage based strategy Out-In direct consumption strategy Accept delivery Start Enter Goods in stock Completeness strategy Stop Reconciliation of under/over delivery Rejection strategy Okay strategy
Figure 7: Refinement of the component C5
Similar to Table 1, we present in Table 2 the 8 components of the map of C5. As before, the Table gives the code, name, and the signature of each component and provides a description of the body in SAP functional terms.
Code Name Signature Description
C5.0 Reconciling under/over delivery
<(Delivery data), Accept delivery by reconciliation of under/ over delivery strategy>
Automatically checks under/ over delivery tolerances and generates goods receipts. C5.1 Reconciling
delivery with unit difference
<(Delivery data), Accept delivery by reconciliation of unit difference strategy>
Automatically converts unit of measure differences, checks for tolerances and
generates goods receipts. C5.2 Recovering
missing PO for delivered material
<(Delivery data), Accept delivery by reconciliation PO recovery strategy>
Automatically searches for an open purchase order matching the delivered material.
C5.3 Accepting delivery <(Delivery data), Accept delivery by Okay strategy>
Automatically checks the compliance of the delivered goods with the purchase order and generates goods receipts.
C5.4 Rejecting delivery <(Delivery data), Stop with rejection strategy>
Records rejection of the delivery in the purchase order history.
C5.5 Posting goods to direct
consumption point
<(Goods receipt), Enter Goods with Out-In direct consumption strategy>
Posts goods to direct consumption account. C5.6 Posting goods to
storage point
<(Goods receipt), Enter Goods with Out-In storage based strategy>
Posts goods to storage location account. C5.7 Completing
housekeeping
<(Goods receipt), Stop using completeness strategy>
Completes data update related to delivery in Financial Accounting, Controlling and Asset Management modules.
Table 2: Description of components
5
.
Evaluating The MapIn this section we evaluate the map as a means of representing the functionality of ERP systems. This evaluation is done from the requirements engineering point of view. In other words, we explore the extent to which the map provides a means to better align ERP functionality to organisational requirements. To facilitate this we adapt the CREWS framework [Rolland 1998b] for characterising and comparing scenario based approaches in requirements engineering to our needs. This adapted framework is first presented and then used to characterise the map and SAP descriptions of ERP functionality. This will lay the basis for comparison of the two.
5.1 The adapted framework
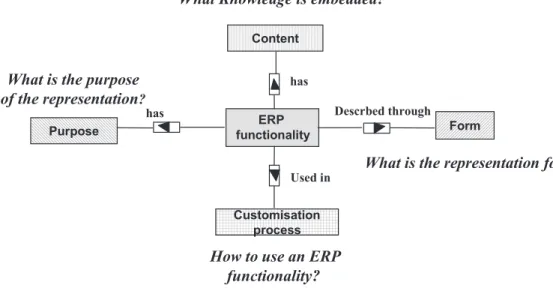
Similar to the CREWS framework, the evaluation framework of Figure 8 is organised as a facetted framework [Prieto-Diaz 1987] around four views. Each view is further decomposed into facets which have attributes to which the framework attaches a set of pre-defined values. The evaluation of a specific representation system for ERP functionality results in a table of values for each attribute of the facets. Comparison of two different representation systems is organised around their two tables of values.
ERP functionality Purpose Content Form Customisation process has
has Descrbed through
Used in
What Knowledge is embedded?
What is the representation form? What is the purpose
of the representation?
How to use an ERP functionality?
Figure 8: The evaluation framework
Figure 8 shows that there are four views of ERP functionality namely Content, Form,
Purpose, and Customisation Process. Content refers to the knowledge that is included
in the representation system; Form refers to the structure and notation used; Purpose refers to the objective fulfilled by the representation system and the kind of use which it facilitates; Customisation Process refers to the process by which the ERP functionality is customised to meet specific organisational needs. Each view is further detailed in Figures 9 to 12.
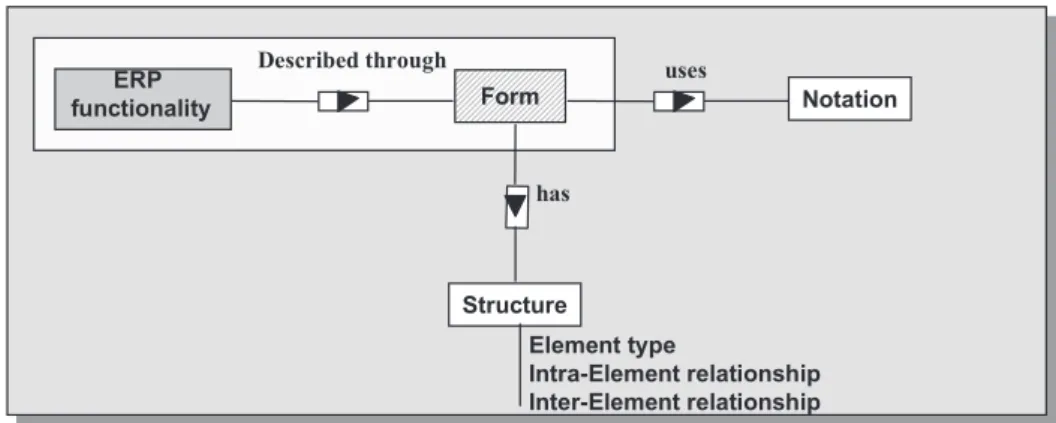
There are two facets of the Form view (Fig. 9) namely Notation and Structure. The values that we propose for the Notation facet are as follows:
Notation:ENUM {Formal, Semi-formal, Informal}
Structure refers to the types of element and their types of relationship. This leads to the
three attributes, Element type, Intra-Element relationship and Inter-Element relationship. The proposed sets of values are as follows:
Element type: BOOLEAN
Intra-Element relationship: SET(ENUM{ Flat, Nested })
Inter-Element relationship: SET(ENUM{ Composition, Generalisation, AND, OR,
ERP functionality Form Described through Notation Structure uses has Element type Intra-Element relationship Inter-Element relationship Figure 9: The Form view
The Purpose facet (Fig. 10) has three attributes which identify three types of objectives met by the representation. These are,
Descriptive: BOOLEAN Explanatory: BOOLEAN Exploratory: BOOLEAN
An Exploratory representation system proposes different design alternatives whereas an Explanatory representation justifies the particular alternative that has been adopted. A Descriptive representation is different from an explanatory one in that it describes the alternative adopted and does not try to justify it.
ERP functionality Purpose Aim of Representation Descriptive Exploratory Explanatory has
Figure 10: The Purpose view
The Content view (Fig. 11) has four facets namely, Abstraction, Context, Coverage, and
Argumentation. The Abstraction facet identifies whether or not the representation
supports several levels of abstraction. Its values are as follows:
Abstraction : ENUM {Unique, Fixed, Flexible}
The Context facet identifies whether the representation provides a “narrow” or “rich” picture of the functionality. The latter looks at the functionality within the larger context of its organisational environment whereas the former looks at the functionality in isolation. This facet has three attributes :
Internal: BOOLEAN Interaction: BOOLEAN Contextual: BOOLEAN
The Coverage facet captures the nature of the contents of the representation. The two attributes of this facet identify the Functional and Intentional nature of the content respectively. The values of these are given below:
Functional: BOOLEAN Intentional: BOOLEAN
The Argumentation facet identifies if the representation includes argumentation on alternatives to support the selection of the most appropriate one in the situation at hand. It has two attributes /
Variant: BOOLEAN Arguments: BOOLEAN ERP functionality Content Abstraction Argumentation with with Variant Arguments Functional Intentional Internal Interaction Contextual Coverage with Context has with
Figure 11: The Content view
The Customisation Process facet (Fig.12) identifies the approach adopted for customising and the process paradigm. These are captured in the two attributes, Approach and Paradigm whose values are given below:
Approach: ENUM{ Top-down, Bottom-up, Middle-out, Single-level, Breadth-first,
Depth-first}
Paradigm: ENUM {Data-driven, Requirements-driven, Quality-driven,
Behaviour-driven} ERP functionality Customising process Is used through Approach Paradigm
5.2 Evaluation under the framework
We will now use the Framework to first evaluate and then compare the representation system of SAP and the map. Table 3 contains the values assigned to the attributes and facets for both of these.
View Facet: Attribute SAP Map
Form : Notation Informal Semi-formal Structure: Element Type Module,
Component, Function Section (Intention, Strategy) Structure: Inter-Element relationship
Composition AND/OR, OR,
Precedence, Composition, Refinement Form Structure: Intra-Element relationship Flat Nested Descriptive Yes No Explanatory No Yes Purpose Exploratory No Yes
Abstraction Fixed Flexible
Context : Contextual No Yes
Context : Interaction Yes No
Context : Internal Yes No
Coverage : Intentional No Yes
Coverage : Functional Yes Yes
Argumentation: Variant No Yes
Content
Argumentation No Yes
Approach Top-down Top-down, Breadth-first
Customising
Process Paradigm Data-driven Requirements-driven
Table 3:Evaluation under the framework
Broadly speaking, the Table shows that the Customisation Process in both SAP and Map is operationally top-down but the drive behind it is absolutely different. In SAP customising means adapting the type of data and the type of processing performed on the data to suit the individual company. In contrast, customising in the map is the selection of SAP goals and strategies fitting organisational needs. Besides, this process operates on two very different bases having different purposes, forms and contents. We elaborate this comparison further in the following, using the Table as the basis for understanding the relevance of each view for solving the alignment problem.
Form
An evaluation of the notation used shows that SAP uses an informal, textual description of the functionality offered. The map is semi-formal. It is a directed graph but has been adapted to represent bundles and graph refinement.
The Element Type of the Structure attribute contains three elements for SAP, namely
Module, Component and Function. In SAP R/3 “an application or module is a set of
programs designed for a specific type of business data processing”[ASAP 1999]. Although notions of components and functions are used, they are never really defined. However, a reading of [ASAP 1999] leads to the inference that a module contains components which have functions. The Element Types of the map are Intentions,
Strategies, and Sections. However, from the structural point of view, the key notion is
that of a section. A section is defined as a triplet <Ii, Ij, Sij>, where Ii, Ij are intentions
and Sij is a strategy.
In so far as Inter-Element relationships are concerned, SAP uses composition as the principal one. Modules are composed of components which are composed of functions. Some components of a module as well as some functions within a component are optional. None of these relationships is explicitly defined. Element relationships in the map are more varied. A section is composed of two intentions and a strategy. Section bundles are ORs of sections. Multi-threads are AND/OR of sections and sections can be in a succedence/precedence relationship with one another.
The representation of any of the three SAP elements introduced above is flat. There is no intra-structure within an element. On the other hand, a section in the map can be refined as a map. This introduces a nesting relationship between map elements.
Purpose
As shown in Table 3, the purpose of the map is to describe SAP functionality. In contrast, the map highlights the alternative strategies to achieve an intention, thus taking an exploratory attitude. It exhibits the many ways of carrying out a task, thus supporting the exploration of the solution space. Besides, the component description associated with each section of the map provides explanations of the various choices and therefore, the map fulfils an explanatory purpose as well.
Even though functions/components can be optional in SAP, the exploratory dimension behind it is not exploited.
Content
The abstraction facet deals with the levels of abstraction at which the same functionality is represented. In SAP, there is a fixed decomposition of the entire SAP functionality into modules, components and functions. Besides, the SAP representation is unbalanced in the sense that module and component descriptions are not understandable unless one reads the description of the functions they are made of. Thus, in fact, there is one unique
level which provides both some general statements about the function and also very
detailed information such as the data to be entered through the computer interface to activate a data processing transaction. Modules and components are represented as collections of such statements.
The map representation system includes a refinement mechanism through which a section in a map is viewed itself as a map. The mechanism can be used repeatedly, thus giving raise to a flexible number of refinements of the same initial task and strategy.
The context facet in Table 3 shows that the SAP representation is valued as interaction and internal. Clearly SAP emphasises the interaction point of view detailing the way in which a user can interact with the computer system through interfaces of data processing transactions. Textual descriptions give the necessary hints to understand how the function is implemented in data processing terms. The map representation system focuses on putting functions in the organisational context in which they will operate, it is contextual. However, through section refinement and component descriptions, it makes apparent the WHY (contextual) before deepening into the WHAT (interaction) and the HOW (internal).
In so far as the coverage facet is concerned, the SAP representation system is centred around function descriptions, it has a functional coverage. Vice-versa, the map representation focuses on intentional descriptions of the SAP functions, the SAP goals. The notion of a map component creates the link between intentions together with their associated strategies and functions, thus introducing the ability of the map to cover intentional and functional aspects of ERP functionality.
The SAP description does not contain argumentation of possible variants of a given function. Multi-threads and section bundling provide two basic ways of building variants in maps. Their composition in multi-paths builds variants out of these basic ones. Selection of variants implies a reasoned argument that relates the variant selected to the organisational situation that it can handle. Thus, it should be possible to associate the argument with the variant itself. In another paper [], we have shown how to combine variants and arguments to develop guidelines for the rational selection of variants
Customising Process
SAP promotes selection of functions by the drill-down procedure. Starting from large grained functions, this procedure allows their component functions to be revealed and selected. Evidently, this is a top-down approach to customising. The map permits a two dimensional approach to customising. In the horizontal dimension, it allows the selection of variants from multi-threads and multi-paths. This is the traditional
breadth-first approach. In the vertical dimension, refinement of sections allow the top-down approach to be followed. The final process is therefore flexible and can be adapted to
the needs of the customising engineer.
Customising in SAP is affecting “the type of data held in the computer system and the type of processing performed on the data”. This is clearly a data driven paradigm. In contrast, the map promotes customising by the pruning and grafting of sections. This is driven by the intentional and strategic needs of the specific company, it is
requirements-driven.
5.3 Resolving the alignment problem
The framework has identified four main views of ERP functionality. The resolution of the alignment problem is rooted in these. In this section we consider each view and its effect on the alignment problem.
First, the Form view presents the basic interface to ERP functionality. When this is displayed graphically then the customising engineer can view the full functionality holistically. Fig. 5 gives the overall view of materials management in a concise, graphical form. It provides a global understanding of the scope of the materials management application.
Requirements engineering is related to the expression of the objectives and goals of organisations. Evidently, if the representation system comprises elements which are of these types then the alignment will be facilitated. Instead of representing functionality, the map represents the intentions behind these and explicitly brings out the ways in which these intentions are achieved, the strategies. Strategies help in the alignment problem as they make explicit the variants of the same function, thus facilitating at customising time, the choice of the most appropriate one to the situation at hand or identifying the need for an in-house specific development. Besides, distinguishing strategies from intentions help clarifying notions which are often mixed up : the notion of a task and the notion of a manner/instrument to achieve the task. This is illustrated in the MM map of Fig. 5 which shows three strategies for achieving the Purchase Material intention that are presented in the SAP representation as parts of the Planning function. Customising in ERP involves the selection of functions from a panel and their subsequent assembly. An explicit representation of the choices available and their inter-relationships helps the selection activity. Similarly, assembly calls for ordering the selected pieces and is aided by the explicit representation of ordering in the map. In the material management map, the 2 strategy multi-thread between Start and Purchase Material says that both these can be selected. Further, the bundle says that either Forecast-based or Reorder Point strategy can be selected. The ordering between Purchase Material and Monitor Stock provides an in-built assembly in the map itself, thus facilitating the assembly activity.
Second, the Purpose view emphasises the usage facilitated by the representation system. When the usage is a selection and assembly activity then a system that allows an exploration and rational selection from a set of choices is essential. The map facilitates exploration by selecting and assembling path fragments from the Start to the Stop intentions. The capability of the map can be extended by an explanatory facility composed of a guidance and tracing mechanism.
Third, the Content view highlights the knowledge that the representation system provides. It is known that when the problem is complex then the organisation of this knowledge in different levels of abstraction is useful. In addition, in the particular case of ERP, there has to be a transition from high level goals, through functions down to implementation level details. This requires a change of perspective in reasoning about the same problem. In SAP, abstraction is the change in function granularity as seen in the drill-down procedure. However, the map introduces a distinct additional abstraction layer of SAP goals. This introduces a new perspective and establishes a relationship between the goal and function layers, thus facilitating the transition. This new perspective is illustrated in the materials management map of Fig. 5 by the Out-In strategy to Monitor Stock. This is further refined in Fig. 7 to highlight the checks and record keeping activities that it entails.
The SAP goal abstraction layer of the map provides the rationale behind SAP functions. This fits well with experience in requirements engineering that the only way to get the function right is to find the goal that it should meet.
While the Form, Purpose, and Content views bring out the static aspect the Customising
Process view is the dynamic aspect of the representation system. Evidently, the static
influences the dynamic. Still, the dynamic has its own properties which define it. In the case of ERP, the essence of the process is the matching of requirements, selecting and assembling to meet these. We can see it as a prototyping kind of process where by a hit and trial approach the right installation is constructed from the wide range of functions available. The map partly permits this by allowing a two-dimensional customising process, both horizontal and vertical.
6. Applying the Map
In this section we show our experience in aligning the materials management map to the Stores and Purchase Department of Netaji Subhas Institute of Technology. This department is the central procurement agency and the only warehouse of the Institute. Its decision making is largely manual except for the inventory lists that are mechanised. The exercise started with an interview where the first question raised was that of support for a physical inventory check. This was because the Institute was facing a discrepancy between physical and recorded stock. The first impression was that inventory checking was done once every year for the entire Institute. The materials management map was now referred to and it was seen that this could be supported. When the map showed the possibility of a Continuous inventory strategy, it was realised that the Institute does continuous inventory checking for consumable items, stationery, diskettes, etc. Before this realisation, the focus was completely on solving the periodic check problem. Now, however, attention shifted to the total problem of materials management in the Institute.
Evidently two issues emerged from the map:
• There are at least two material types, capital goods and consumables for which the physical inventory checks are performed differently.
• Both Periodic and Continuous inventory checking strategies are needed.
Result 1: Reference to the map triggers the process of recognising new requirements,
clarifying these and identifying applicable parts of the SAP map in addition to the obvious ones.
Result 2: A shift of focus occurred from problem solving to materials management in a
holistic sense. As a consequence of this, it was decided to use the map as a guidance mechanism.
We started with the intention Purchasing Material. When looking at the strategies that the map offers for purchasing material, the following points emerged :
• Almost all capital goods are purchased using the Manual strategy.
• Some purchases are done using Bills for expenses. This is largely for student projects requiring materials, for example, in the Electronics and Communication Department.
• The Reorder point strategy is used for purchasing consumables.
Result 3: The Institute does not do any forecast based purchasing. However, all the
other three strategies are used and these need to be included when customising SAP. The Department was struck by the possibility of automating the generation of purchase orders whenever the reorder level was reached. They agreed that manual handling caused many delays which led to complete absence of stock at times. For materials used for teaching (transparency foils, chalk) this was traumatic. This led naturally to the issue of lot sizing. The agreement was that lot sizes needed to be optimised and studied carefully.
Result 4: The use of the map helps in clearly identifying advantages of using SAP
features, for example, the benefit of automatic purchase order generation.
Result 5: Thanks to the map, critical issues, like lot sizes, needing attention for SAP
adoption come to light very early. The expectation is that this will help in customising SAP.
The analysis of the map continued for the section <Purchase Material, Monitor Stock,
Out-In strategy>. The decision was to look deeper into this section and to refer to its
refined map. In other words, there was a move away from the breadth first to the depth first approach.
All the Reconciliation strategies as well as the Rejection strategy offered in the map are indeed useful. Purchased material is always sent to the warehouse for storage after stock entry. It is subsequently sent to its buyer. The Out-In direct consumption strategy is therefore not applicable. Whereas the Completeness strategy envisages update of information in Financial Accounting, Controlling and Assets Management, only Assets management is needed. This is because material management is only by quantity.
Result 6: The description of the map component helps in identifying the
implementation details of the Completeness strategy as well as cross-module linkages. Having exhausted the refined map, we moved to the map of Fig. 5 again. There is no reservation of material and the Reservation strategy does not apply. Quality inspection is done for all capital goods before they are delivered to the buyer from the warehouse. However, consumer goods do not undergo any inspection. The brand names associated with these are taken to be a quality statement. There is no systematic record of purchase of poor quality consumer goods if the Bill for expenses strategy is used. This emerged as a point of concern. However, in other cases of consumer goods purchase, a record is kept in the Department.
Result 7: Procedural issues that organisations must consider before adopting SAP are
identified, for example, the issue of quality inspection for items purchased through Bill
for expenses is highlighted.
The In-In strategy is a bundle and reference to Fig.6c was made. Out of the two strategies, only the One-step transfer strategy is relevant. The Valuation strategy is
inapplicable because the Institute is not a company and does not produce a balance sheet showing the value of inventory held.
Finally, the last section, <Monitor Stock, Stop, Financial strategy> was taken up. Automatic invoice verification against purchase orders and goods receipts was found attractive. The possibility of invoice analysis and handling blocked invoices through computer support is desirable in the Institute.
Result 8: Customising occurs as a walk-through the map.
7. Conclusion
By expressing ERP functionality in goal-strategy terms, the map provides a generic representation of ERP functionality in a language that is easily understood by an organisation. This helps in the decision on whether or not to adopt the ERP approach and in agreeing on the issues that need to be resolved before ERP installation is done. It nudges an organisation to looking at its systems in a holistic way rather than in narrow operational terms. The map also helps in customising the ERP offer but in high level goal-strategy rather than in low level functionality terms.
The map provides a basis for a two-way interchange, from the ERP package to organisational requirements and vice-versa. This is facilitated by the level at which the interchange takes place, organisational goals-strategies and SAP goals-strategies. As a result, the map has the potential to better align organisational needs with ERP offerings. Finally, it is clear that the map needs to be supported by a guidance mechanism that systematically takes an organisation through the range of facilities offered by an ERP package. This mechanism would present the different choices available for achieving an intention and aid in selecting one or more of these. This will form the topic of future work.
8. References
[Anton1994] A.I. Anton, W. M. Mc Cracken, C. Potts, Goal decomposition and
scenario analysis in business process reengineering. Proceedings of the 6th International Conference CAiSE’94 on Advanced Information Systems Engineering, Utrecht, the Netherlands, Springer Verlag, pp. 94-104, 1994.
[ASAP 1999] ASAP World Consultancy and Blain J. et al, Using SAP R/3, Prentice
Hall of India.
[Bubenko 1994] : J. Bubenko, C. Rolland, P. Loucopoulos, V. De Antonellis,
Facilitating ‘Fuzzy to Formal’ Requirements Modelling , Proc. of the First International
Conference on Requirements Engineering, April 1994, Colorado Springs, Colorado, 1994.
[Cokburn 1995] A. Cockburn, Structuring use cases with goals. Technical report. Human and Technology, 7691 Dell Rd, Salt Lake City, UT 84121, HaT.TR.95.1, http://members.aol.com/acocburn/papers/usecases.htm,1995.
[Garg 1999] Garg V.K. and Venkitakrishnan N.K., Enterprise Ressource Planning
[Hsiao 1998] R.L. Hsiao and R.J. Ormerod A new perspective on the dynamics of
information technology-enabled strategic change, Information Systems Journal,
Blackwell Science, Vol. 8. No. 1 (January 1998), pp. 21-52.
[Lee 1993] J. Lee Goal-Based Process Analysis: A Method for Systematic Process
Redesign, Proceedings of Conference on Organizational Computing Systems, Nov.
1993, Milpitas, CA, pp. 196-201.
[Loucopoulos 1997] P. Loucopoulos, V. Kavakli, N. Prekas, C. Rolland, G. Grosz, and S. Nurcan Using the EKD Approach: The Modelling Component, Research Report (ELEKTRA project), Report No. ELEKTRA/WP2/T2.1/UMIST/3, March 1997.
[Ould 1995] M.A. Ould Business Processes - Modelling and Analysis for
Re-engineering and Improvement, John Wiley and Sons, Chichester, UK, 1995.
[Potts 1994] C. Potts, K. Takahashi, A.I. Anton, Inquiry-based requirements analysis. In IEEE Software 11(2), pp. 21-32, 1994.
[Prieto-Diaz 1987] Prieto-Diaz R., Freeman, P., Classifying software for reusability, IEEE Software, Vol. 4, No. 1, Jan. 1987.
[Rolland 1998a] C. Rolland, C. Souveyet, C. Ben Achour. Guiding Goal Modelling
using Scenarios, IEEE Transactions on Software Engineering, Special Issue on
Scenario Management, Vol. 24, No. 12, 1055- 1071, Dec. 1998
[Rolland 1998b] C. Rolland, C. Ben Achour, C. Cauvet, J. Ralyté, A. Sutcliffe, N.A.M. Maiden, M. Jarke, P. Haumer, K. Pohl, Dubois, P. Heymans, A proposal for a scenario
classification framework. Requirements Engineering Journal Vol 3, No1, 1998.
[Rolland 1999] C.Rolland, N.Prakash, A.Benjamen, A Multi-Model View of Process Modelling, Requirements Engineering Journal, Vol 4, No 4, 169-187, 1999.
[Yu 1994] E. Yu, J. Mylopoulos, Using goals, rules and methods to support reasoning
in business process reengineering. Proceedings of the 27th Hawaii International Conference System Sciences, Maui, Hawaii, January 4-7, Vol. IV pp. 234-243, 1994.