DEEP CONVECTION OCCURRING ABOVE A STABLE PLANETARY BOUNDARY LAYER
by
Bradley Roy Colman
B.S., Montana State University (1977)
Submitted to the Department of Earth, Atmospheric and Planetary Sciences in Partial Fulfillment of the Requirements for the
Degree of
DOCTOR OF SCIENCE at the
MASSACHUSETTS INSTITUTE OF TECHNOLOGY
0
1984, Massachusetts Institute of TechnologySignature of Author
Certified by:
Accepted by:
- CapaA'&it of Earth, Atmospheric and Planetary Sciences, February, 1984
LJ v- .- v... . - - -
-Professor Frederick Sanders Thesis Supervisor
,-
v'
r,
v-4
;
VVI
Il
hFU2gaX~JN,
Professor Theodore R. Madden MASSACUAJSETTS INSTFTUTE Chairman, Departmental CommitteeOF ,CHNOLOGY on Graduate Students
L!S',PARIJS
DEEP CONVECTION OCCURRING ABOVE A STABLE PLANETARY BOUNDARY LAYER by
Bradley Roy Colman
Submitted to the Department of Earth, Atmospheric, and Planetary Sciences in February, 1984 in partial
fulfillment of the requirements for the Degree of Doctor of Science in Atmospheric Sciences
ABSTRACT
We have studied the observed characteristics of "elevated con-vection", defined as thunderstorm activity that occurs in an environ-ment having a gravitationally stable planetary boundary layer overlain by a less stable layer. We have focused specifically on elevated
convection occurring above a frontal inversion, but have made no a priori assumption about the generating mechanism.
First, a climatology of elevated convection for the United States was completed. The data set used in the study contains 1093 obser-vations over a four-year period, which were collected from the 00 GMT
and 12 GMT NMC surface analyses. Second, an investigation into the elevated convection that occurred during the AVE-SESAME I experiment of 10, 11 April 1979 was conducted. The study was built upon a very detailed radar analysis that was the result of compositing hourly photographs of the PPI scopes from seven different radar sites. The elevated convection was found to dominate the storm total precipitation amounts, helping to substantiate the importance of understanding these storms.
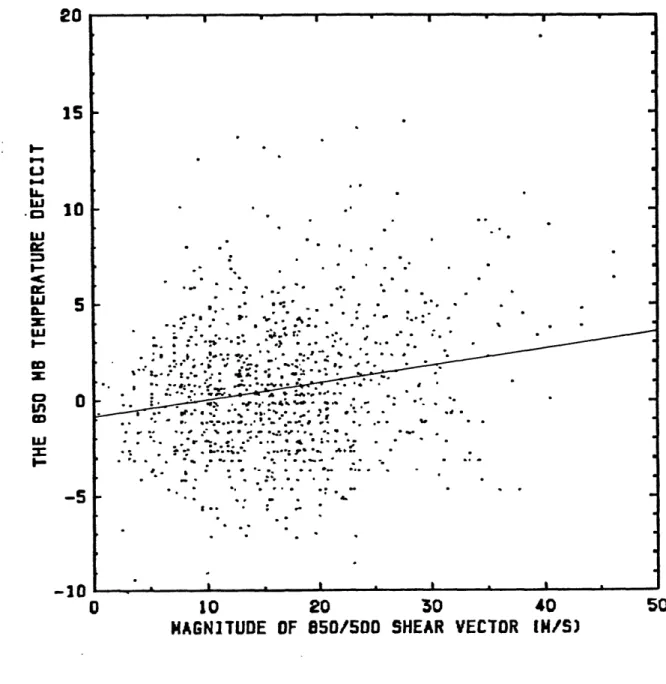
A composite of the data set showed that the typical elevated thunderstorm is found to the northeast of an associated surface low pressure center, and north of a warm front in a region with north-easterly surface winds. The planetary boundary layer is generally very stable with respect to both the 500-mb and 850-mb air. The con-vection is usually found in the left exit region of a low-level wind maxima and in strong warm advection flanked by an area of strong
deformation. There is generally very little latent instability anywhere in the sounding, with the atmosphere nearly moist adiabatic.
The annual frequency distribution of elevated convection was found to be bimodal, with the primary peak in April and the secondary peak in September. The geographical distribution has the major concentration of events occurring in the area from the central Gulf Coast northward into the Mississippi and Ohio River drainages. It was shown that
nearly all winter season (December through February) thunderstorms east of the Rocky Mountains are of the elevated type with the exception of
those over the Florida Peninsula, where ground-based convection persists throughout the year. Most of this winter season elevated convection was found to occur very near the Gulf Coast during periods of extensive overrunning ahead of migrating cyclones across the south-ern tier of states.
In the case study, the convection was observed to occur in three
convective impulses. The initial development of each one took place
in the warm sector, and subsequently propagated onto the frontal surface. Numerous pressure waves were observed in association with the elevated convection, yet, were not found to be important in the
triggering of the elevated thunderstorms. During the lifetime of
these impulses, mesoscale updrafts developed and moved with the con-vective area, maintaining a nearly steady-state system with strong
low-level inflow.
An investigation of a convective band that formed above the frontal surface revealed that the development likely took place in
two steps. Initially, high
e
air overlying the frontal inversionwas stable to vertical displacements, but inertially unstable. Then, along the path of the unstable parcel, the thermodynamic structure changed, and the parcel apparently became grativationally unstable, resulting in upright convection.
Thesis Supervisor: Dr. Frederick Sanders
To all of my family
and
TABLE OF CON TENTS ABSTRACT ...TTS. . . . . * * * * * * * * * * * * * * DEDICATI~l ... ... TABLE OF CCNTB4TS ... CHAPTER 1: INTRODUCTIO4 . ... .. CHAPTER 2: BACKGROUND. . ... ...
CHAPTER 3: CLIMATOLOGICAL SURVEY ... ... . . .... .
3.1 Introduction . . . . .. . . 0 a 0 0 0 0 0 * 0
3.2 Data Source and Selection Process. . . . . . .
3.3 Geographical, Seasonal, and Diurnal Variations
3.4 Dynamic and Thermodynamic Environment. . ..
3.5 Synoptic Types . .... . . . . . ...
3.6 Discussion . ...
CHAPTER 4: AN INVESTIGATICN OF ELEVATED CCOVECTICN DURING
AVE-SESAME I ... ... 95 4.1 Introduction . ... * 4.2 Data Sources . .. ... ... . . . . 4.3 Synoptic Overview. .. ... . .. 4.4 Stability Analysis .. . ... 4.5 Radar Analysis . . .. . ... 4.6 Mesoscale Analysis of Convective Impulses. 4.7 Gravity Wave Analysis. ... . ... 4.8 Discussion . . . . . . . . . . . . ... CHAPTER 5: CCNCLUSICNS . ... REFEIR CES ... * * * * . . . . .. 99 .. .. . ... 103 . ... 125 .. ... .132 . ... . . 160 . . . 189 . . . .* . 195 .. .. .. 200 *. ... 211 APPEN DICES I Upper-Air Soundings from AVE-SESAME I. .. II AVE-SESAME I Grid Point Data Set . . . .. III Complete Set of Mesoscale Surface Analyses IV Complete Set of 850-mb and 500-mb Analyses 216 218 220 232 ACKNOWLEDGEMENTS .. ... ... 241 BIOGRAPHICAL NOTE . ... . . . . ... 243 r r r
CHAPTER 1: IN TRODUCTI CON
Deep convection, as evidenced by the occurrence of thunderstorms,
is frequent and widespread. Conceptually, the air-mass thunderstorm
is the simplest and most easily understood. Surface diabatic effects,
both heating and moistening, act to create a boundary layer that is
gravitationally unstable to vertical displacements. This surface heating is immediately realized as an increase in the ambient
temperature, and when the vertical lapse rate of temperature in the
environment exceeds the dry-adiabatic lapse rate, the sensible and
latent heat are transported and mixed upward by turbulence and small-scale convective overturning. Through a continuation of this
process, or perhaps by forced lifting, the rising surface air cools sufficiently to produce condensation, which provides an additional
source of heating from the phase change of vapor to liquid. This latent heating acts to balance part of the cooling from the adiabatic expansion of the rising air. In an environment where the temperature
lapse rate exceeds that of the rising moist air, the rising air will
become positively buoyant, its internal energy being converted to kinetic and potential energy. The air then continues to rise until it becomes negatively buoyant, generally near the tropopause. This type
of thunderstorm, generally consisting of a single cell in a
non-sheared environment, has a lifetime of an hour or two, and occurs
over many regions of the globe.
In the mid-latitudes, migratory cyclones and anticyclones are
other types of convection. The circulations of these systems are capable of transporting heat and moisture over large distances. For example, they can transport the moist maritime boundary layer over strongly heated land to create strong convective instability. In addition, the cyclones have associated fields of divergence and
vertical velocities that can act to produce favored regions of thunderstorm development. The cold-frontal rainband is an example of the cyclone determining the position of the convection.
Furthermore, these cyclones typically develop in regions of strong baroclinity and are thus characterized by vertical wind
shears. These vertical shears can influence the characteristics and
lifetimes of the associated convection; warm-sector squall lines and super-cell thunderstorms are examples of deep convection where shear is an important factor. The lifetimes of these systems are generally
much longer than those of air-mass thunderstorms.
In addition to these basic types of deep convection, observations have shown the existence of thunderstorms that occur above a low-level
inversion (Fujita, 1963; Ferguson, 1967). The purpose of this thesis is to investigate this "elevated convection" as it occurs in association with extratropical cyclones. Initially, let this be defined as thunderstorm activity that occurs in an environment that is characterized by a gravitationally stable planetary boundary layer stable planetary boundary layer overlain by a layer that is less stable. There is not an a priori assumption that the generating instability is gravitational or even that any hydrostatic instability
hydrostatic instability will be used to describe the existence of a
layer in the atmosphere where positive buoyancy is felt by a given
parcel of air moving through the static environment. If the total integrated buoyancy for a parcel from its original position to its cloud top position is positive, the sounding is said to have latent instability (Darkow, 1982). Potential instability refers to the possible development of an hydrostatically unstable lapse rate as an entire layer is lifted and becomes saturated (aeeaz<0). It is
reasonable to assume that lightning, the identifying characteristic of elevated convection, requires vertical velocities on the order of one meter per second or more (personal communication, R. E. Orville, 1982). With the vertical velocities generally associated with synoptic-scale cyclones an order of magnitude less, it is postulated that a smaller scale instability is present. It is this instability that we will investigate.
The required stratification for elevated convection is typically found in the overrunning region extending away from the surface warm and cold fronts associated with extratropical cyclones (i.e., those regions other than the classical warm sector). The importance of
overrunning precipitation for the south-central United States was discussed by Muller (1977). Although not differentiating the type of precipitation as convective or stratiform, he found that for New
Orleans, from 1971-1974, 17% of the total precipitation was a result
of frontal overrunning, most of which fell from winter to mid-spring. The frequency and extent of thunderstorms occurring in an overrunning
situation is not known. Furthermore, with the possibility that such storms play a role in heavy precipitation, synoptic development, and severe events, it is an important topic of research.
Also, the similarities and differences between thunderstorms rooted in the boundary layer and those that occur above a frontal surface are not known. It is not understood whether the mechanisms
that initiate boundary layer thunderstorms are responsible for elevated thunderstorms or if other mechanisms exist. The structure of elevated thunderstorms has only been touched on previously. If elevated convection has mesoscale structure, an interesting question is whether any of the proposed mechanisms for classical convection are responsible for that structure. These mechanisms, as well as the background of our present understanding of small-scale
structure above frontal surfaces, will be discussed in the next chapter.
The approach of this thesis will be to present first a
comprehensive climatology of elevated convection for the United
States. The spatial and temporal variations of elevated thunderstorms will be included as well as the mean thermodynamic and dynamic structure of the large-scale environment. This part of the thesis is presented in chapter 3.
Then, to ascertain the detailed structure of elevated convection,
a mesoscale analysis of the AVE-SESAME I experiment is presented in chapter 4. This well-observed storm was associated with extensive elevated convection and serves as an excellent example of the great
10
complexity of structure of elevated convection.
Finally, chapter 5 will summarize the findings, state the conslusions of this study, and suggest problems for future research.
CHAPTER 2: BACKGROUND
The descriptive models of the extratropical cyclone, put forth by the Norwegians (Bjerknes, 1919), have stood up reasonably well against
the test of time. This apparent success may have contributed to a
division in research between the large scale (>1000 km in horizontal
extent) and the convective scale (10 km in horizontal extent).
Without considering the smaller scale processes great advances were made in understanding the physics of extratropical cyclones through
baroclinic instability theory (Charney, 1947; Eady, 1949). On the other hand, early work on thunderstorms focused on the forecasting of
the associated severe events. In so doing, the investigators looked
at the characteristics of the larger-scale environment of the
convection and found that features typifying extratropical cyclones
were apparently important in the development of severe convection.
Fawbush et al. (1951) looked at tornadic storms and found that
vertical wind shear, temperature advection and vorticity patterns, all characteristic of a baroclinic environment, were important indicators
of convection. Another frequently observed relationship is the
occurrence of thunderstorms with the passage of a cold front. The
large majority of severe convective events occur in the warm sector
associated with supercells, pre-frontal squall lines or cold frontal rainbands and the main emphasis of research on thunderstorms is now
focused in that direction. Warm sector events and thunderstorms that occur simultaneously with the passage of a surface cold front will not
be addressed in this dissertation.
Perhaps equally familiar, but receiving far less attention, are thunderstorms that occur above a frontal surface in an overrunning
situation. The classic description of the warm front is of warm air
that gradually ascends over a wedge of cold air, accompanied by
widespread stratiform clouds and precipitation. Since the occurrence
of thunderstorms near the warm front is not an element of this basic model, they have often been overlooked. Frequently, this convection
is described as "a few embedded thunderstorms" (Weber and Wilderotter, 1981) without knowledge of anything about the source or structure of
these storms.
The identification of smaller scale structures became possible as observation techniques improved. Identifying small scale structure in
warm-frontal bands was aided by the use of autographic rainguage
networks (e.g., Harrold, 1973) and the development of radar.
Mesoscale features associated with extratropical cyclones were first observed using radar in the early 1950's. Marshall (1953) identified
'generating elements' in the mid-troposphere (=15,000 ft), spaced
aboud 30 km apart, and associated with the observed streaking of snow as it fell through a sheared environment. Marshall suggested that the
'generating elements' were advected by the upper level winds and regulated the observed snowfall.
Gunn et al. (1954) extended the work of Marshall by looking at winter precipitation events at Montreal, Canada. Of the 22 cases
exhibited small-scale structure. Of these cases, those that had instability above the frontal surface sufficient to support convective
activity (7 of the 22) showed the least amount of mesoscale
organization. On the days with instability, the echoes were usually in the vicinity of the frontal surface and extended upward an average
of 4,500 ft.
Austin and Houze (1970) were the first to classify a nesting of
the various sizes of precipitation areas associated with cyclones. They felt that two distinct mesoscale sizes (in areal extent) existed
between the convective scale and the synoptic scale. They identified
these sizes as the large mesoscale area (LMSA) covering 10
3 to 104
km2, and the small mesoscale area (SMSA) covering 50 to 103 km2. The
nesting was such that the LMSA consisted of several distinct SMSA's
which in turn contained the individual convective elements. In studying a variety of storms in New England with both radar and
precipitation gauges, they found that LMSA's lasted from 2-5 hours and
SMSA's on the order of 1 hour. The identification of these
intermediate scales was important in directing future research in that no previously known lifting mechanism was of that scale. This was particularly true since observational studies showed that mesoscale
structure associated with extratropical cyclones was nearly
ubiquitous. As it became clear that a large fraction of the
precipitation that occurs in conjunction with cyclonic-scale vertical
motions in frontal zones is in the form of bands and showers,
concentrated on the associated dynamics and thermodynamics.
Early on, Hewson (1937) demonstrated a relationship between
potential instability in the warm sector and the subsequent rainfall associated with the warm front. As the potential instability for any layer in the troposphere of the warm sector increased, he observed a corresponding increase in the precipitation amount north of the
front. Normand (1938) discussed the release of latent instability
through the lifting of a potentially unstable layer and Dexter (1944)
suggested this as the acting mechanism for warm frontal thunderstorms. Kreitzberg and Brown (1970) found that convection observed above a frontal surface was frequently aligned parallel to the wind shear in the convective layer and advanced eastward more rapidly than the
surface front. They associated the generation of potential
instability with the rapid advance of a 'pre-frontal cold surge' in the mid-troposphere. Their proposed scenario incorporated the release of that potential instability by the synoptic-scale ascent. The convective mixing was apparently so efficient that the atmosphere
becare barotropic, reestablishing a baroclinic zone farther west.
This rather discontinuous process of overrunning is in sharp contrast
to the previously proposed slow stable ascent associated with the warm
frontal process. They identified distinct warm tongues that had
apparently been transported over the frontal surface to establish
regions of strong potential instability. They reported a strong
correlation between the convection and these 'baroclinic leaves' and thus concluded that it was the thermodynamics that governed the
mesoscale patterns.
The University of Washington's CYCLonic Extratropical Storms
(CYCLES) Project (see for example, Hobbs et al. 1980) has contributed a great deal of information about the microphysical and mesoscale
structure of several types of bands associated with synoptic-scale
cyclones. Herzegh and Hobbs (1980) discussed several rainbands
positioned perpendicular to a warm front that they felt were
associated with generating cells aloft.
A CYCLES case study presented by Matejka et al. (1980) showed
results similar to those of Kreitzberg and Brown (1970) with rainbands
in potentially unstable air behind a pre-frontal cold surge above the
warm front. They felt these bands, aligned perpendicular to the
background wind, were the result of the release of potential instability generated by the overrunning of the warm front by the cold air.
The release of potential instability by synoptic-scale motions was
investigated numerically by Kreitzberg and Perkey (1976 and 1977).
They proposed that large-scale convergence provided sufficient lift to
release the instability. In their numerical simulation they used a
sounding that showed potential instability above a warm-frontal zone.
A cumulus cloud parameterization model was used that allowed for
instability in more than one layer. The layer with the largest
integrated buoyancy (which they called the level of maximum releasable
instability) was selected as the initial cloud base. The initial
sinusoidal decrease on both sides with a wavelength of 720 km. The initial widespread cyclonic-scale ascent had a peak value of 7.5 cm/s at mid-levels. Early in the run 'convection' was very active above the frontal surface with the convective plume showing a peak in the
vertical velocity of 8 m/s, clearly strong enough to generate
lightning.
The convective heating, in turn, forced low-level convergence and
increased the vertical motion on the mesoscale from 7.5 cm/s to 14.4
cm/s at 6 km. The mean subsidence from the parameterized convection
was more than offset by the corresponding mesoscale ascent keeping the
environment saturated. Most of the potential instability was
effectively removed by the convection at 460 minutes into the
integration with the wavelength of the area affected by convection
limited to about 1/3 that of the moisture wavelength.
An interesting result of their experiment is that after the
convection neutralized the environment, the existing mesoscale
circulation, originally established by the convective heating, did not
decay but actually narrowed and intensified. The resurgence of the
circulation peaked at about 10 hours into the run with a maximum vertical velocity of over 21 cm/s. This mesoscale circulation was
apparently driven by the diabatic heating of the stable
condensation. Interestingly, most of the precipitation from the run
fell after the stable mesoscale circulation became dominant. This
suggests that mesoscale circulations can be initiated by convection and can actually persist and strengthen after all latent instability
has been released. The remaining updrafts in the hydrostatically
neutral atmosphere can produce substantial amounts of precipitation.
Brown (1979) showed the development of a similar circulation
system in his numerical simulation of saturated mesoscale anvils. He
found that the positive feedback between the mid-tropospheric heating
and convection was possible as long as there was subsidence in the
cloud base environment. The subsidence acted to maintain a warm
trough and an inwardly directed pressure gradient that forced the
low-level convergence.
Further advances in the understanding of mesoscale circulations
came with the application of symmetric instability. Emanuel (1979)
and Bennetts and Hoskins (1979) developed the theoretical models that
define the circulation that develops in the presence of strong
vertical shear for both dry and moist atmospheres, respectively. The instability is manifested as slanted two-dimensional rolls aligned
along the mean baroclinic shear. This dynamic instability is
appealing in that it provides a lifting mechanism that acts on the mesoscale.
Bennetts and Sharp (1982) investigated the growth rate of
conditional symmetric instability and tested their results with
observations. Rainbands were observed in 80% of the cases where there
was predicted growth. However, the growth rate of conditional
symmetric instability is much slower than that for cumulus convection and would therefore be dominated by convection if both instabilities
An interesting question is what determines when and where the convection breaks out after the thermodynamical environment conducive
to convection has been established. Many recent studies of deep
cumulus convection have investigated the various mechanisms to which
the actual initialization of the storms can be attributed.
Circulations associated with cold fronts (Koch and McCarthy, 1982),
low-level jets (Means, 1944; Pitchford and London, 1962), drylines
(Schaefer, 1973), and thunderstorm outflow boundaries (Fujita, 1963)
have all been shown to trigger convection in some situations.
Boundary-layer processes such as surface heating and moistening to
remove a stable cap (Colby, 1983), or circulations driven by
irregularities in surface heating forcing convergence (e.g., the
'inland sea-breeze', Sun and Ogura, 1979), shown to be important for
some convection, are not possible triggering mechanisms for elevated
convection if the convection originates above the frontal inversion.
Gravity waves have also been proposed as a possible triggering
mechanism for thunderstorms. Observations have shown that in some
cases gravity waves can be ducted and propagate great distances
without dissipating (e.g., Bosart and Cussen, 1973). Lindzen and Tung
(1976) showed that the stratification required to trap a gravity wave is a stable layer adjacent to the surface overlain by an unstable
layer which contains a critical level for the propagating wave.
Qualitatively this is the same environment as that required for
elevated convection. The coexistence of elevated convection and
Ferguson (1967). Lindzen (1974) discussed wave-CISK (conditional
instability of the second kind) in which latent heat released in
convection appears capable of efficiently forcing the gravity waves, which in turn act to organize the convection. This process requires a
vertically propagating wave so that there is a phase shift with
height. However, since the waves associated with elevated convection
are most likely trapped, there is not a phase shift with height and
the wave-CISK argument does not work. This leaves the possibility
that the vertical displacement associated with the wave can lift the environment to the point that it becomes hydrostatically unstable and
thus trigger convection. Several case studies have shown a strong
modulation of convection by ducted gravity waves (e.g., Miller and
Sanders, 1980). However, the actual initialization of convection by
this process has not been clearly demonstrated. Uccellini (1975) felt he was able to show this, yet, as will be discussed in chapter 4, his
model appears incompatible with his data.
The actual number of case studies involving elevated convection
is very small. Ferguson (1967) examined a squall line, accompanied by
snow, small hail and gusty surface winds, that travelled over a
low-level arctic-frontal zone for nearly 1000 km at a speed of
approximately 20 m/s. The squall line appeared to form ahead of and
parallel to a diffuse arctic cold front and at right angles to an
east-west oriented stationary front. The southern end of the line
extended well south of the surface front. There was a low-level west-southwesterly jet in the warm sector, however Ferguson did not
investigate any possible relationship between it and the line. He did
feel the line was significant enough to affect short-range forecasting
and even speculated that such waves could influence the subsequent formation of synoptic-scale short-wave troughs.
A case study of a long-lived mesoscale circulation system was
presented by Sanders and Paine (1975). In their case, an advancing cold front was able to trigger deep cumulus convection above the
frontal surface as a moist potentially unstable boundary layer was
displaced upward. Once the convection was initiated, an intense
mesoscale downdraft-updraft couplet developed. This circulation
developed into a nearly steady-state situation producing large amounts
of rainfall. Thunder was heard up to five hours after the frontal wind shift, yet the atmosphere was essentially neutrally stratified
two hours after the front had passed. The remaining circulation was
apparently maintained by a cooling and heating couplet, the cooling
from the evaporation of cloud tops into the drier air aloft and the heating being the result of the adiabatic ascent of moist air. In
many ways this system resembled the one modelled by Brown (1979).
The above discussion has outlined the highlights of the
development of our present understanding of sub-synoptic scale
structure associated with extratropical cyclones. It seems
reasonable to assume that elevated convection (as previously defined)
is an element of this structure and with that in mind we can make
several points about the reason for doing this work. To date, climatologies of sub-synoptic scale structure specifically associated
with extratropical cyclones have been limited in regional extent
due to the use of radar and small-scale raingauge networks. The
studies have generally dealt with precipitation and precipitation
intensity without specifically identifying precipitation that is
accompanied by lightning. The choice of lightning, a routinely
reported phenomenon, as an identifier makes possible a comprehensive study without requiring a special project.
CHAPTER 3: CLIMATOLOGICAL SURVEY
3.1 IINTRODUCTICN
Studies of the spatial and temporal variation of atmospheric phenomena, as well as their specific characteristics, have served as the cornerstone of synoptic meteorology since its infancy. The knowledge of these various features has often led to the development
of hypotheses on the structure and physical processes associated with such phenomena. These original ideas have then served to motivate the development and testing of subsequent theories. The bulk of such descriptive meteorology was done during the early part of this century with a gradual shift in recent years towards more theoretical
approaches. This shift has not precluded the writing of important
fundamental observational papers, such as Sanders and Gyakum (1980) on the 'bomb' or Bonner (1968) on the low-level jet. It is important to continue the use of descriptive meteorology and climatology in motivating theory and not to limit the use of observations to serving merely as examples of an independently derived theory. It is in this light that we have established the seasonal, diurnal, and geographical variation of elevated convection in the United States.
This chapter will be devoted to the presentation of a descriptive climatology of elevated convection associated with extratropical baroclinic systems. There have been many previous climatological
Court and Griffiths, 1982) which have undoubtedly included elevated convection in their data sets. To date, no study has distinguished
this type of convection as a separate entity, let alone determined a
specific climatology. Instead of devoting an entire section to reviewing these general studies, an attempt will be made to incorporate specific parts to support or contrast various conclusions that are being drawn in this chapter.
In this part of the study we will define an elevated thunderstorm as a thunderstorm that occurs on the 'cold' side of an analyzed synoptic-scale surface front, the thunderstorm itself being
identified by an inspection of plotted surface hourlies on NMC surface maps. The thunderstorm should have an identifiable 'elevated source'
of air above the boundary layer that has more latent instability than the air at the surface. The frontal inversion is then acting as a lower boundary for the convective storm.
This particular study utilized the standard National Weather
Service upper-air and surface analyses over a four year period as a
data source to collect a large number of individual cases. All
surface fronts were accepted without further investigation as being that type analyzed by the National Meteorological Center (NMC).
Section 3.2 describes the details of the data source and the individual selection process. Section 3.3 deals with the geographical, seasonal, and diurnal variations of elevated convection, while section 3.4 presents a summary of the environment with which
associated synoptic types and, finally, a summary of the chapter is
presented in section 3.6.
3.2 DATA SOURCE AND SELECTION PROCESS
To collect a large sample of observations of elevated
thunderstorms, it was first necessary to design a procedure that was not only successful at selecting the correct observations, but was
also feasible to do in a reasonable amount of time. For this purpose, the National Weather Service analyses that are routinely archived at the Massachusetts Institute of Technology were utilized since they were both immediately available and a four-year archive is continually maintained. The maps used were the standard surface analysis, 850-mb constant-pressure analysis and 500-mb constant-pressure analysis for North America. It was necessary to limit the study to 00 GMT and 12 GMT, which correspond to the twice-daily upper-air observations, to avoid interpolation in both space and time in determining the upper-level characteristics. The four-year period that was used in the study ran from September 1978 to August 1982. Table 3.1
summarizes this period and the number of surface maps that were
available. The number of maps utilized for each month was approximately the same, with slightly more in March and November and slightly fewer in February and December.
A specific set of criteria was used in the selection of events. These criteria were applied to an observation plotted on a surface
Table 3.1
Table 3.1. Summary of the available surface maps for the four year period
of study. 00 GMT and 12 GMT were used, giving a possible two maps for each day. Monthly and yearly sums are shown as well as the percentage of the total
possible.
Year
Jan
Feb
Mar
Apr
May
June
July
Aug
Sep
Oct
Nov
Dec
Total
1978 - - - - - - 46 51 59 44 200 1979 54 47 58 49 59 57 60 56 52 47 55 46 640 1980 54 50 60 44 50 50 46 54 49 55 56 52 620
1981
60
45
57
60
53
51
54
46
53
54
55
51
639
1982 48 54 60 54 56 56 58 58 - - - - 444Total
216
196
235
207
218
214
218
214
200
207
225
193
2543
%
of
possible 87% 87% 95% 86% 88% 89% 88% 86% 83% 83% 94% 78% 87% availablemap, which was reporting a thunderstorm, to determine if the
thunderstorm was likely to have originated from an elevated source.
These criteria are listed below.
1 . The observation had to lie on the cold side of an analyzed
front which showed a clear contrast in temperature, dew-point temperature, and wind.
2. The station's wind, temperature, and dew-point temperature had to be similar to the immediately surrounding values.
3. An apparent source of air with higher equivalent potential
temperature had to lie on the warm side of the analyzed front.
When interpreting the collected data, we will assume that the air above the frontal surface had previously existed as a surface boundary layer. With this in mind, the third criteria was necessary to ensure that the overriding air had more convective potential than the underlying boundary layer. Some frontal boundaries separating warm, moist air and hot, dry air were found to either have no gradient in 8e or higher 6e's on the cooler side.
When an observation was found that met these three criteria
the event was recorded and the station's temperature, dew-point temperature, wind direction, and altimeter setting were recorded. A
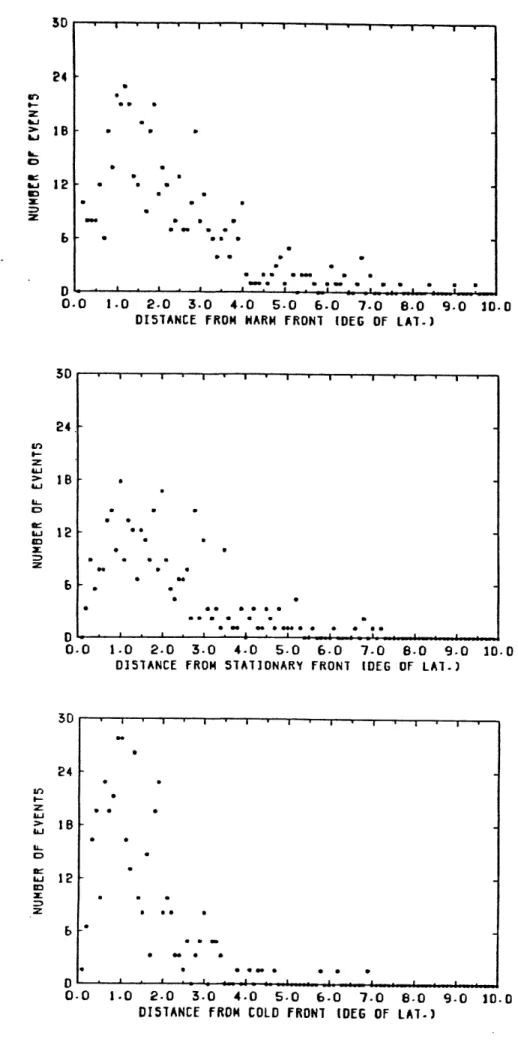
log was kept of the orientation with respect to the associated low center (if one existed) and analyzed front, as well as a simple sketch of the synoptic configuration. The distance, normal to the front,
that the thunderstorm was displaced into the cold air was also recorded. If more than one station was reporting a thunderstorm each one was recorded as an individual event. Over the 48 months studied, a total of 1378 events were selected using these criteria.
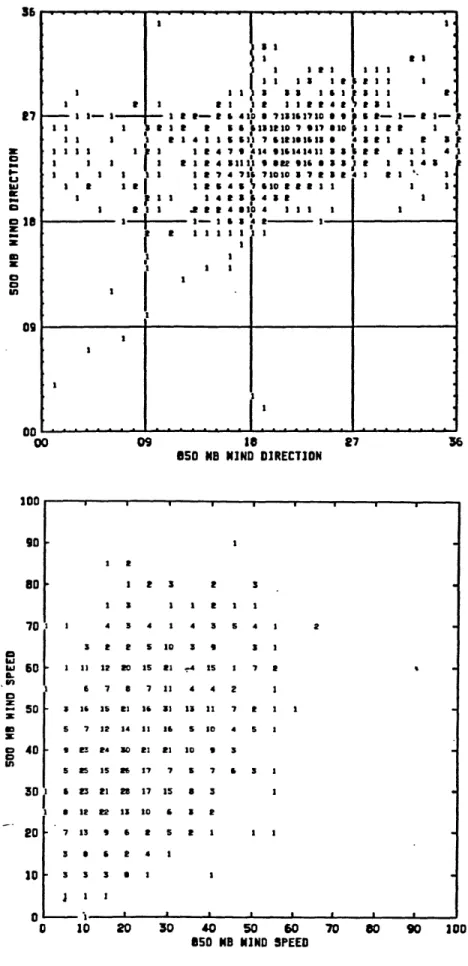
The next step in the survey was the collection of the
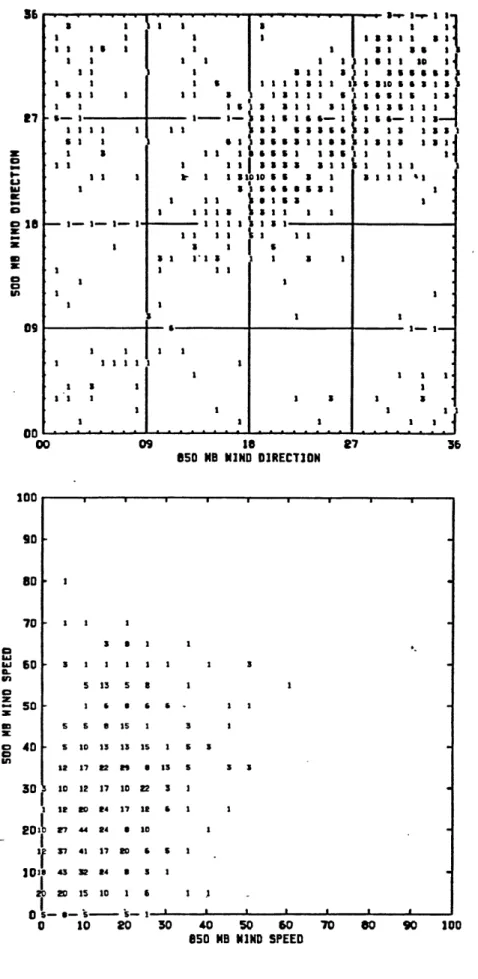
corresponding upper-air data for each event. The parameters used were
the 850-mb temperature, dew-point temperature, wind speed, and
wind direction as well as the 500-mb temperature, wind speed, and wind direction. The 850-mb geopotential height was recorded to allow the calculation of the station pressure. It was necessary to interpolate between soundings to estimate these values for those stations that were not radiosonde stations. An inspection of the wind field gave the qualitative relationship between an event and both the exit/entrance region and cyclonic/anticyclonic shear region of a wind maximum (if one existed). In this chapter a wind maximum will be defined as an identifiably stronger wind ( > 5 knots on the plotted charts) at one or more stations when compared with the immediately surrounding stations. If the estimated horizontal wind shear was cyclonic (anticyclonic) the event was recorded as being on the cyclonic (anticyclonic) side of the wind maximum. If the flow was estimated to be difluent (confluent) the event was recorded as being in the exit (entrance) region. If the winds over several of the
surrounding stations were uniform, no wind maximum was identified and a null case was recorded.
The compiled data were then put into a data file on a PDP-11/44. After the data were entered, further requirements were placed on the
collected events. A filtering program was run that eliminated all
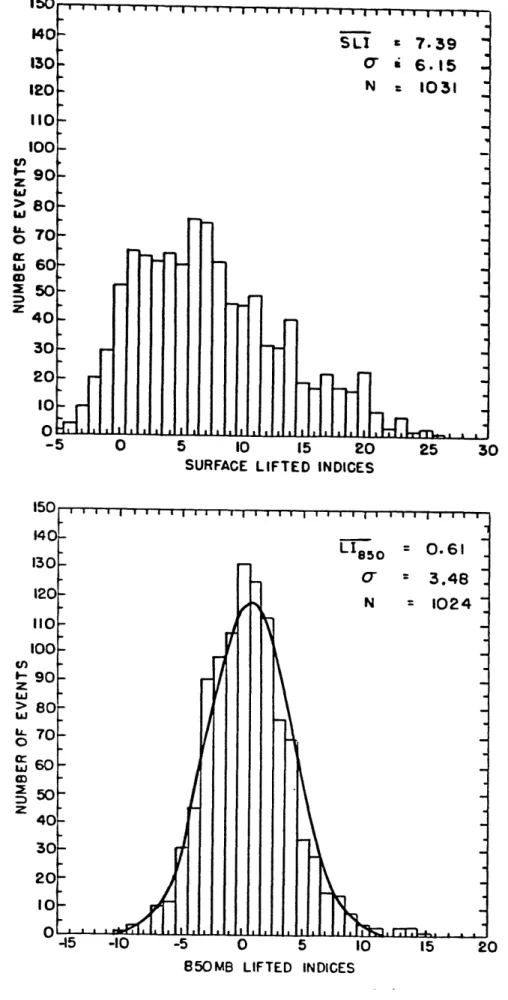
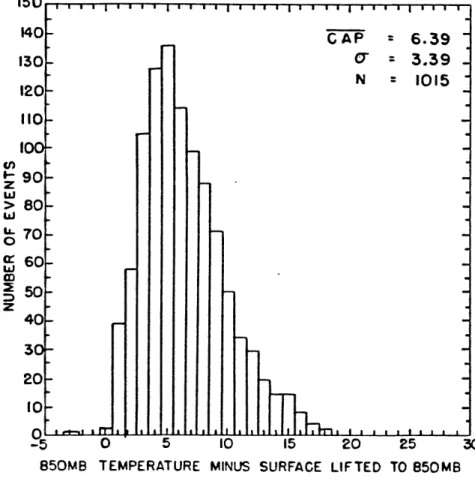
events where 1) the calculated surface pressure was less than 860 mb so that the 850-mb air was the surface air or 2) the surface air, when
lifted pseudo-adiabatically to 500 mb, was the same temperature or
warmer than the 850-mb air lifted to 500 mb. A total of 285 cases
were eliminated. Most of those eliminated were from June, July, and August (164); most likely the result of poorly defined and/or analyzed
fronts. In the remaining nine months, 18 cases were thrown out
because the surface pressure was too low and 103 cases were eliminated due to no change or a decrease in the potential temperature from the surface to 850 mb.
It is possible that cases of elevated convection that occurred in mountainous regions may have been wrongly removed by the criteria
requiring horizontal homogeneity in temperature and wind with
surrounding stations. Also, those cases where the surface elevation was near or above the 850-mb level would have been eliminated. The
effect of these biases will be discussed in the next section.
The final data set contains 1093 cases recorded over the four year period. It is felt that this set of observations consists only of cases where the 'classical' concept of cumulus convection was not
occurring. The instability was evidently taking place above the
frontal inversion, with vertical velocities that were strong enough to generate the observed lightning and precipitation. This filtered data set was then used to construct the climatology of elevated convection presented here. It was possible to look not only at the geographical
and seasonal variations but also at some of the thermodynamic and
dynaric characteristics of the observed environment. The following
3.3 GEOGRAPHICAL, SEASONAL, AND DIURNAL VARIATICNS
GEOGRAPHICAL AND SEASONAL
Figure 3.1 (a) shows the mean annual number of days with thunderstorms of any type and Figure 3.1(b) shows the geographical distribution of the total sample of 1093 cases in this study. The apparent localized clustering of points is a result of multiple observations for a single station. The greatest concentration of events extends from the central Gulf Coast northward to the upper Mississippi and Ohio River Valleys, with the western edge running north-south along the eastern slope of the Rockies. The maximum in the distribution for elevated thunderstorms extends much farther north than that for all thunderstorms. The sharp cutoff in the frequency distribution over south-western Texas is positioned along the
southward extending axis of the climatologically preferred region of
cyclogenesis in eastern Colorado. This is apparently the western
limit of low-level moisture penetration from the Gulf of Mexico. West of this axis the low-level circulation associated with developing cyclones would be unfavorable for transporting moisture from the Gulf of Mexico into the synoptic system. A similar cutoff is observed in the total distribution of thunderstorms.
The region of high concentration shows a gradual decrease in events towards the East Coast. This gradient is only evident over the
(a)
(b)
Figure 3.1(a). The mean annual number of days with thunderstorms, by station, 1951-1975 (Court and Griffiths, 1982). (b). The distribution of the
1093 cases of elevated convection identified over the four year period from September, 1978 to August, 1982.
Northeast in the distribution for all thunderstorms, which shows a north to south gradient from Virginia to a maximum in Florida. The most striking contrast between the two distributions is over the
Florida Peninsula where no elevated thunderstorms were observed.
Figure 3.2(a) shows the observed distribution of the mean number of thunderstorm days for the months October through March compiled by Court and Griffiths (1982) for the period 1951-1975, and Figure 3.2(b) shows the corresponding distribution of the events observed in this study. The distribution of elevated thunderstorms compares favorably with the distribution of thunderstorm days. Such characteristics as the strong gradient of events across Texas and the central Gulf coast maximum are clearly present in both distributions. The near absence of observed elevated thunderstorms over the western United States in the present study, although possibly an artifact of the effect of irregular and mountainous terrain on the selection process, seems to be well supported by the low number of mean thunderstorm days. Once again the largest contrast between the distributions is over the Florida Peninsula where the absence of elevated thunderstorms suggests the persistence of convection rooted in the boundary layer throughout
the year.
To get a better indication of what fraction of observed winter-season thunderstorms are of the elevated type, a projection can be made of the number of events expected from a given sample of observations using the frequency percentage of occurrence of thunder. Values of the observed frequency of thunder for the winter-season
101 S ..
,
. . . , 6• / * . . A - .*--
, . A - .I IMEAN NUMBERS OF DAYS
\
,4..'" " " . " ---'-,.|-,-00 < C 5
(a)
S
-* .
* *g'\ * 0.
POLR. R. PROJECTO. • .-" ._: .AHIC
A S LN.o Oo
t.
o o* o o *o . *----
\n
TPUE Al LATITUDE SV*
Figure 3.2. (a) The mean number of days with thunderstorms during
winter, by station, for the period October through March, 1951-1975.
(after Court and Griffiths, 1982). (b) The location of elevated
thunderstorm cases in this study for the period October through March,
(defined as the months December through February) were obtained from the Airway Meteorological Atlas of the United States (United States Weather Bureau, 1946) and represented the percent fraction of all
hourlies for that individual station that included a report of
thunder. The maximum value was 0.5% for Houston, Texas. The average number of observations used for each station was 59,355 with a range in sample size of from 17,544 for Danville, Virginia to 85,133 for
Chicago, Illinois. A group of 35 stations was selected which
contained all those stations east of the Rockies that had a frequency percentage greater than or equal to 0.1%. The group did not
include stations in Florida. Adjusting the present study for missing maps, a total of 605 maps over the four winter seasons were used giving a total of 21,175 observations from the 35 stations. Utilizing the sum of the individual percentages the projected total number of observations reporting thunder for the 35 stations was 40 while the observed total was 33 (82.5% of the projected total). The observed value is most likely low since it has been assumed that all 35 stations were plotted on each of the maps inspected, not allowing for station reports that were missing. This result is strongly suggestive
that nearly all winter-season thunderstorms over the United States east of the Rockies, with the exception of the Florida Peninsula, are
of the elevated type.
Figure 3.3(a-1) shows the four-year monthly spatial distributions
for the study period. The frequency distributions will be presented in the next part, however, some understanding of them may be obtained
Figure 3.3(a-1). Monthly composites of the distribution of elevated thunderstorm events for the four year period from September, 1978 to August, 1982.
(a) January
(b) February
(d) April
(e) May
(g) July
(h) August
(j) October
(k) November
from figure 3.3 as all events are plotted. January and February show a maximum of occurrences over the south central United States. The January events were limited to the Gulf Coast with the exception of one year (1982) that accounted for all of the northern events for that month. This concentration of events along the Gulf Coast would appear to be tied to the development of the southern storm track (see Figure 3.4) that is able to tap the maritime air from over the warm Gulf of Mexico. March shows a continuation of events along the Gulf Coast with additional occurrences well to the north. As with January, part of the northwest expansion is explained by a rather anomalous year
(1979).
April shows a large northward expansion of the maximum
concentration while retaining the high frequency along the Gulf Coast. This is correlated with the increase in solar heating of the surface layer at a time when extratropical cyclones are still frequent and widespread over the United States. The month of May shows a shrinkage and a northwestward shift of the center to the central Great
Plains. A very striking change from April to May is the rapid decline
of events on the Gulf Coast. This is probably the result of two changes taking place; first, fewer synoptic systems travel across the Gulf Coast in May than in April. Second, and perhaps more important, is the relaxation of the temperature contrast between the land and the
water. A sharp land to sea temperature contrast frequently
contributes, through diabatic effects, to the in situ development of a front along the coast. In the absence of this local effect, the
Figure 3.4. The number of lows per normalized 5* X 5' tessera on
1230 GYT sea-level pressure maps. (a) September through November,
occurrence of overrunning along the coast decreases dramatically (Hsu, 1981) resulting in the decrease of elevated convection.
The northwestward shift continues with the month of June. In July and August the distributions become more scattered with a decrease in events over Texas and Oklahoma from those observed in
June.
In September the maximum concentration is over the northern Great Plains with very little southern extent. This northern maximum is tied to the early season storm track across southern Canada which limits the southern advance of cold air to the northern tier of states. The absence of cold air would appear to be the limiting factor since there is not a lack of latent instability over much of the United States as is evidenced by the presence of ground-based convection throughout the summer.
The September maximum concentration is what should be expected if compared with the cyclone frequency distribution for the fall (Figure 3.4(a)) which shows a minimum in the number of lows extending from the western Gulf Coast east-northeastward across the United States, explaining the limited southern extent.
October shows a dispersion in the distribution to cover the full north to south extent of the Mississippi basin. This dispersion continues, and in November and December the events become widely scattered showing no preferred region. Unfortunately, with so few cases it is not possible to determine which are anomalous events and which represent consistent changes in the annual distribution. Figure
3.4 shows more than a doubling of the number of lows over the lower Mississippi River from fall to winter and it is this increase that
accounts for the development of the concentration already discussed for January.
Figure 3.5(a) shows the frequency distribution of all events by month. From a minimum in November there is a gradual recovery through the month of February associated with the increased frequency of lows along the Gulf Coast. There is then a rapid increase to the primary peak in the distribution in April. This April peak is associated with strong instability (the result of the upper atmosphere being cold and the surface boundary layer being rapidly heated prior to being lifted over the frontal surface), and the frequent advances of cold Canadian
air southward. These conditions combine to create an optimum
situation for elevated convection. In May the frequency drops to slightly higher than that for March most likely due to a decline in synoptic systems and frontal strength. The high frequency of events continues into June before a rapid decrease to a relative minimum in
July. This minimum is the result of a decrease in the number of
extratropical cyclones over the United States as well as a general
decrease in the thermodynamic instability (Johns, 1982). The
frequency then increases to a secondary maximum in September, as the
number of lows increases, before rapidly dropping to the minimum in
Noverber. This minimum is most likely the result of a combination of the low sun angle (i.e., a minimum in surface heating) and the absence of cold surface air early in the winter season.
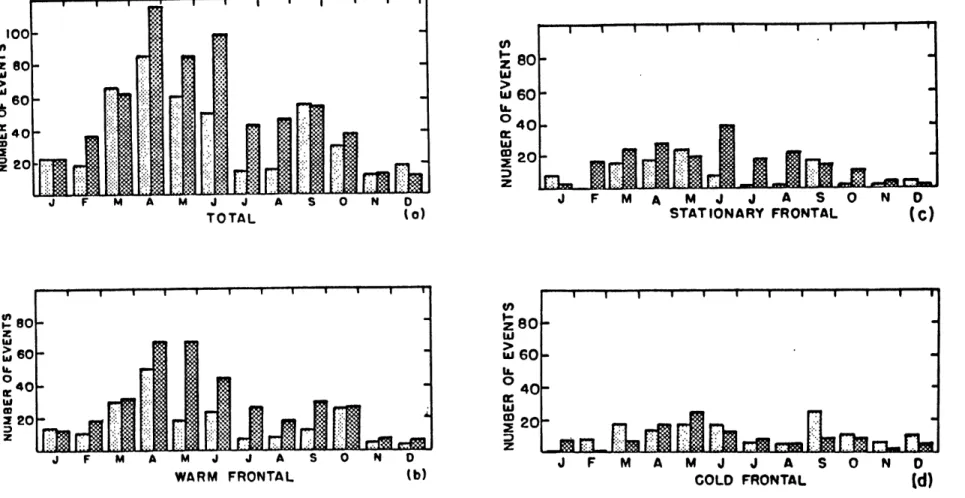
200 180 " 160 140 120 . 0 100 I 80 2 z 60 40 20 200 180 160 > 140 o 120 ca 100 2 80 z 60 40 20 J F M A M J J A S 0 N 0 TOTAL Ca) JF MAMJ JASON D WARM FRONTAL (b) I I I I I I I I I I -J ',, -i - " -i. . .. ' ! I I I ! I I l I l i I -I -,
-H nn o
J -WAMFRNAL-b 0100 W 80so 6o w 40 20 2o I . .. - .es p - - I J F M A M J J A S O N D OTHERS (e)Figure 3.5. The frequency distributions, by month, of the elevated thunderstorm events for a) the total sample, b) the warm frontal
cases, c) the stationary frontal cases, d) the cold frontal cases and
e) others (see text for explanation).
Thus, the annual variation of elevated convection is bimodal with a primary maximum in April and a secondary maximum in September. The distribution is a result of the combination of a winter maximum in extratropical cyclones and a late spring maximum in thermodynamic instability.
Further insights are possible if the population of events is divided according to the particular type of front with which they are associated. Figures 3.5(b-d) show the monthly distributions for warm, stationary, and cold fronts, respectively. Figure 3.5(e) shows the distribution for those events where the report is positioned in the occluded part of the storm with no clear relationship with either the warm or cold front ('others').
During the fall, September through November, the distributions for the three frontal types show a similar decrease. The warm-frontal storms show a sharp increase in January, from the minimum in December, which is reflected in the concentration of events along the Gulf Coast (see Figure 3.3(a)). The rest of the warm-frontal distribution is very similar to the distribution for the entire sample.
The stationary-frontal distribution shows an interesting
flattening from the spring through June. This is likely the result of an increase in analyzed stationary fronts as the storm track migrates northward, increasing the number of trailing fronts over the United
States.
The distribution for cold-frontal elevated convection shows a slightly different characteristic. There is a slight peak in December
which is not easily explained on physical grounds but is possibly the result of a few anomalous events that have combined to show a detectable peak in a rather small sample size. The cold-frontal type does show a consistent increase from January through the month of May. This type does not show the same decrease in events from April to May as with the other two frontal types. The summer minimum is also shifted by one month to August.
Figures 3.6(a-c) show the percent occurrence of each frontal type by month. Warm-frontal cases make up nearly half of the total sample, with stationary-frontal and cold-frontal cases each accounting for one quarter of the events. The observed monthly variations show an increased percentage of warm-frontal cases from January through April. This is also the period with a rapid increase in the number of events and is presumably associated with the increased insolation and continued strong frontal contrasts. The fraction of cold-frontal
cases is larger during the fall months and then again in May. During the summer months, when the westerlies are generally weaker and displaced farther north, a higher percentage of cases occur with stationary fronts.
IN TERANN UAL VARIATION
Owing to the dependence of the investigated elevated convection on the existence of a synoptic-scale front, a correlation would be expected between the region of convection and the large-scale circulation pattern if the fronts are typically associated with
30
H::
62Fi.
68 56 4:::[1
II 9 J F M A M J J A S 0 N 0WARM FRONTAL (a)
26 17 41 47 45 48 33 6 J F M A M J J A S 0 N D STATIONARY FRONTAL (b) : :: : : : I :: : J F M A M J J A S 0 COLD FRONTAL (c) N D
j
4 6%
29%
23%Figure 3.6. The monthly fractional percentage of the total sample for
a) warm fronts, b) stationary fronts, and c) cold fronts. The annual
percentage is shown by the dotted horizontal line with the sample size above each bar.
80
60
40
20
W
O Z80w
:60
U40
6-4z
S20 ui (L 8 060
1-40Z a. or20i 43 34 20 8 25 30 14 :::: :- ::t::::: . :X 97':: Z~='=
'"'
'""
"'
' ='
., ...
....
43
mid-latitude baroclinic systems. It has already been pointed out in the last section how some of the distributions were affected by a
large year-to-year variation. This interannual variation is easily
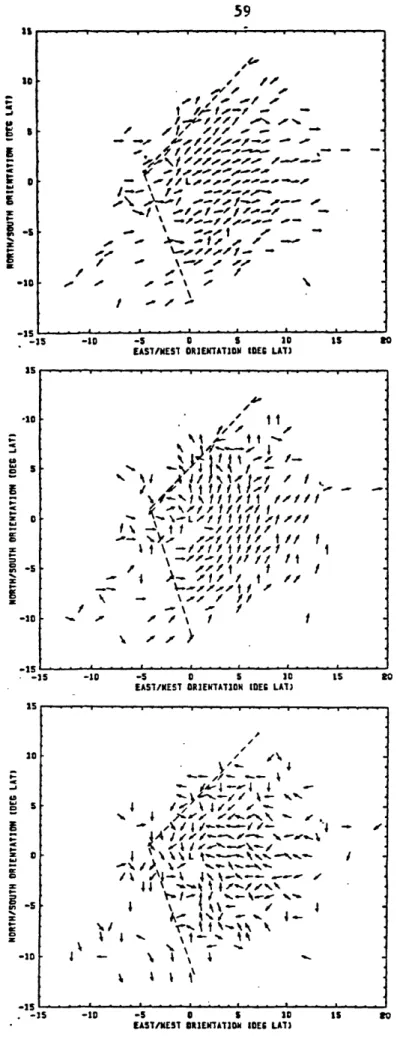
seen in Figures 3.7 (a & b) which contrast April, 1979 with April, 1980. The elevated convection occurs downstream from the mean trough position and generally on the cyclonic side of the mean 700-mb jet
position. This clear dependence is suggestive that elevated
convective regimes occur and are determined by fluctuations in the large-scale circulation.
DIURNAL VARIATICN
The diurnal variation of convection has been frequently
discussed. Unfortunately, most of the previous work has been focused on identifying the diurnal pattern of convection over the summer, the period of greatest activity. With the relatively small sample sizes for winter-season convection the various attempts at identifying a diurnal oscillation have not been conclusive. Shands (1948), in discussing the probability of thunderstorms beginning during each quarter day (6 hour groupings) during the winter season (Dec.-Feb.),
remarked that "there is a tendency toward the equalization of probabilities in all four periods of the day". His data suggested an
early morning (06-12 LST) minimum in thunderstorm occurrence,
particularly along the central Gulf Coast. He attributed this to the increased stability of the boundary layer in the morning. Although he
-V.---Figure 3.7. The distribution of events for a) April, 1979 and b) April, 1980. Solid lines represent the 700-mb mean height field, with the mean jet position marked by a heavy arrowed line.
suggested a corresponding afternoon maximum, it was not evident in his data. The highest probability at a single station (Vicksburg, 3.3%) did occur between 12-18 LST, but the pattern was not consistent for
all stations.
The Airway Meteorological Atlas of the United States (United States Weather Bureau, 1946) shows an evening maximum and a mid-day minimum for Little Rock, Arkansas, Shreveport, and New Orleans, Louisiana for the month of January (See Figure 3.8). Contrarily, the
pattern for Houston, also shown in Figure 3.8, is opposite in phase.
Wallace (1975), grouping neighboring stations to get larger
sample sizes, concluded that a "substantial" diurnal cycle in winter-season convective activity (Dec.-Feb.) exists and has a
nocturnal maximum. He notes that Florida and southern Georgia,
displaying a late afternoon (=18 LST) maximum, are exceptions. This is in agreement with the previously suggested persistence of insolational thunderstorms in this region throughout the winter. Figure 3.9(a)
(Wallace, 1975) shows a vectorial display of the diurnal cycle in
thunderstorm frequency during the winter season. The region
corresponding to the maximum frequency of elevated convection for the
winter season (see Figure 3.2(b)) shows a consistent midnight
maximum. Figure 3.9(b) shows Wallace's diurnal cycle for summer
season thunderstorms. The contrast between the two seasons is
striking. A strong, late afternoon maximum prevails over most of the country in the summer, intimately associated with the maximum in insolational heating. The one exception is the area with a nocturnal
-4: __ __~__I E~I
TIME
(LST)
O
3
6
9
12
15
18
21
24
LITTLE ROCK , ARKANSAS
SHREVEPORT , LOUISIANA
I
NEW ORLEANS , LOUISIANA
2
0
3
T E A HOUSTON , TEXAS2
Ir
Figure 3.8. The percent occurrence of thunder in hourly airway
surface observations for the month of January, for three hour periods
- C~ to 1-f j*9 '-55 p L. r 4i --
-
/lt)
3 AJ f1. /'
- A., O 25 I. t rot ,Figure 3.9. (a) The diurnal cycle in thunderstorm frequency during
the winter season (December-February). The phase is indicated by the orientation of the vector. A vector pointing from the north indicates a midnight maximum (LT), one pointing from the east is a 0600 LT
maximum, and so on. Barbs indicate 'normalized amplitude' of the
diurnal cycle, defined as the amplitude of the first harmonic divided by the 24-h mean. Each half barb represents 5%, each full barb 10%,
and each flag 50%. The plotted numbers are the 24-h mean frequencies
expressed in hundredths of percent of hours with thunderstorms. Dots
represent stations that were grouped together. (b) The diurnal cycle
in thunderstorm frequency during the summer season (June-August).
Plotting convention the same as for (a) except that mean frequencies
are expressed in percents. (Wallace, 1975)
maximum over the central plains states typically associated with a maximum in low level jet occurrences. Clearly, winter-season thunderstorms display characteristics that suggest they are separate phenomena and not merely the minimum in an annual cycle of convection
characterized by summer-season convection.
With only twice-daily observations being used in this study, it is not possible to independently examine the diurnal cycle. The total sample of 1093 cases consists of 458 events at 00 GMT and 635 events at 12 GMT. With 00 GMT, the center of Shand's suggested maximum, corresponding to 18 LST in the region of maximum occurrence, it is surprising to see that it contains the smallest sample. The 12 GMT maximum is in better agreement with Wallace's result suggesting a late night or early morning maximum.
Dexter (1944), in discussing warm-frontal precipitation and
thunderstorms, differentiated between the development of potential instability and the realization of latent instability. He felt that a
late evening and early morning maximum could be explained by the time lag between the time the surface boundary layer in the warm sector is heated and moistened, and the time when the instability is actually
released over the warm-frontal surface. Dexter's impression was that this delay between development and realization would be between six and ten hours. He also felt that when the boundary-layer air starts to cool in the evening, resulting in a lowering of the lifted condensation level (LCL), the thunderstorms would occur closer to the frontal boundary. It would not seem that this argument is valid,